
Credit cards are $4.3 trillion away from being “tapped out.”
By Wolf Richter for WOLF STREET.
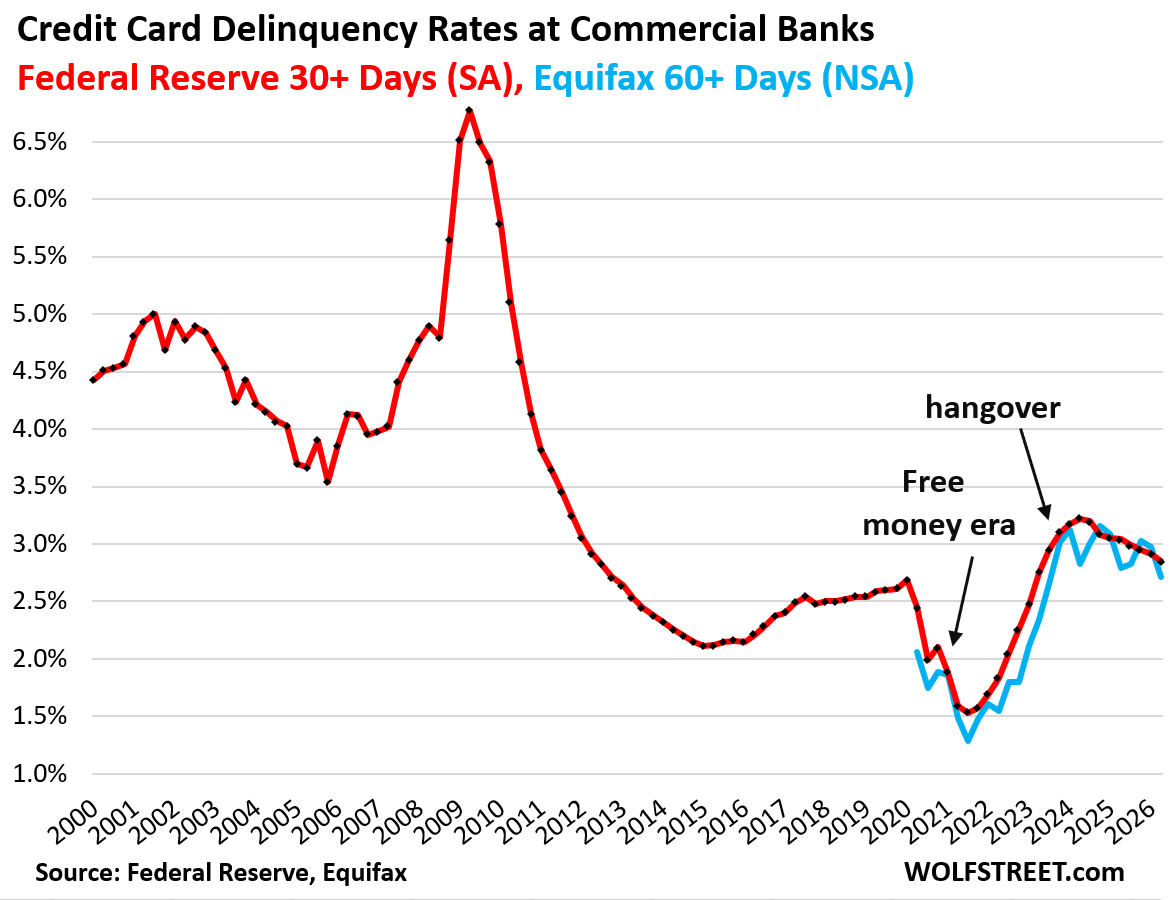
The 30-plus days delinquency rate on credit cards issued by all commercial banks declined to 2.85% in Q2, seasonally adjusted, the lowest since Q2 2023, down from 3.04% a year ago, and from 3.22% two years ago, according to Federal Reserve data released today, based on regulatory reports filed by all commercial banks (red in the chart).
The 60-plus days delinquency rate by all credit cards, including private label credit cards (such as store cards), and subprime credit cards, declined to 2.69%, at the end of Q2, down from 2.87% a year ago, and down from 3.04% two years ago, according to Equifax whose public data only goes back to June 2020 (blue line, not seasonally adjusted).
During the Free Money era, cash rained down upon households, while credit card spending for travel and other activities was limited by restrictions, and delinquency rates dropped to ultra-low levels. When that party came to an end, there was a bit of a hangover, but that hangover has been getting worked off.
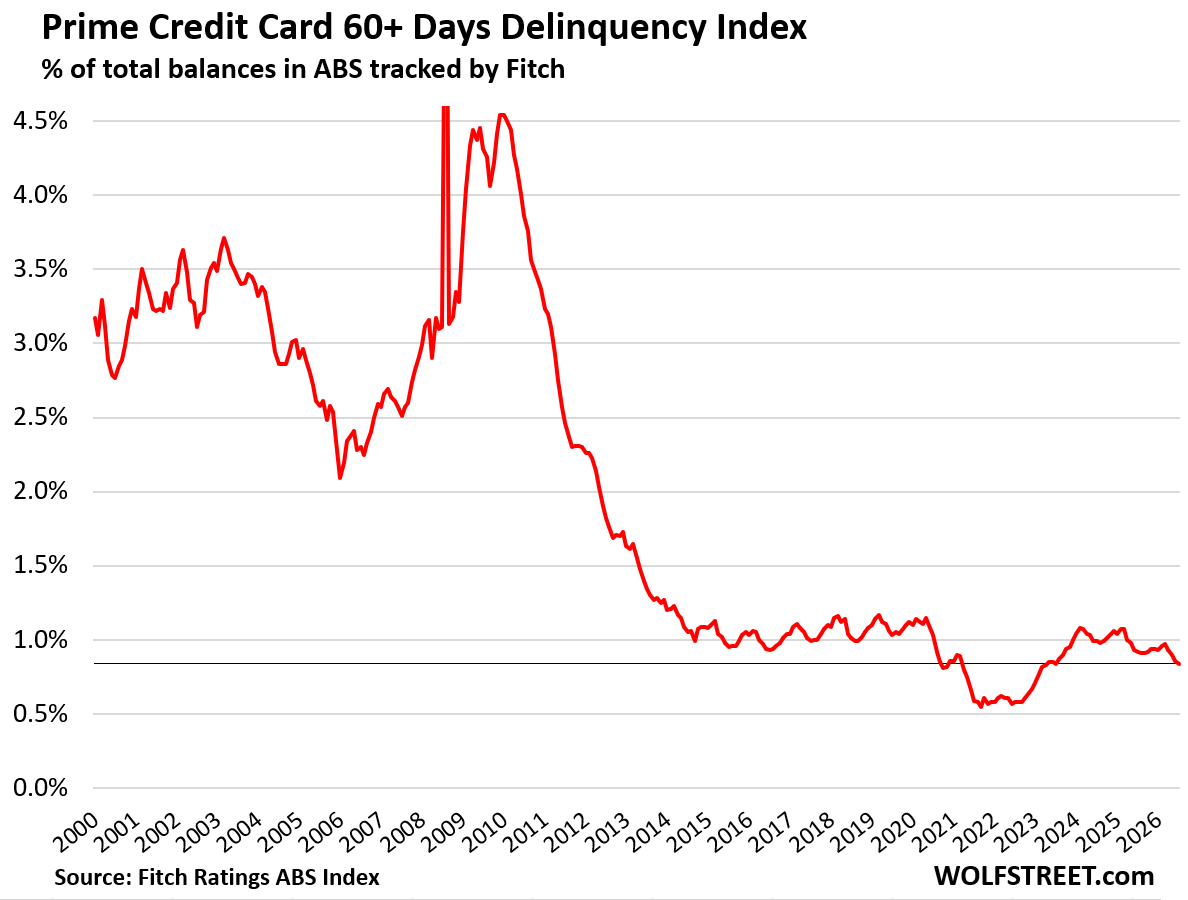
For prime-rated cardholders, the 60-plus days delinquency rate declined to 0.84%, the lowest since the free-money era, and well below any time before the free-money era, according to data from Fitch Ratings, which tracks the performance of Asset Backed Securities (ABS) backed by prime credit card balances.
The mystery of the 90-day plus delinquency rate. There has been some hullabaloo over the past year, based on the rising 90-plus days delinquency rate for credit cards, published by the New York Fed and based on Equifax credit reports. This rate was endlessly cited as Exhibit A of how consumers are cracking before our very eyes.
However, when the New York Fed released its Q2 Households Debt and Credit Report earlier in August, it clarified that issue in an interesting blogpost:
These were “stale, charged-off debts” that banks haven’t yet removed from their customers’ credit reporting as they might still be trying to collect those charged-off debts. This was a new trend. In pre-pandemic years, banks removed those stale charged-off debts from their credit reporting sooner, and those old charged-off debts would disappear from the Equifax 90-plus day delinquency rate. The New York Fed in its blogpost:
“We find that the stock delinquency rate is rising because of a pool of stale, charged-off debts that lenders have been reporting for longer durations, rather than a fundamental worsening in the incidence of delinquency.”
Credit card balances measure spending, not borrowing.
Credit card balances are statement balances before payments are made. They’re a measure of spending, not a measure of borrowing. Most of these charges get paid off every month by due date and never accrue interest.
Credit cards are the dominant consumer payments method for smaller purchases, such as for restaurants, travel reservations, online purchases, purchases at point-of-sale retail terminals such as at stores and stalls, wireless bills and streaming subscriptions charged automatically to the credit card, etc.
Credit card payment volume runs well ahead of debit card payment volume. Payments where credit cards are generally not accepted (rents, mortgage payments, etc.) and very large payments (down payments for a house, tax payments, auto purchases, etc.) tend to be made via check or ACH bank transfers. Cash is still being used by some holdouts, but mostly for small purchases.
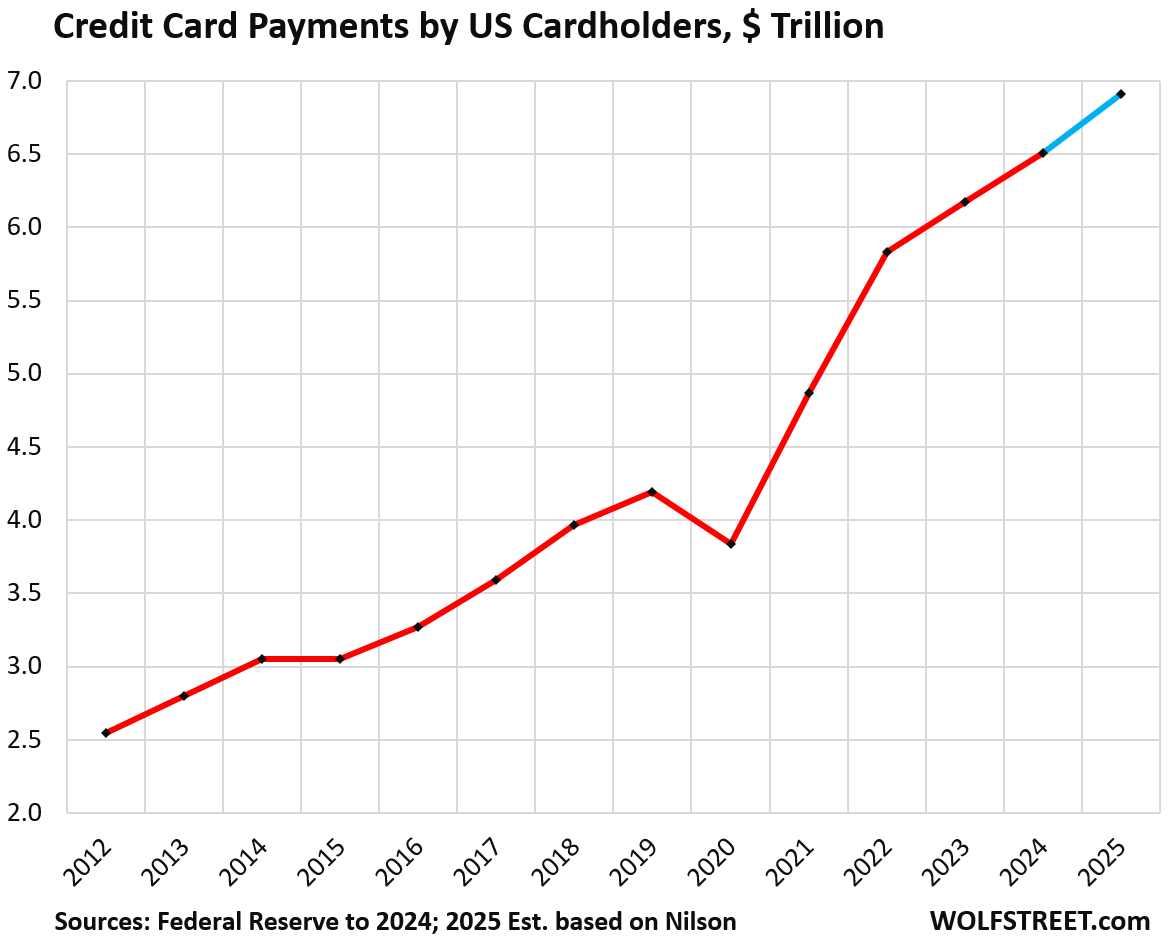
In 2024, consumers in the US paid for $6.51 trillion in goods and services with their credit cards, up by 11.7% from two years earlier, according to the Federal Reserve’s payments study, released in July.
The study does not provide data for 2025. But the Nilson Report estimated that in 2025, credit card payments grew by 6.1%. Credit card platforms, such as Visa, Mastercard, and American Express, have reported strong annual growth rates in credit card payments. For example, Visa reported in its most recent quarterly financials that payments volume by US cardholders rose by 9% year-over-year through Q1 2026, after somewhat slower growth rates last year (+6.8%).
So we can estimate that credit card payments grew by about 6.1% in 2025, which would amount to $6.9 trillion (estimate for 2025 indicated in blue). This is how much money flowed through US consumers’ credit cards per year:
Credit card balances.
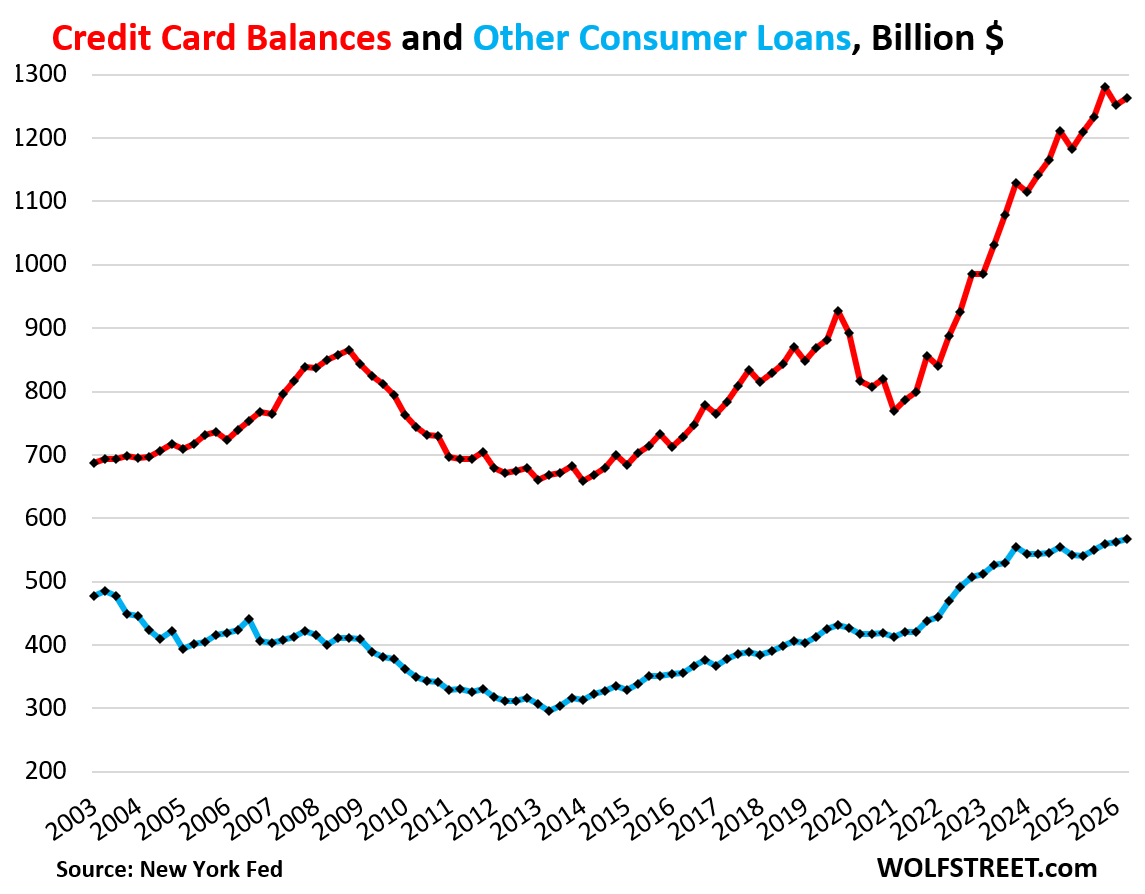
Credit card statement balances rose by $54 billion (+4.5%) year-over-year to $1.26 trillion, according to the New York Fed’s Household Debt and Credit report based on Equifax data (red line in the chart below).
The majority of those balances get paid off by due date and never accrue interest as cardholders are using the credit cards solely as a payment method, and not as a borrowing method/
While nearly $7 trillion flowed through credit cards in 12 months, statement balances rose by only $54 billion over the 12-month period.
“Other” consumer loans including BNPL (blue line) rose by $28 billion, or by 5.2%, year-over-year, to $568 billion. This category includes personal loans, Buy-Now-Pay-Later (BNPL) loans, payday loans, etc. These balances, except current BNPL balances, accrue interest.
The balances have barely risen over the past 23 years, despite population growth, income growth, spending growth, inflation, and now BNPL loans.
The burden of credit cards.
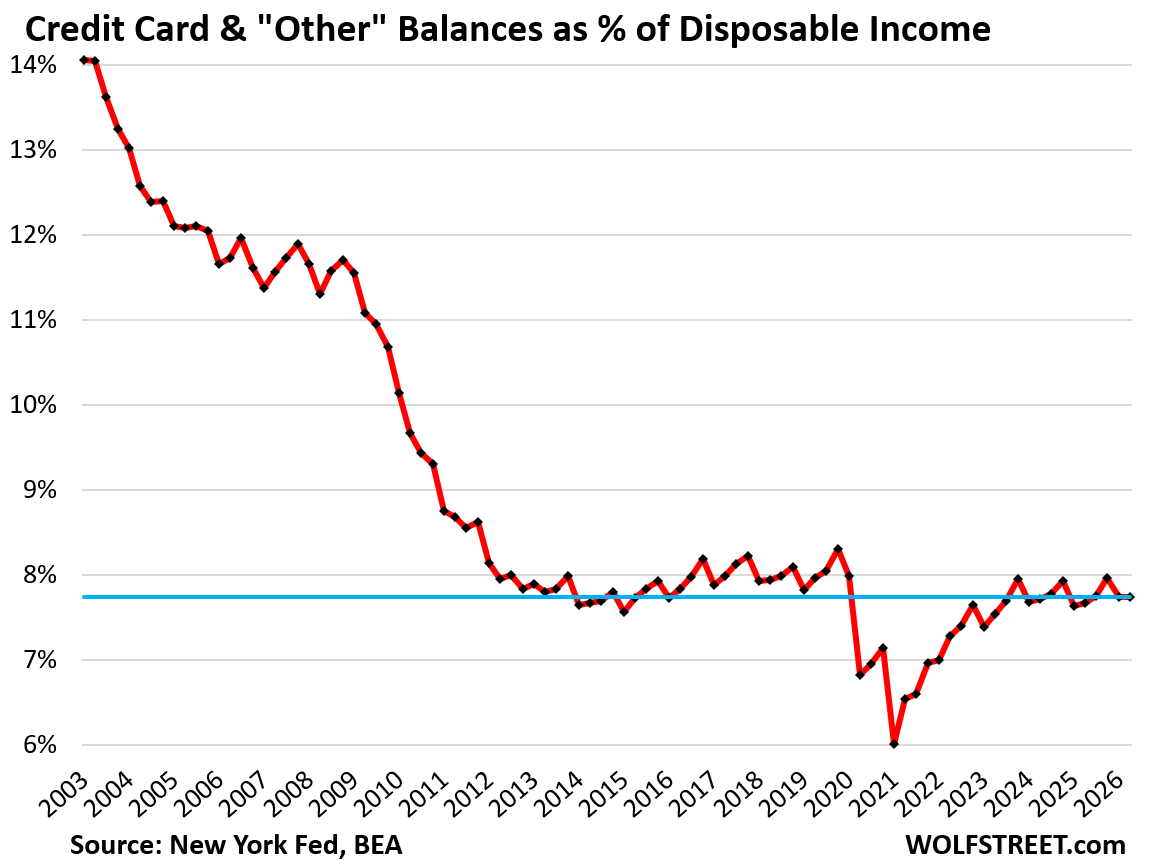
Credit card balances (red in the chart above) and “other” consumer debt (blue above) combined rose to $1.83 trillion.
The debt-to-income ratio is a classic way of evaluating the burden of a debt. Household disposable income, released by the Bureau of Economic Analysis, consists of after-tax wages, plus income from interest, dividends, rentals, farm income, small business income, transfer payments from the government, etc.
But it excludes capital gains, which is where the wealthy make most of their money. Excluded are thereby income from stock-based compensation plans and capital appreciation where billionaires make their billions.
The debt-to-disposable income ratio for credit cards and “other loans” combined was 7.75% in Q2, up a hair from a year ago (7.68%), and remains historically low, except for the free money era that distorted household disposable income out of all proportion.
How much room left on those credit cards?
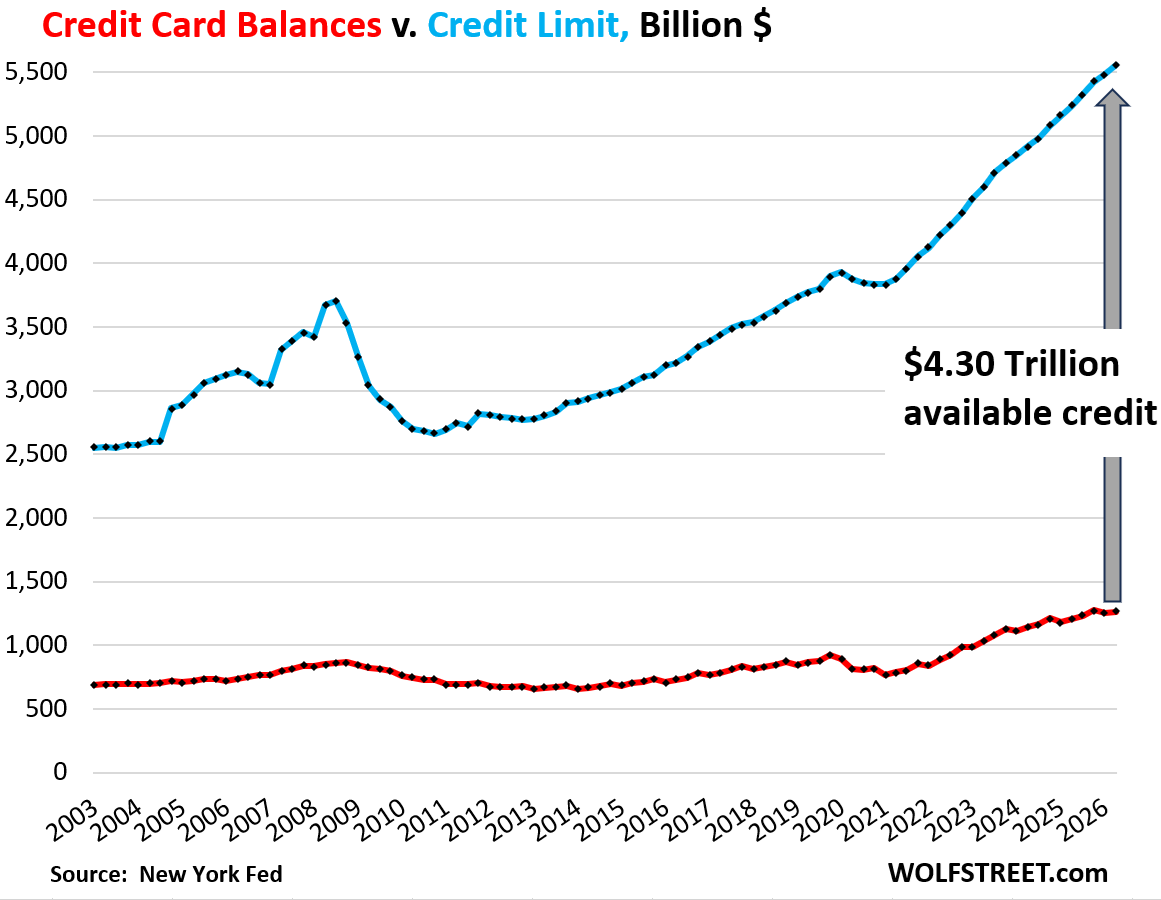
The aggregate credit limit rose by $324 billion year-over-year to a record $5.56 trillion (blue in the chart below). With credit card balances at a measly $1.26 trillion (red), the total available credit rose by $270 billion year-over-year to a record $4.30 trillion.
Banks make money on the swipe fees they earn every time a customer uses their credit card to pay. The merchant pays the swipe fees. In addition, many cards come with annual fees. These fees are a big profit center for banks, and so banks and their affiliate partners, such as airlines, aggressively market their cards to get people to set up new accounts. As inducement, they offer kickbacks to cardholders, such as 1% or 2% cash-back or miles or whatever.
This chart shows that credit cards are $4.3 trillion away from being “tapped out” (gray arrow). Households have been racking up hardly any credit card debts (red line), compared to their soaring credit limits (blue line). They’ve been so prudent with their credit cards, despite banks shoving huge credit limits down their throats, that it’s practically scandalous. Now if the federal government, the biggest drunken sailor of them all, could just be a quarter as prudent!
This rounds off my four-part quarterly analysis of household debt. Here are the other three parts:
The State of Americans’ Auto Debt
Enjoy reading WOLF STREET and want to support it? You can donate. I appreciate it immensely. Click on the mug to find out how:


Why didn’t “Credit Card and “Other” balances as a % of disposable income” spike during the great financial crisis?
What explains what looks like a post-2009 structural shift in that time series to a lower and somewhat stable percentage?
Is the story that the crisis wiped a lot of people off credit cards entirely?
It was sky-high before the Financial Crisis — consumers were already losing it by 2005 — and was a (small-ish) factor that contributed to the Financial Crisis. The mortgage-debt-to-income ratio was obviously a much bigger factor in the Financial Crisis. Consumers were massively over-indebted in 2005/6.
Have a look at the mortgage-debt-to-income ratio before the Financial Crisis, that’s why there was a Mortgage Crisis and a near collapse of the financial system.
https://wolfstreet.com/2026/08/12/here-come-the-helocs-mortgages-housing-debt-to-income-ratio-serious-delinquencies-and-foreclosures-in-q2-2026/
The under-utilization of total credit limit is interesting. Seems like prime rate customers at least have figured out how to work the system. Opening up more credit cards to get sign up bonuses (resulting in higher aggregate limit) and paying them off on time.
Meanwhile credit card companies are likely relying more on merchant fees. Which aren’t only paid by the merchant anymore! Many restaurants charge credit card fees now.
The DMV in San Francisco offered me a discount for paying cash last year. I said, Yes! That’s the result of 20 years of US litigation that the credit card companies finally lost. Before, merchants in the US were prevented from offering discounts to cash-payers or charging card-payers more.
According to the CA DMV, the California DMV does not offer discounts for cash payments, though paying with cash or debit can help you avoid the credit/debit service fees or credit card surcharges charged by some third-party partners or digital options.
Same as a discount. I paid less in cash than by card 🤣
You are right but the end result is same.
You pay leas for paying via check
Cash cash, Federal Reserve Notes, not a check. I’m not sure if they take checks for driver’s licenses.
several small businesses are now informing customers
pay with cash,debit or pay 3% for using cc
I don’t always carry $500+ in cash
——-
of course the proper solution is to make cc payment systems charge basic fee(not %) for their services
then we’d have visa/mastercard become pauper companies as their grifting would be gated
Wolf,
But they could always charge you more which not sure why some don’t add it on. If I pay my property taxes with credit card they charge 2.29% service fee. Since interest rates have gone up I still make money opening a 2% card with signing bonus and 12-18 months 0% on new purchases. I come out ahead about $800 which isn’t a lot but not peanuts.
“But they could always charge you more…”
No, you could not, not in the US. The contract between the merchant and the credit card system specified that the merchant can neither charge more for using a card, or give a discount for cash. Same price for all. That has now been deemed illegal, but it took about 20 years of court battle to establish that.
Is a city collecting property taxes considered a merchant? I guess if this recently passed I will find out in November to see if they either don’t allow credit cards anymore or simply eat the overhead.
Maybe so Maybe NO Wolf:
As a licensed GC, I ran around THE Bay Area with a couple of thousands cash in my pocket back in the day when I could run really fast; approximately ”early ’80s” and got LOTS of cash discounts from ” far East Bay” down to SC.
While I am clear that some of those were from others, MOST were from the owners of the suppliers.
Let’s be clear that ”cash” discounts have been going on since at least ”for eva” in all possible venues to avoid taxes,,,
OK, not forever, only since the GOVMINT(s) have been doing their best to stop ”free” enterprise…
You missed the topic. Your topic is being paid under the table to commit tax fraud and giving a discount for that v being paid by check.
The topic here is credit card swipe fees v paying cash to get a lower price (nothing to do with tax fraud, but with avoiding the swipe fees). You were not paid via credit cards in the early 1980s because they were in their infancy, and you didn’t have a mobile point-of-sale terminal, such as a smartphone, back then to process credit card payments on site, and you could not accept credit card payments, and never signed a credit card agreement with VISA. It’s that credit card agreement with VISA that prevented merchants from charging a higher price to customers who paid by card v those who paid cash/check.
15% of restaurants are charging a fee and growing. As a consumer, I find it offensive for various reasons.
My company accepted MILLIONS in credit card payments monthly… never passed along any “fees”.
Take it up with the bank – not the customer. Just bad business IMO.
Carry On…
My 2006 Silverado 1500 lost its brake fluid lines due to rust and road salt-induced corrosion last week. Tomorrow morning, I will pick it up at a local shop that did a total replacement of lines and fluid on it today.
The shop will get cash from me for the parts and labor. They do ask for a 3% extra fee for all work paid for on credit cards. That is totally reasonable and fair, I reckon. The shop has two lifts, and two mechanics. At the end of the day, they’ve worked for their customers and themselves; not for VISA or MasterCard.
Prairie,you have the time in future the nickel/copper lines bend and double flare very easily,great to work with and very damn corrosion resistent.
As a carpenter I definetly have 2 price levels,cash and check,cash always seems to be a better price!
That said semi-retired,do more work on folks autos then their homes.
The best part of being able to charge a card fee is you can raise your prices to account for the fees, then tack the fee on top of that for even more revenue.
Then people think they’re getting a deal by paying the cash price, when actually they’re still paying the extra few percent on card fees.
This is called decoy pricing, in marketing language.
commenter
Only a consumer idiot would fall for that. Ripoffs are everywhere. Competition exists for a reason. Shop around. We’re buying eggs now at $1.49 per dozen grade A large, same as three years ago, cash or credit card. But we’re not buying at ripoff stores such as Safeway.
Albertsons (Safeway, Vons, Pavilions, etc.) has large grade AA eggs on all month for $1.59 per dozen plus even more discounts in the online coupons. Pavilions and Vons have excellent prices on many items are an outstandingly nice grocery store these days.
Can anyone picture Jaime Dimon under a lift?
Sounds like you have to call your congressman. I think the fee for the cc should be charged directly to the card holder and not the merchant. This way customers would try to get the lowest fees or if they wanted rewards they would pay for them. Either way the cardholder would pay this would reduce cc fees over time imho.
I would expect that it also a driver of rates on cards being significantly higher these days. They have to milk the most out of those that do have revolving balances.
– I HAD a card with 14% pre-pandemic, but it has been at 23% since about 23′.
Great stuff, Wolf. Our drunken sailors seem to be staying in bounds! (For now).Thank you so much!
The problem is the drunken sailors in Washington.
And the bartenders and barmaids at the Fed supplying rounds of free money booze.
Nice life to be drunk with the tab always paid by someone else :)
In my area several places charge for card fees, usually 3% or less. I will pay cash or in the case of one local I write a check, he doesn’t use cards. The state DMV has also begun charging a dollar but with the distance that is less than fuel cost.
The poblem I see is the montrous increase in Real Estate Taxes. Being a bit cautious I have always tracked the yearly increase and the last few years have been outragous.
We have tracked the housing bubbles. Do we now track the reduction in taxes.
Not in this article’s baliwick, I know but added my two cents.
In most places, property taxes have stayed roughly constant as a percent of income. I’m states with zero or low income taxes, property taxes are generally higher, as the money has to come from somewhere.
This is a good news story. It surprised me. Interesting comments.
One thing I have noticed the past few years is that we no longer are inundated with CC offers. Capital 1 was the worst. Personal note: I only use a CC for gas at the pump, or for a bill that is too large for debit. I buy a lot of lumber from a local sawmill. Because I always pay cash I am allowed to go through the gate at any time, load up, keep my own tally sheet, and wait for the phone call to tell me my bill. Show up the next day with cash. Merchants have to eat CC costs so at my local lumber yard I use debit and pay at time of purchase even though I am on the books with an account. Same at restaurants, pay the server cash with tip, and avoid all that extortion % on the machine. As Ferris Bueller said, “See what a finsky can do to a guy’s attitude?” Most people seem to prefer cash in my experience.
Many of us NEVER USE CASH for anything as it creates all sorts of annoying extra accounting issues compared to single charging everything to a few credit cards and pay them off in full at the end of the month. Moreover, many credit cards offer 1% to 5% rewards making it foolish to use anything other than rewards credit cards to purchase anything.
Hmmm…I can get a 3% discount for paying with cash, vs. a 1.5% cashback bonus from my credit card company…but I’m wrong to pay with cash??
People should start requesting discounts to offset cost for having to drive to ATM to take cash so they can avoid “fees” using credit cards.
CC fees are cost of doing business.
And – smart operators now going cashless eliminating theft and additional banking duties.
It should be a federal law that any brick and mortar business in the United States of America is required to accept cash payments. I understand the convenience argument in favor of CCs, but to me, accepting cash is the price of freedom!
DOW 100k, NASDAQ 50k, S&P 20k, BitCON $250k, loaf of bread $20, pound of coffee $60, pound of beef $50, gallon of gasoline $20….keep pimping and pumping those bubbles, political scum….
Yeah, but median wages up 400%!
But unfortunately we had to suspend the social security COLA.
Bessent Faces Credibility Test in Quest to Tame Markets…
Long-Time reader, 1st time commenter.
I really appreciate this breakdown. Every social media post that says “Look Americans in $1tr in Credit card debt” shows the incorrect perspective of how credit+debit are the primary payment methods this century. I have “3-5K credit card debt” every month cause I build the current balance on everyday usage while paying off last month’s statement balances across 2-3 cards. I haven’t had a $0 credit card balance since my early 20s.
Plus, the interest-paying revolvers mostly have only a few thousand $ limits while a transactor like myself with 750+ score has like 100K+ limit across multiple cards and I’ll rarely ever have more than $5-10K balance.
BNPL is also debt, but its hidden in many data reports
I love this analysis, wish more people could actually grasp that aspect.