
Inventory for sale rose in all regions, was near all-time highs in the South, spiked in the Midwest to the highest since 2008.
By Wolf Richter for WOLF STREET.
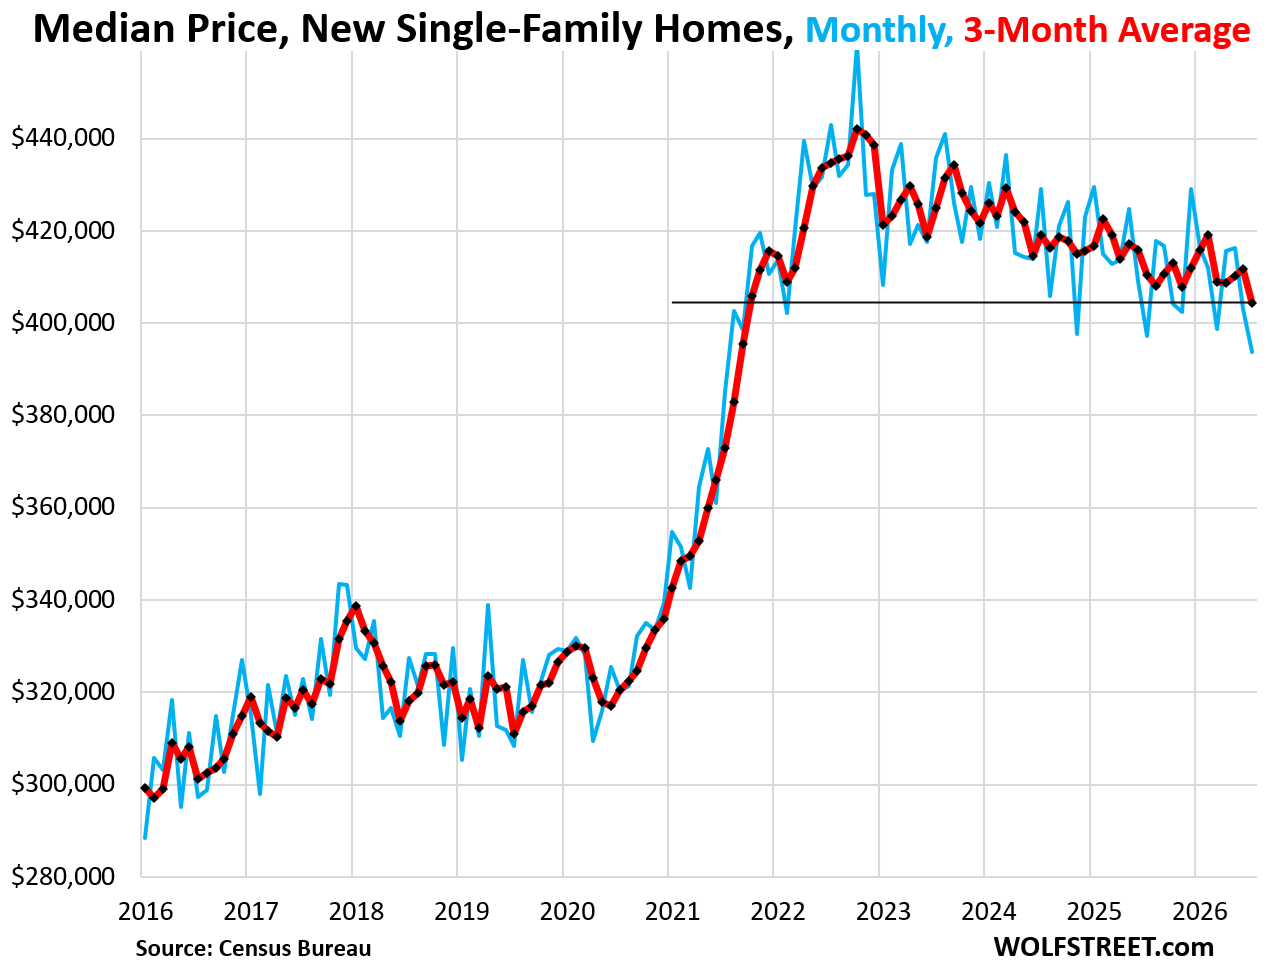
The big homebuilders, who have to build and sell homes to stay in business, have been adjusting to the new reality for nearly four years: The median price of new single-family homes sold in July declined by 1% from a year ago, and by 8.2% from two years ago, and by 14% from the peak in October 2022, to $393,800, the lowest since September 2021 (blue in the chart), according to data from the Census Bureau today.
But prices do not include the incentives and the substantial costs of mortgage-rate buydowns that homebuilders use to prop up their sales. Homebuilders include these costs in the average selling prices they report in their financial statements. But they’re not reflected here in the data from the Census Bureau. The data here reflects the prices that are written into sales contracts.
The three-month average median price, which irons out some of the monthly squiggles, fell by 1.5% year-over-year and by 7.2% from two years ago, to $404,400, the lowest since October 2021 (red).
In this environment, the big homebuilders, in order to keep their revenues up and protect or gain market share, have reduced price points, piled on incentives, and bought down mortgage rates, and it has reduced their gross margins substantially, crushed their net profits and share prices. Shares of the two biggest builders, DR Horton and Lennar, have plunged by 25% and 52% respectively since mid-September 2024.
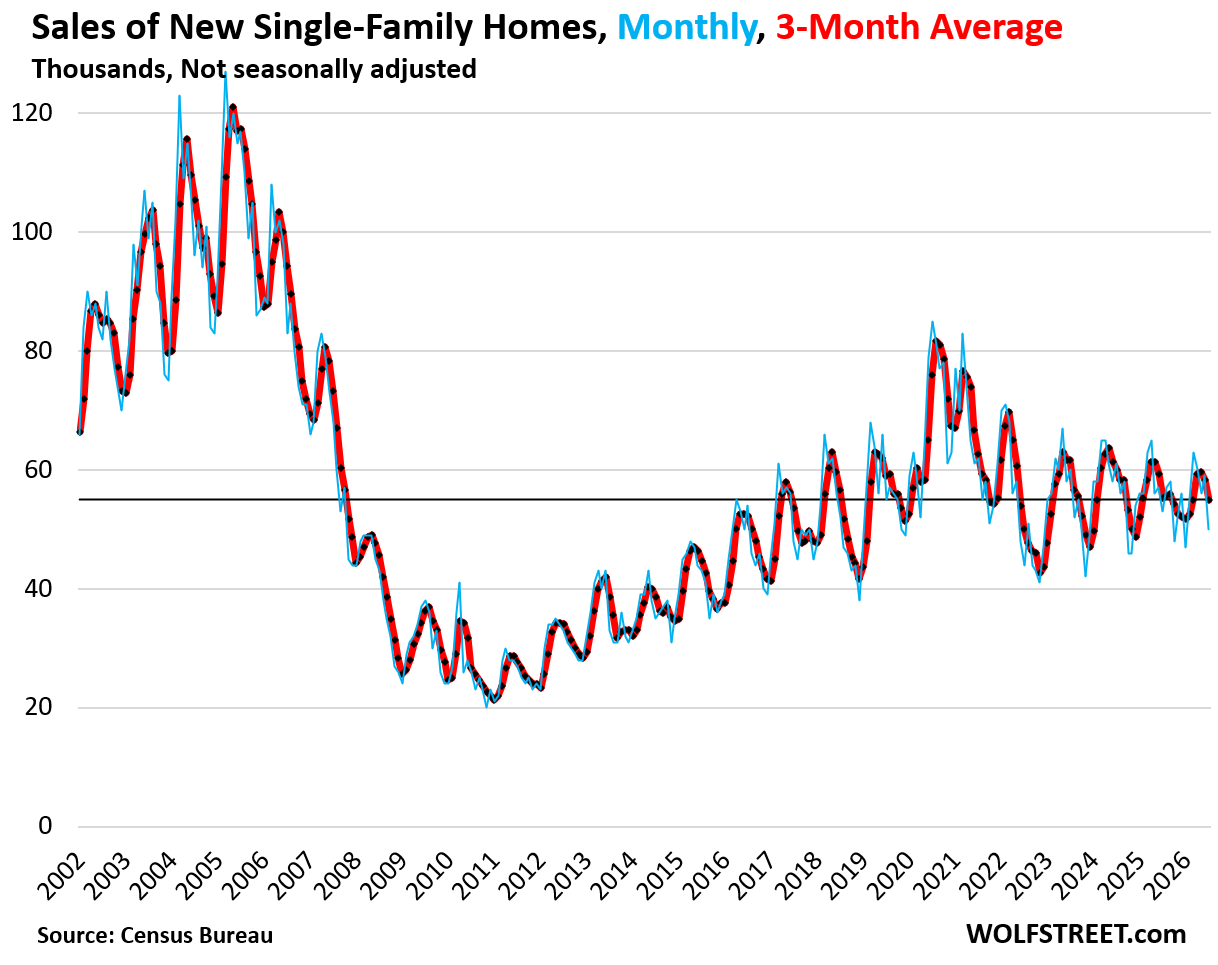
Sales of new single-family homes at all stages of construction fell by 5.7% year-over-year in July, to 55,000 homes. Compared to July 2019, sales were down by 9%.
Three-month average sales fell by 0.6% from a year ago, the seventh month in a row of year-over-year declines.
Of those total sales, 63% occurred in the South and 28% in the West (91% combined). The remaining sales occurred in the Northeast and Midwest.
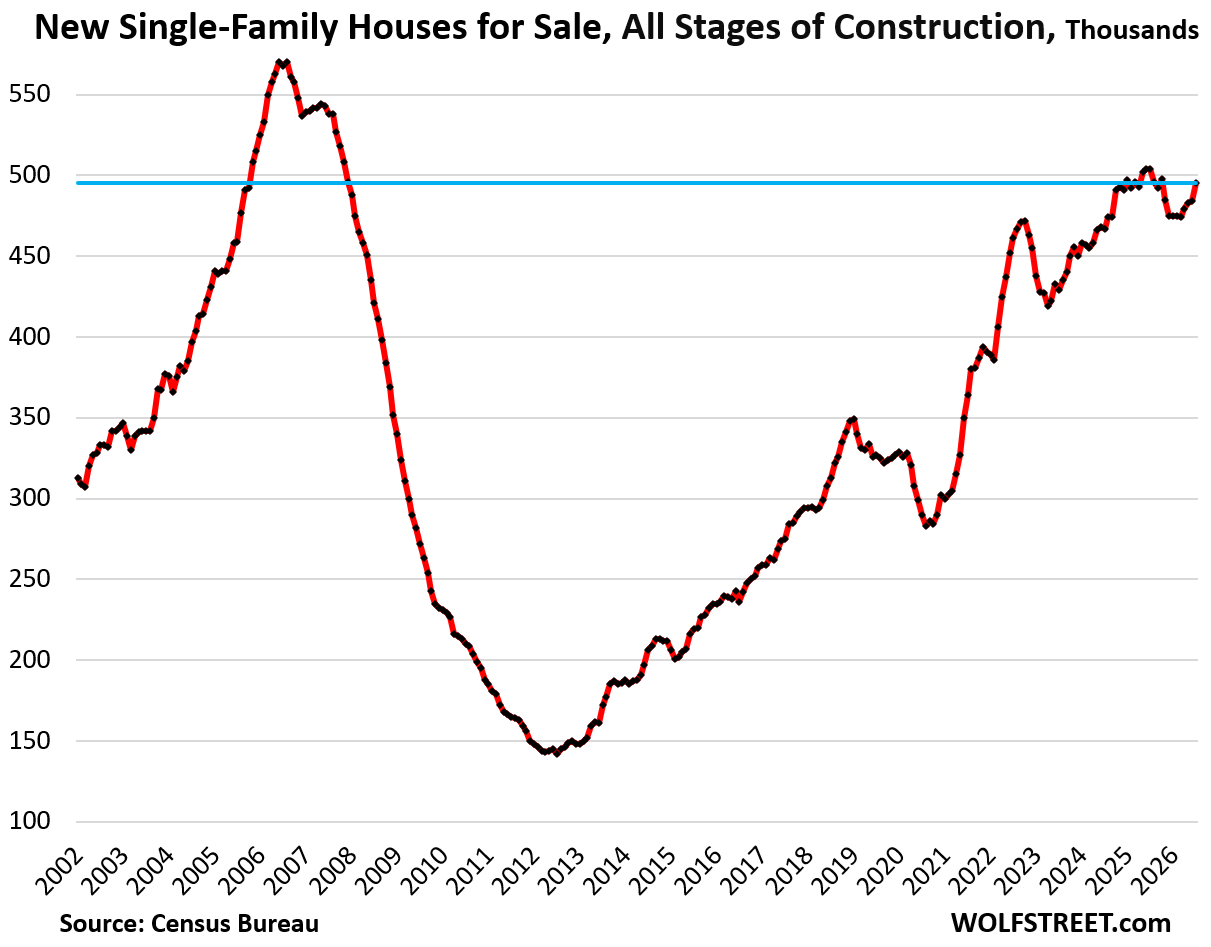
Inventory of single-family homes at all stages of construction jumped to 495,000, the fourth month in a row of month-to-month increases.
The decline in sales and the increase in inventory so far this year roughly track the increase in mortgage rates.
Compared to July 2019, inventory for sale has soared by 71%.
Regionally, 61% of this inventory was in the South (with 63% of the sales), and 21% was in the West (with 28% of the sales).
These new additions to the US housing stock are precisely what the housing market needs the most, and homebuilders are building it. They’re are sitting on 9.6 months of supply at the current rate of sales. Build them, and they will come – maybe, if the price is low enough and the incentives high enough.
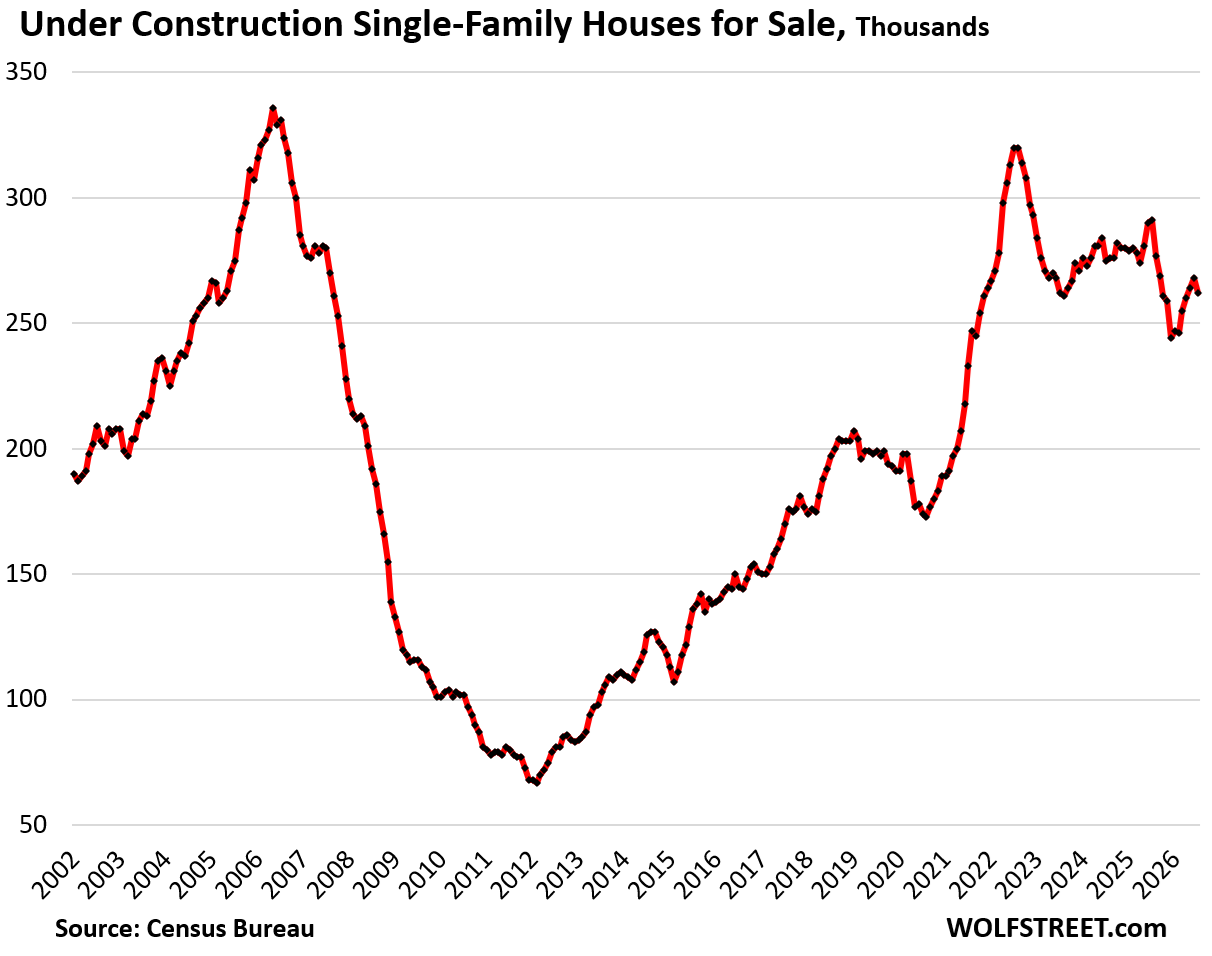
Inventory of under-construction homes dipped to 262,000 homes, down 10% from a year ago. The dip occurred in part because homes were completed, and moved into the next category, completed homes for sale, which rose.
Compared to July 2019, inventory was up by 32%.
Under-construction inventory for sale is what is in the construction pipeline, and is for sale, but hasn’t been sold yet. Homebuilders have quite a bit of capital tied up in this inventory and are motivated to sell it.
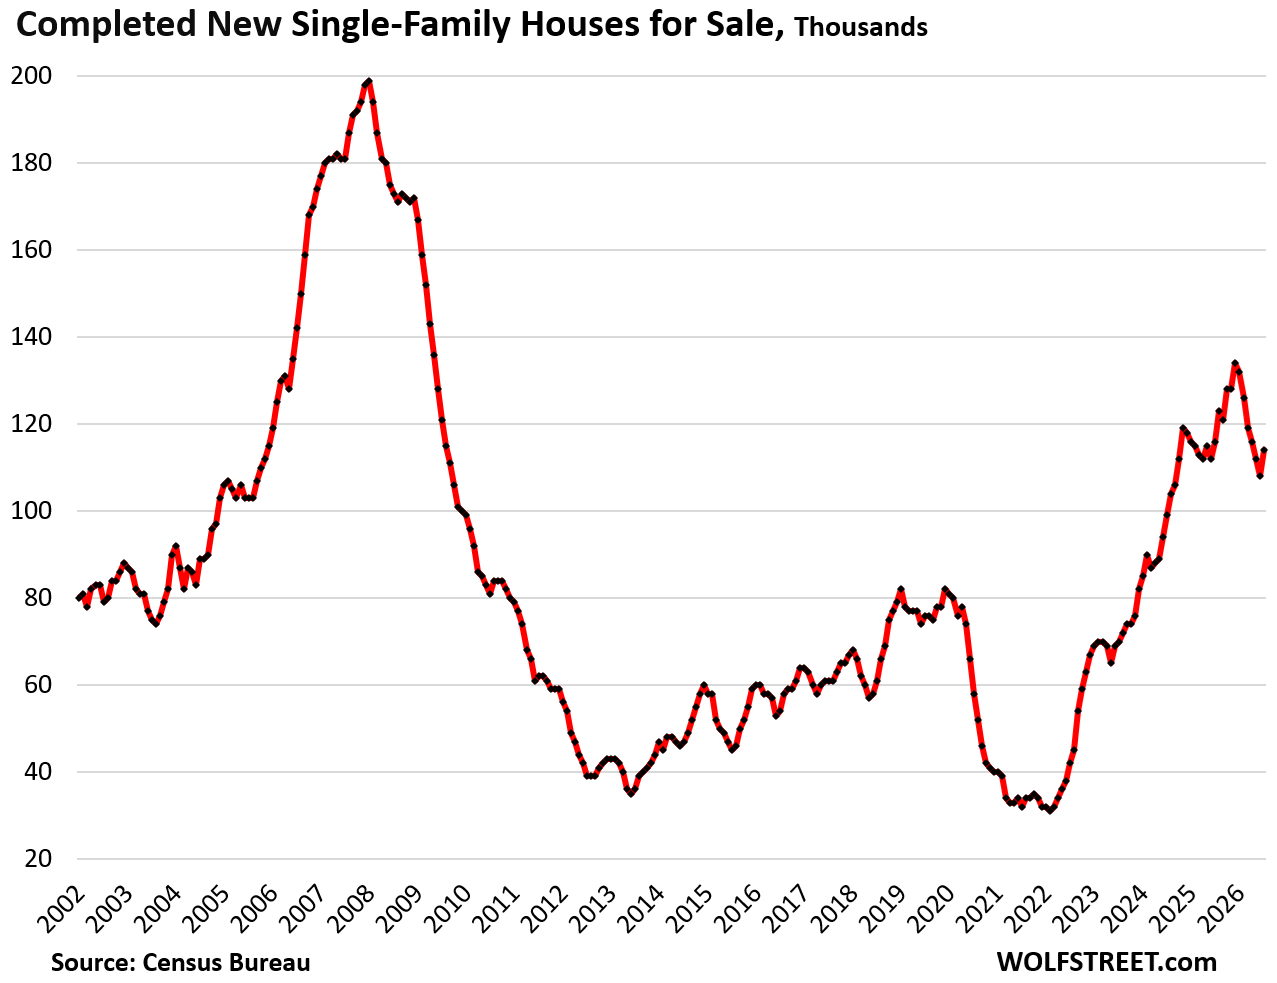
Inventory of completed homes for sale rose to 114,000 after getting sold down from the very high levels in December.
Compared to July 2019, inventory was up by 50%. Compared to July 2022, inventory has soared by 170%.
Builders have a lot of capital tied up in these largely move-in ready “spec homes” and are very motivated to sell them.

Inventory & sales by region.
A map of the four Census regions is below the article at the top of the comments.
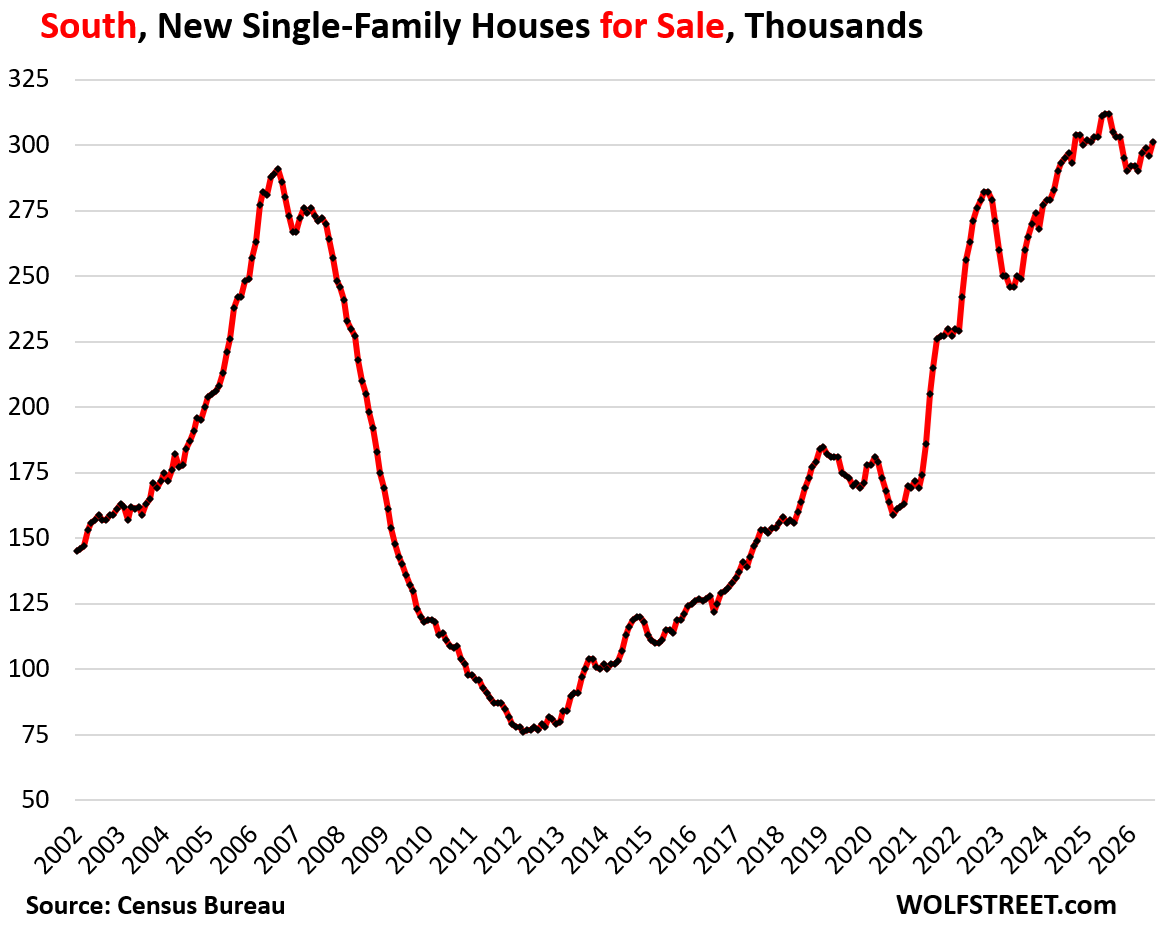
In the South, inventory for sale rose to 301,000 new single-family homes at all stages of construction.
Compared to the all-time record in July last year, inventory was down by 4%. Compared to July 2019, it was up by 73%. This is a gigantic amount of inventory that homebuilders have to sell.
But sales fell by 6% year-over-year and were down by 9% from 2019. Homebuilders are sitting on nearly 10 months’ supply.
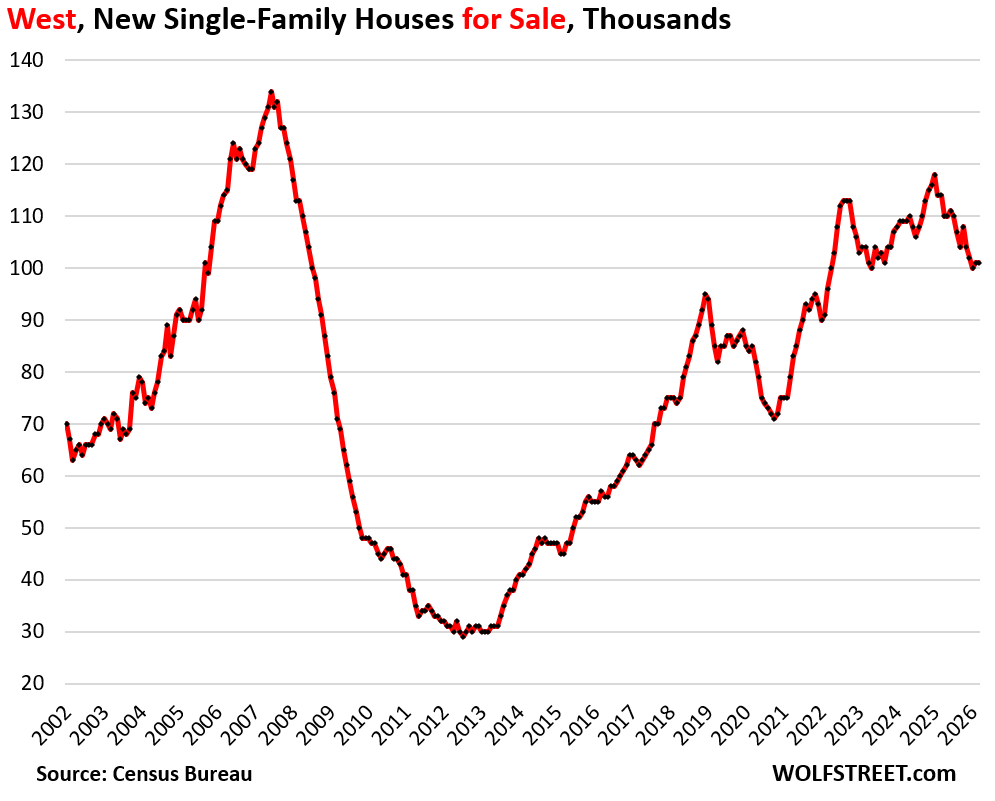
In the West, inventory for sale rose to 103,000 new single-family homes.
Compared to July last year, inventory was down by 6%. Compared to July 2019, it was up by 18%.
Sales were unchanged year-over-year and down by 15% from 2019. Supply rose to 9.4 months at the current rate of sales.
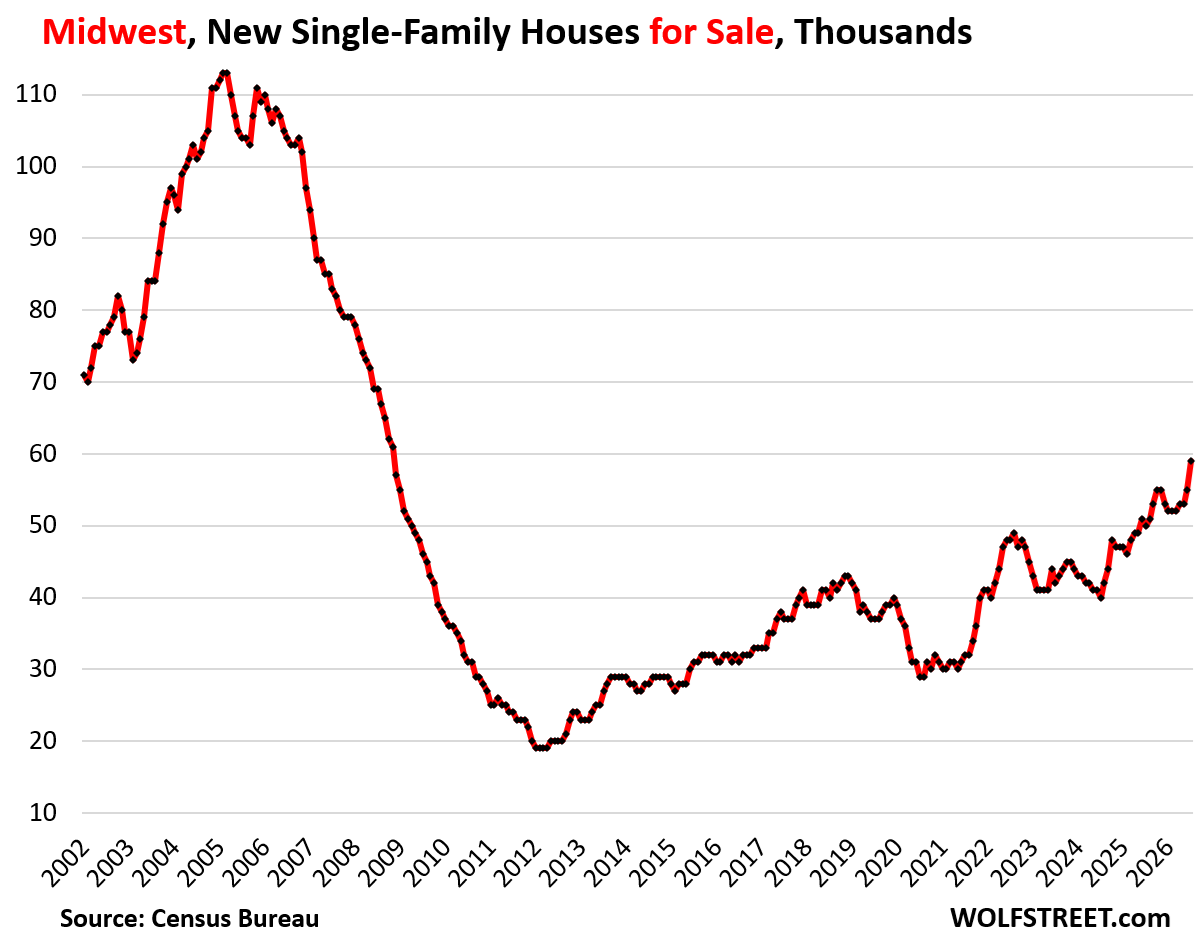
In the Midwest, inventory for sale jumped by 18% year-over-year, by 60% from July 2019, to 59,000 new homes, the highest since 2008. Bring on the supply!
Sales dropped to 4,000, rounded to the nearest 1,000 by the Census Bureau, providing for large rounding errors. On this basis, sales plunged by 50% and supply soared to nearly 15 months.
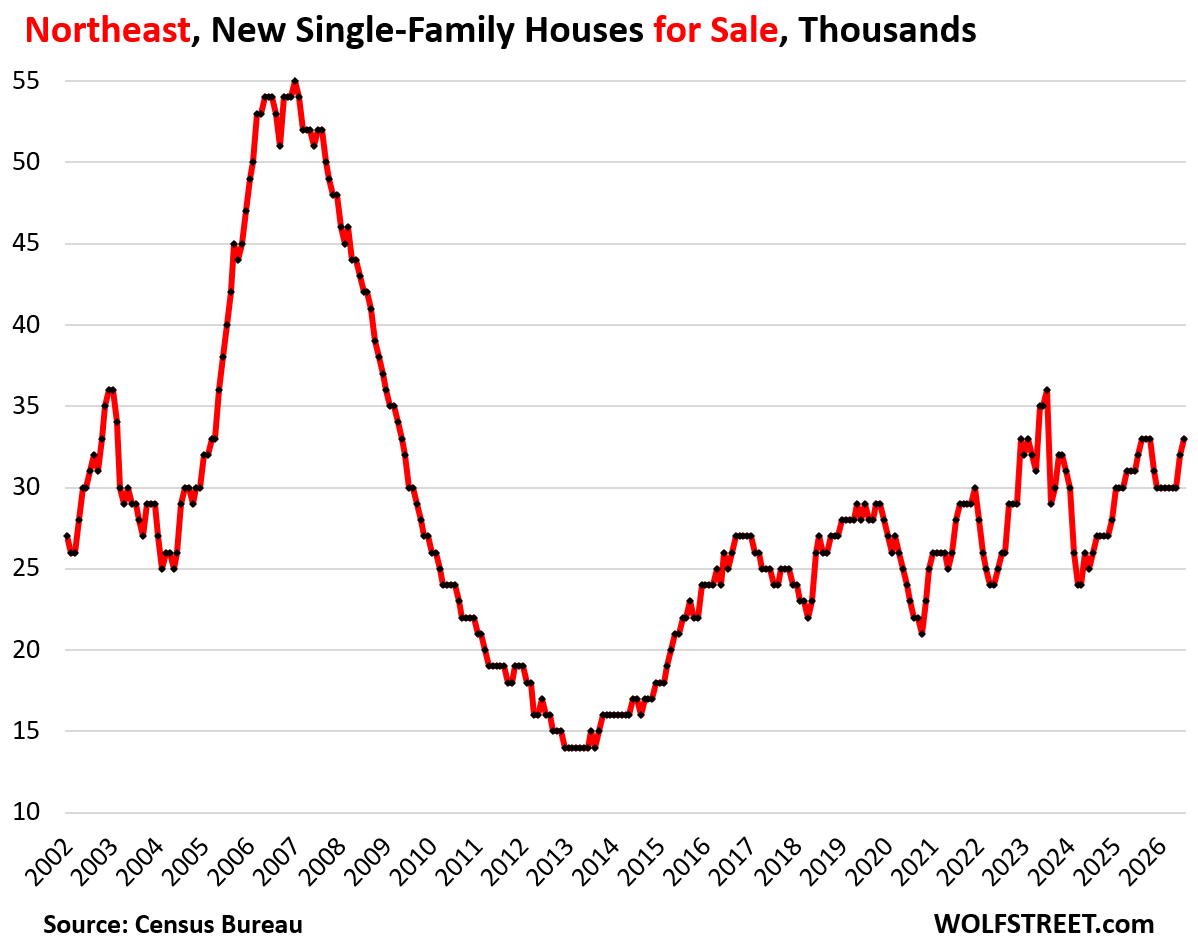
In the Northeast, inventory for sale rose 3% year-over-year and by 14% from 2019, to 33,000 new single-family homes.
The Northeast is a small area with big densely populated cities where multifamily construction (condos and apartments) plays a big role, rather than single-family construction.
In case you missed it: Oh Dear, Condo Prices Fell by 15% to 33% in 33 Bigger Markets, Some Below 2006 Levels, as Historic Condo Bubbles Deflate
Enjoy reading WOLF STREET and want to support it? You can donate. I appreciate it immensely. Click on the mug to find out how:


The map of the four Census regions of the US. Click on the chart to enlarge it:
And Trump’s idiot appointee Pulte keeps sending official notices from his US Federal Housing agency that home prices are rising:
The misinformation game is strong. The Denver post had an article saying that Denver had made up all its price decreased and prices were once again hot and the market competitive. It said only condos were struggling.
Very much not true
Still looks like a long slow grind down.
Many once hot markets have fallen more than 20% from their peaks.
Why is the very sharp and very short peak in housing prices a relevant reference point? We don’t say that the $4 gas is down 33% from it’s peak or the two dollar eggs are down 50% from their peak. Far less than 1% of housing inventory ever transacted during the peak, so it’s a bit irrelevant. For a long-held asset I think the much more relevant measure would be a moving average.
Drive-by nonsense.
1. stock market declines are measured from peak, you goofball
2. Jon refers to the existing home prices for some cities being down 20% from peak. This article is about new homes.
3. The data in my articles about existing home prices (that Jon referred to) are three-month moving averages, as explained in the articles. And they give you % changes: month-to-month, yoy, from peak, since 2000, and often “lowest since.” All you have to do is read them instead of posting BS.
Builders are doing a good job pushing down prices as that is their model to sell year round. Already starting to see it near me.
New starter homes between 525k – 650k for around 1700 – 2100sqft. It’s pushing down prices for the neighborhood near me that offers similar older homes on the same size scale.
These new builds already offer to buy down the rates and 25K incentives for possible buyers before getting to the table.
Still overpriced just like my home nearby but heading in the right direction slowly but surely as buyers will flock to these new homes at lower prices and reprice areas near by to more affordable for the new folks wanting a home.
It’s good to see it moving as needed.
I wonder what level house prices and rents need to drop to to have a significant effect on lowering CPI. Wealthy donors typically don’t have much of their wealth tied up in real estate, so they wont complain much. And the lower CPI will theoretically help the economy, but doing it this way wont affect the food, insurance, energy costs that the average household feels.
Home prices per se are not part of CPI. But rents play a prominent role. The CPI for rent and for OER have cooled a lot, but may have bottomed out early this year. They have risen since then. Rent is just under 3% yoy, and OER is just over 3%.
And if I recall correctly, the made-up happy numbers from last October-November’s government shutdown are about to roll off the 12 month headline CPI/PCE later this year right? Or did adjustments in early 2026 mostly negate that?
Is there a source that charts median actual price when figuring incentives? It’s all BS right now and this buried price concession just inflates house prices.. it’s almost like our circular financing propping up ai stocks but builder financing propping up house prices…..guess who gets to pay all those taxes tho!
“Is there a source that charts median actual price when figuring incentives?”
Only by homebuilder as per the homebuilder’s financial reports. I track this for Lennar. I pulled this data from Lennar’s financial statements. Lennar is the most aggressive. It’s gaining lots of market share and may now already be the #1 builder in the US, up from #2. As a result, its gross margin, earnings, etc. have plunged, including its shares (-51%). But it is out there building homes and taking no prisoners. I wish we had more of these types of builders, so that people can choose what they want to pay for a home.
But there are others that are not nearly as aggressive. There are homebuilders that are holding their prices and are tight on incentives, and they have lost market share.
https://wolfstreet.com/2026/06/11/what-homebuilder-lennar-said-about-the-tough-housing-market-average-sales-price-down-24-from-peak-back-to-2017/
Median price is then already lower than in 2020, after adjusting for inflation…
No one ever in the entire history of mankind has bought a home at an inflation-adjusted price. Would be nice tho 🤣
Wish oil would sell for 1980 prices. In 1980 a bbl of oil sold for 40 usd/bbl
Today around 85 usd/bbl
Adjusted for inflation that’s probably 10 usd or less !!
1980 oil prices were the second highest in history after adjusting for inflation ($160 in today’s dollars).
Maybe having inflation adjusted currency would be a way? Change the currency every year, adjusted for inflation. Then you could go buy a house with actual 2010 dollars, or whatever? said with a little sarcasm
I had to run the numbers from Wolf’s chart through an online inflation calculator to be sure, but dang, you are right.
All this grouching about overpriced houses ignores the fact that average weekly earnings are up 32.3% since 1/1/2020, according to the FRED series “Average Weekly Earnings of All Employees, Total Private”.
Houses are as affordable (for people earning their income) as they were in the late 20-teens, and the unemployment rate is exactly where it was in December 2017. Actually checking the numbers transformed my attitude about “the housing crisis / bubble”.
Prices were already high in 2020 and affordability depends on the interest rates.
Exactly. Repeat after me: pretty much no one who lives in a house cares what the price is. They care what the monthly payment is.
Inflation adjusted prices are indeed a bit lower than 10 years ago, but payments are nearly double because interest rates are more than double.
Mortgage rates are back to normal. Home prices are abnormal. Abnormal home prices jack up other costs, such as homeowner’s insurance, property taxes, and maintenance, repair, and remodeling costs.
There is an actual housing affordability index that compares an average monthly payment to an average income. By that metric, housing is still 75% more expensive than in the late teens (not quite double)
and affordability depends on PRICE — everyone is so hung up on interest rates — as long as the house payment is significantly larger than renting — and includes a 20% down payment — houses are unaffordable.
I wonder if part of the drop in new price sfh is also down to most of them (at least in my part of central NC) are in HOA communities.
I see a lot of new homes popping up on zillow in my area at attractive prices but like 95% of them are in communities and I and most people I know are avoiding HOA’s like the plague.
I guess there is a price where the break-even makes it worth it though, and I am not complaining if those HOA sfh prices end up bringing down the price of neighboring non-HOA homes.
I don’t have any hard data to back this up, but my feeling is that in Raleigh area it’s probably a 1:20 ratio of non-HOA to HOA houses on the market, maybe even less. If a non-HOA house hits the market, that’s literally the first line in the listing description in ALL CAPS.
That said, it’s extremely hard to find a decent non-HOA property in this area
Howdy Youngins. This latest Lone Wolf Report is how things use to be… Builders doing what they do and making their own moves to build their companies. Its nice to see car manufacturers offering no interest purchases again. Doing what they have to do to prosper… Looking forward to the next report about our Govern ment created ZIRPy prisoners and how many found FREEdom or not……
The Coachella Valley contains roughly 78,000 to 80,000 total residential housing units spread across its nine core cities, with single-family detached houses making up the clear majority over attached condos and townhomes. Meanwhile, the Coachella Valley has over 16,000 active short-term rental (STR) listings across its major desert cities, according to mid-2026 data from AirDNA. This means STRs make up roughly 20% of total condo/SFR properties.
Should a recession start any time soon, how many STR owners will be able to hold on? Will it be like the last time (post 2008) when nice middle-class properties were offered and sold at half-off from peak prices?
Palms springs area is freakin awesome.
Yes indeed but only in high season😊….blazing hot now 😩
Is it? Last time I was there I saw more lifted pick up trucks than I’ve ever seen before. And I’ve lived in some pretty low-brow places. I always thought it was rather trashy but I know the Kardashians love it. To each his own
Well, the margins on those STRs are pretty fat. That’s what attracted all these people to them in the first place. Breakeven is probably around half the rental volume they are enjoying now.
“ Prices Drop to Lowest since 2021.” You know as well as anybody that no meaningful price action has taken place. The prices are still in the stratosphere. It’s still a manipulated sham. Don’t sugarcoat reality.
It’s always kind of funny when people expect home price to crash 80% overnight, and anything less is nothing.
If prices decline 20% over six years, and incomes rise by 20% over those six years, you’re getting closer. We’re four years into it.
Really hard to see how this materially improves. The government allows inflation to run hot or allows dollar debasement to occur. My guess is they label inflation temporary due to current shocks and may or may not increase rate 25 basis points, or they continue to play around with long term rates but on a larger scale. Bessent clearly is just pouring gasoline on a fire with Canada and Iran. Seems like he has taken over for Hegseth which is a funny thing for a Treasury secretary to do but his disdain for China isn’t exactly a well held secret.
A used 3 bedroom house for sale here is asking $1.4 million. It was a 2022 COVID purchase of $1.1 million which was $30k OVER asking. It previously sold for $400k in 2015. The damage done to the housing market by the reckless FED can never be reversed. Ever. They destroyed the shelter market permanently.
@DepthCharge – Sure, the FED is to blame. But mant buyers are also morons. They are often bamboozled by used home salesmen (realtors).
In my region, I have seen some Tech fools buy a home for like 1.3 mil near 2020 and are now struggling to sell it at 1.1 mil. Great at algorithms, but dumb with real estate (at least for the 1st purchase). These are the kind of people who set a high base price for homes.
I wonder how one can find out the concessions in the sale of any home that was sold recently, say in the past 5 years.
I also think we should have a law which makes it mandatory to subtract the concession amounts from final sale price whereever they might be reported. This will enable price discovery instead of propped up home prices. Of course, this will never happen in America.