
Big structural shifts have destroyed jobs in some industries and created jobs in others.
By Wolf Richter for WOLF STREET.
AI is the latest of the disruptors, and the biggest since the internet and computerization of everything, that have triggered structural changes across the industries that span the US economy.
Automation has been a disruptor for many decades and is now everywhere, and it continues to advance to new levels.
Globalization was another big disruptor. It created a “giant sucking sound” of manufacturing plants – Ross Perot’s unforgettable phrase about what NAFTA would do and ended up doing – and those plants are now elsewhere, and the US imports their stuff, and has become dependent on their stuff.
Disruptors like these create shifts in employment, with job destruction in some industries, and job creation in other industries.
Then there are disruptors, such as the Housing Bust, that slam specific industries, such as construction, real-estate brokering, and mortgage lending, leading to job destruction in those industries, without any job creation elsewhere, followed by recoveries.
We can see some of those shifts in the nonfarm payrolls data, released today by the Bureau of Labor Statistics (our discussion of the overall employment data is here).
The jobs in each industry are defined by work location. The primary activity at that facility determines the industry category (by NAICS code). For example, a job at an Amazon fulfillment center falls under “Transportation and warehousing,” not “Retail” and not “Information.”
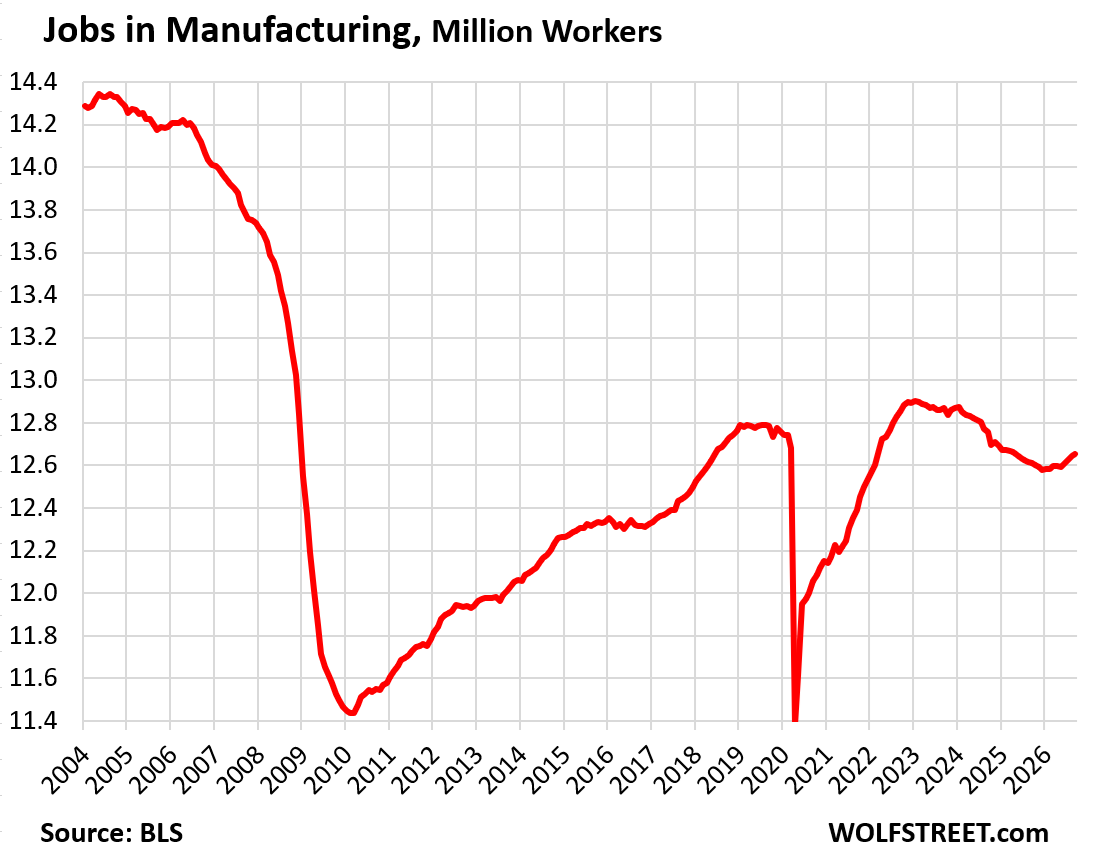
Manufacturing in the US is synonymous with a drive for ever greater automation to reduce the costs and issues associated with human labor, and manufacturers invest massively to replace human labor. As a result, the manufacturing jobs that are left today require higher skills, often degrees, and include tech jobs.
Automation and globalization were driven to the next level during the Great Recession, and employment in manufacturing plunged. A large factor were the auto industry’s component makers that filed for bankruptcy in the US and opened shop in China and Mexico; and the automakers themselves that shifted more production to Mexico.
Recently, production has been in expansion mode, driven by automation, not employment of humans. But this year, even employment has been increasing.
- Total employment: 12.65 million
- Month-to-month: +9,000
- 3-month growth: +44,000
- 12-month growth: +40,000
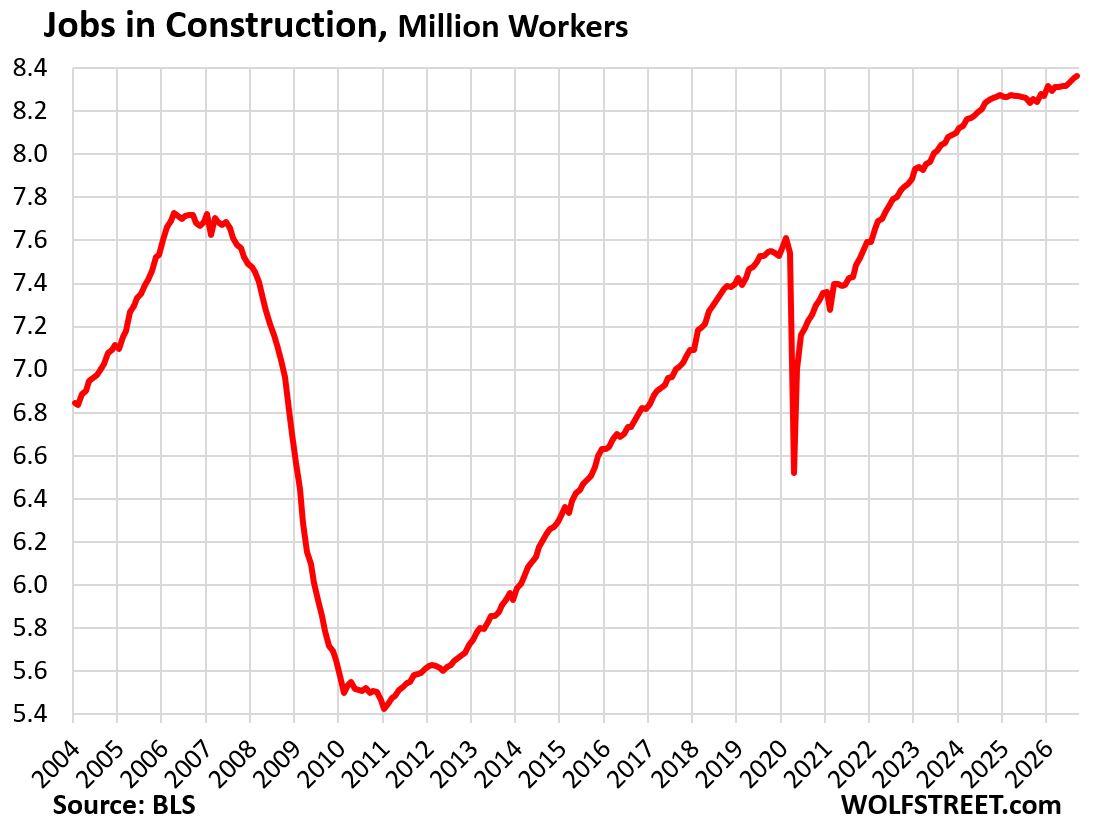
Employment in construction, from single-family housing and highways to powerplants and AI data centers, is subject to different dynamics. The office sector has been in a depression since 2020. Housing construction, single-family and multifamily, got hit by a decline in demand and a pileup of supply. But construction in other sectors has been solid. And construction of data centers, factories, and power plants has been booming amid reports of shortages of skilled labor, such as electrictians.
- Total employment: 8.36 million
- Month-to-month: +11,000
- 3-month growth: +45,000
- 12-month growth: +109,000
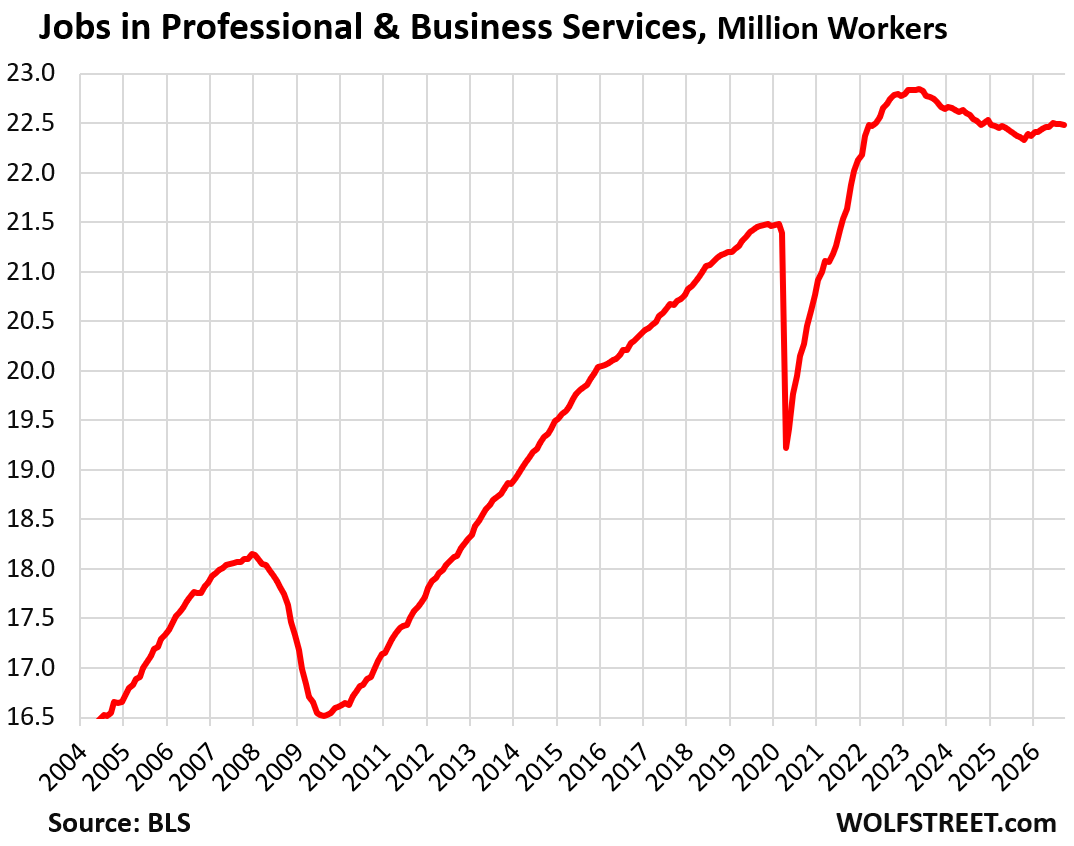
Professional and business services is a huge category that includes jobs in tech, AI, and social media, and it includes government contractors that lost their contracts with the federal government in 2025.
It consists of facilities that work primarily in Professional, Scientific, and Technical Services; Management of Companies and Enterprises; Administrative and Support, and Waste Management and Remediation Services.
The increasing use of AI may have been responsible for some job losses, but there has also been some AI-related hiring.
The explosion of employment in 2021 and 2022 is now widely acknowledged as over-hiring that companies then cleaned up. The low point was in October 2025.
- Total employment: 22.48 million
- Month-to-month: -9,000
- 3-month growth: -20,000
- 12-month growth: +123,000

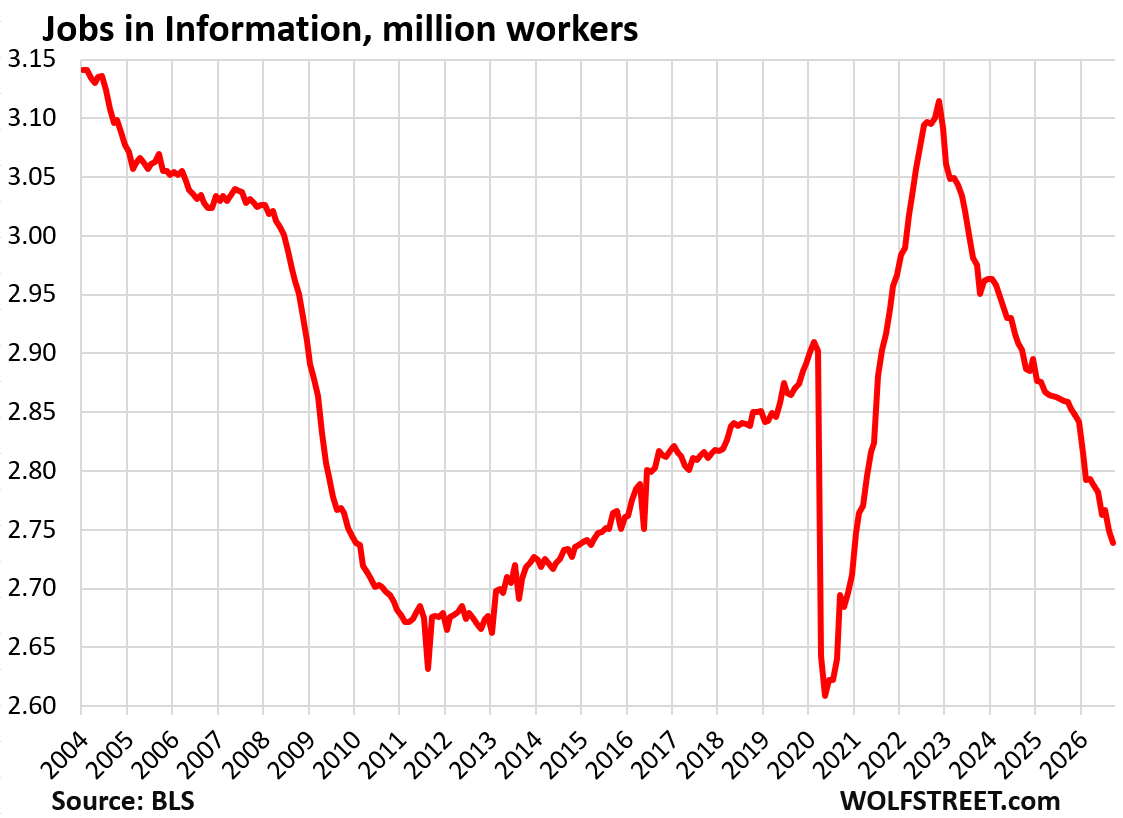
“Information” is a small category with a bitter AI taste. It includes facilities that primarily work on web search portals, data processing, data transmission, information services, software publishing, motion picture and sound recording, broadcasting including over the Internet, and telecommunications.
AI has slammed these activities for several years, including in the video and motion-picture industry, and in software publishing, where AI has taken over a lot of skilled human labor.
Over-hiring during the pandemic and the cleanup afterwards has also slammed this industry.
Employment in this industry has fallen to the lowest level since 2015. That industry previously got crushed during the Dotcom Bust that started in 2000.
But note, this doesn’t mean that all these people are unemployed. Many shifted to work locations with a different NAICS code and are now in Scientific and professional services or other industries, doing similar work as before.
- Total employment: 2.74 million
- Month-to-month: -10,000
- 3-month growth: -24,000
- 12-month growth: -120,000
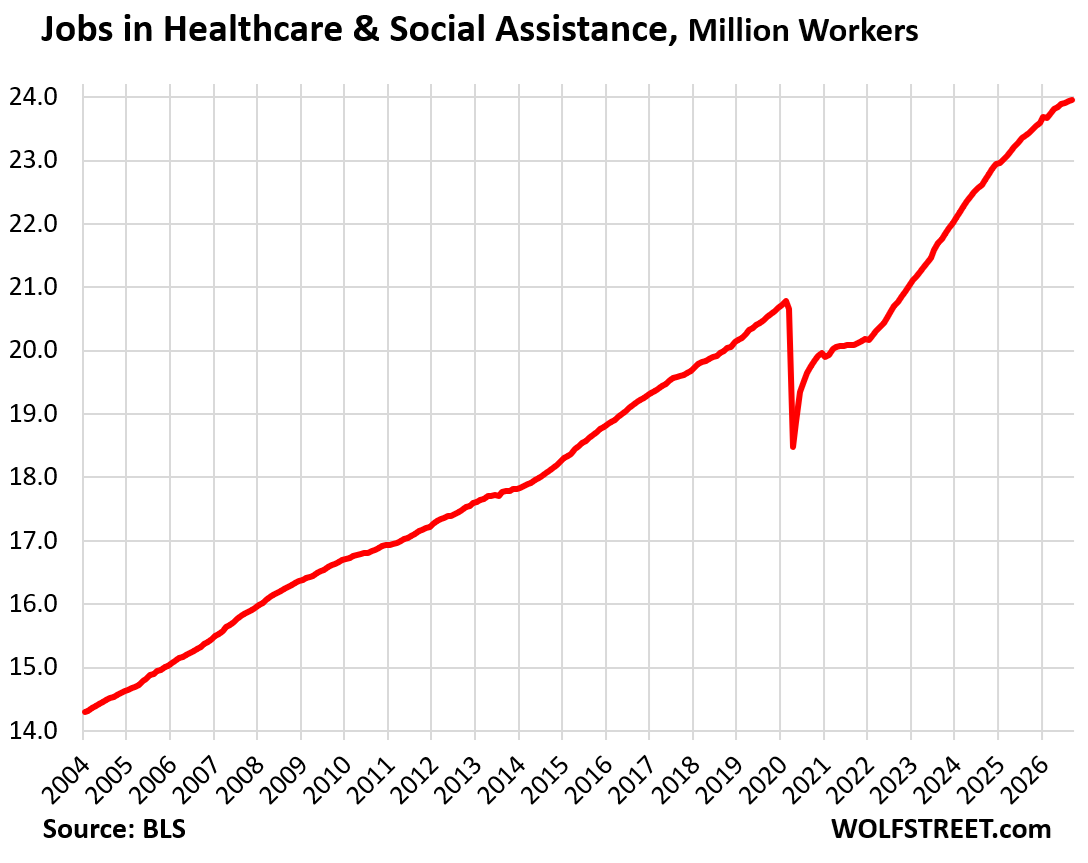
Healthcare and social assistance:
- Total employment: 23.96 million
- Month-to-month: +23,000
- 3-month growth: +71,000
- 12-month growth: 520,000
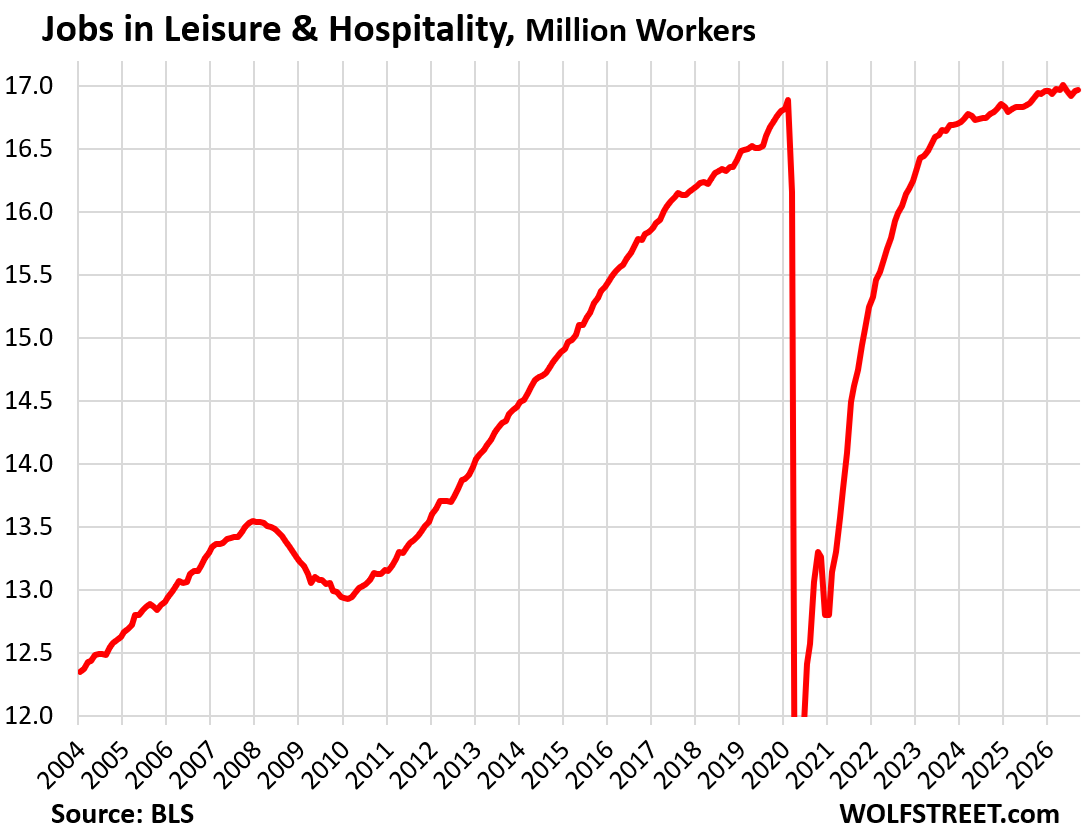
Leisure and hospitality (restaurants, bars, lodging, resorts, casinos, etc.) experienced some World Cup ripples over the summer.
- Total employment: 16.96 million
- Month-to-month: +10,000
- 3-month growth: +9,000
- 12-month growth: 62,000
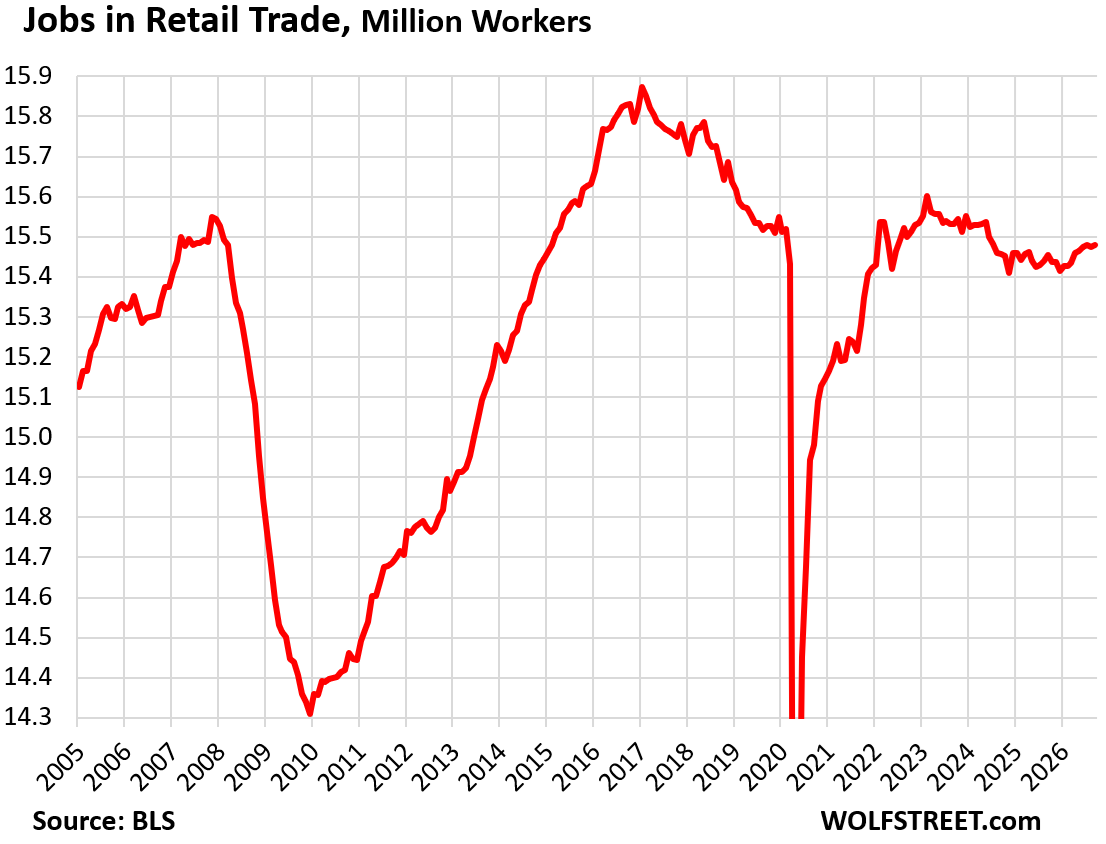
Retail trade includes workers at brick-and-mortar retail stores, such as malls, auto dealers, grocery stores, gas stations, etc., and other retail locations such as markets.
It does not include ecommerce tech jobs, drivers, and warehouse employees.
The brick-and-mortar portion of this industry first got slammed by the Great Recession, and then by ecommerce. Since 2016, dozens of major retail chains have been liquidated in bankruptcy court, some of which we’ve documented in our Brick-and-Mortar Meltdown series. Innumerable malls have turned into zombie malls, and many are getting bulldozed and redeveloped into housing and mixed use, which is exciting to see.
The brick-and-mortar retailers that are still doing well are those that are selling gasoline, cannabis products, groceries, and motor vehicles.
But this year, brick-and-mortar retailers gained jobs.
- Total employment: 15.48 million
- Month-to-month: +6,000
- 3-month growth: +6,000
- 12-month growth: 27,000.
Financial activities include finance and insurance, mortgage lending and brokering, and real estate renting, leasing, buying, selling, and management. It’s the real-estate related jobs that have gotten crushed and pulled down the whole category – more in a moment.
- Total employment: 9.08 million
- Month-to-month: -7,000
- 3-month growth: -26,000
- 12-month growth: -107,000.
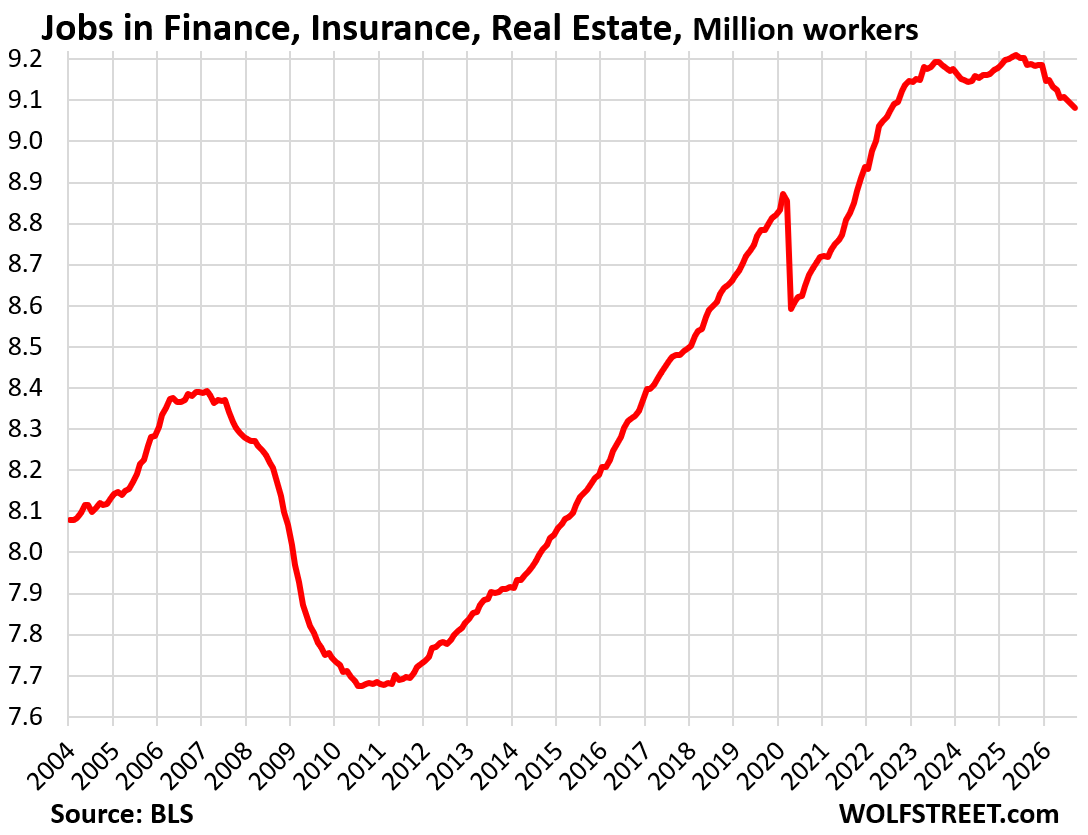
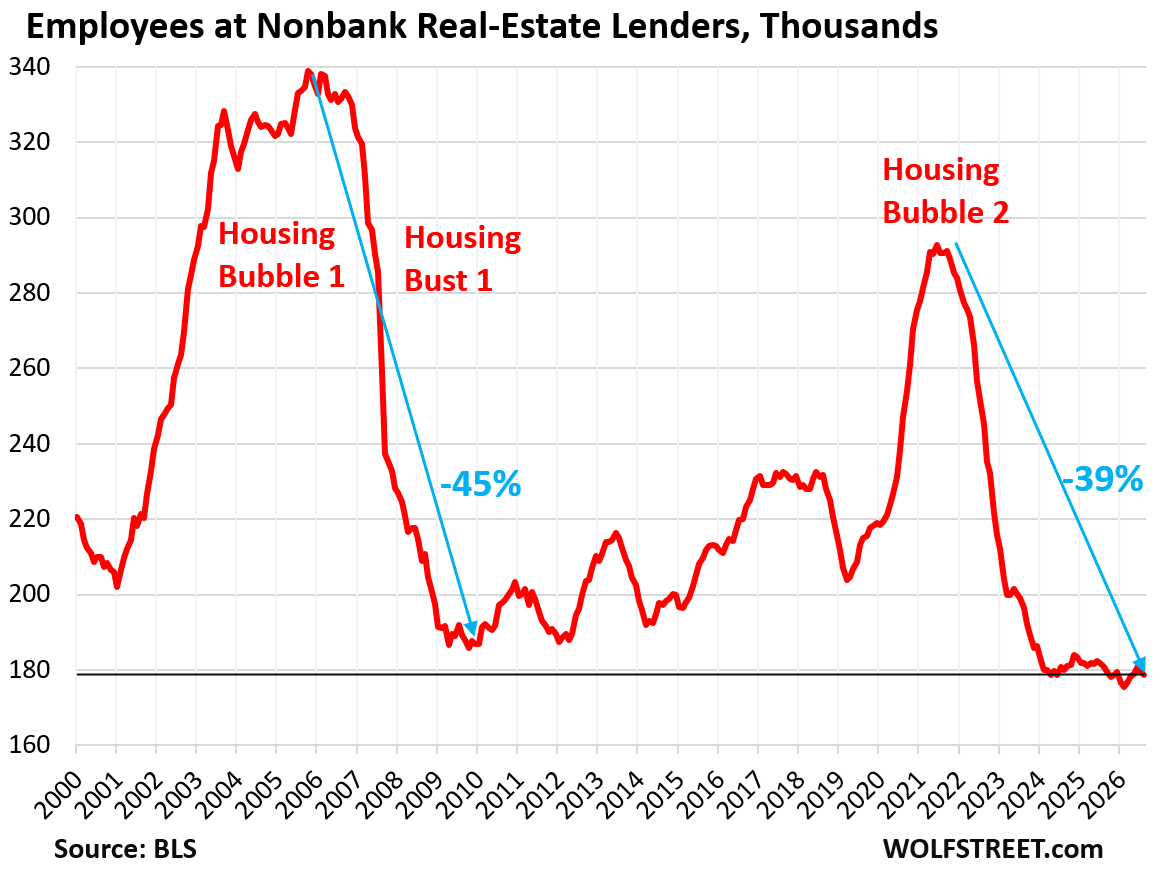
The real estate portion of financial activities: Employment in residential real estate brokering, mortgage lending, and mortgage brokering has gotten crushed over the past four years as sales of existing homes have plunged by about 25%, purchase mortgage lending has plunged by about 35%, and mortgage refinancing has collapsed. In addition, some portions of commercial real estate have been in a depression.
For example, jobs at nonbank real estate lenders – the largest residential mortgage lenders in the US are in this group – have collapsed by 39% since the peak of Housing Bubble 2 in June 2021.
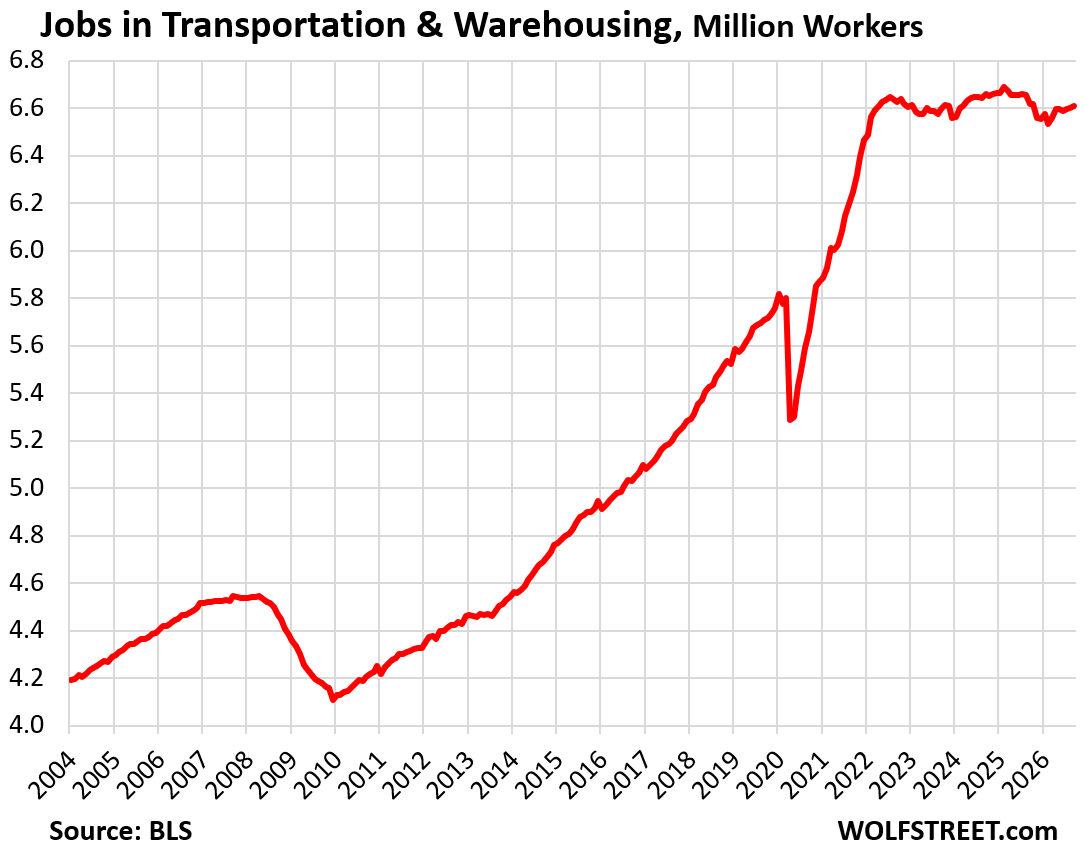
Transportation and Warehousing has essentially flatlined at high levels since 2022.
- Total employment: 6.61 million
- Month-to-month: +8,000
- 3-month growth: +21,000
- 12-month growth: -10,000.
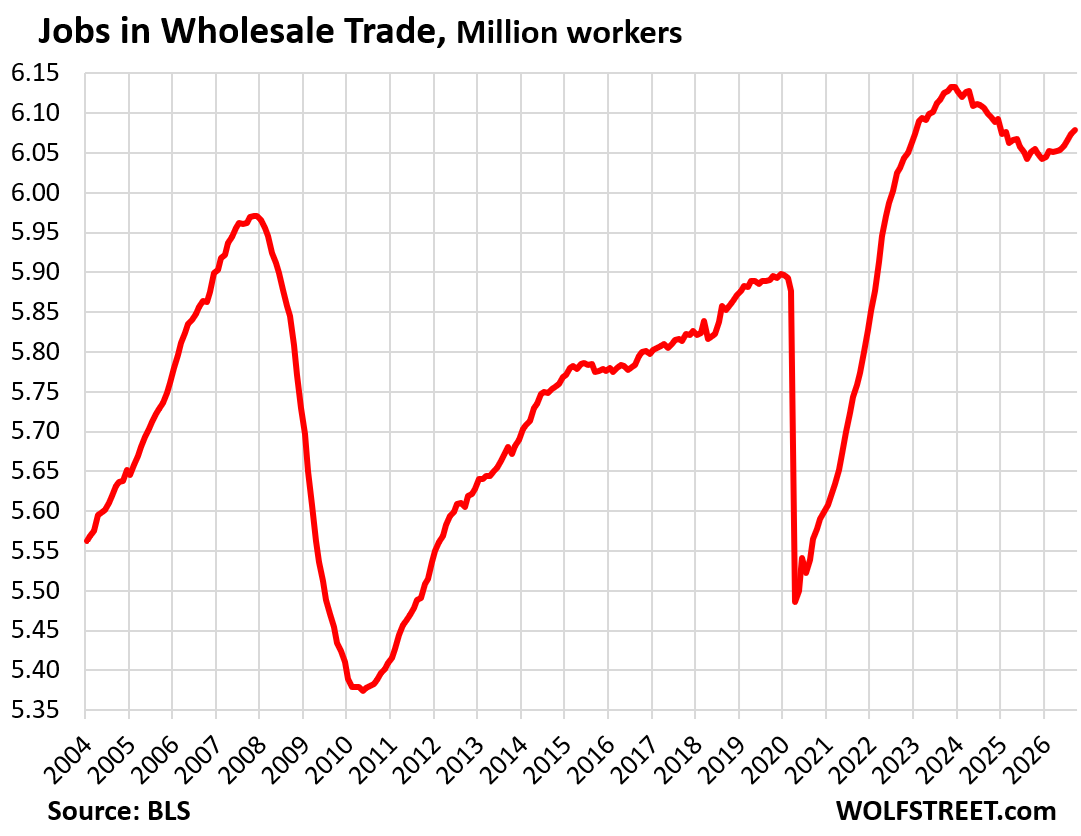
Wholesale Trade:
- Total employment: 6.08 million
- Month-to-month: +5,000
- 3-month growth: +19,000
- 12-month growth: +27,000.
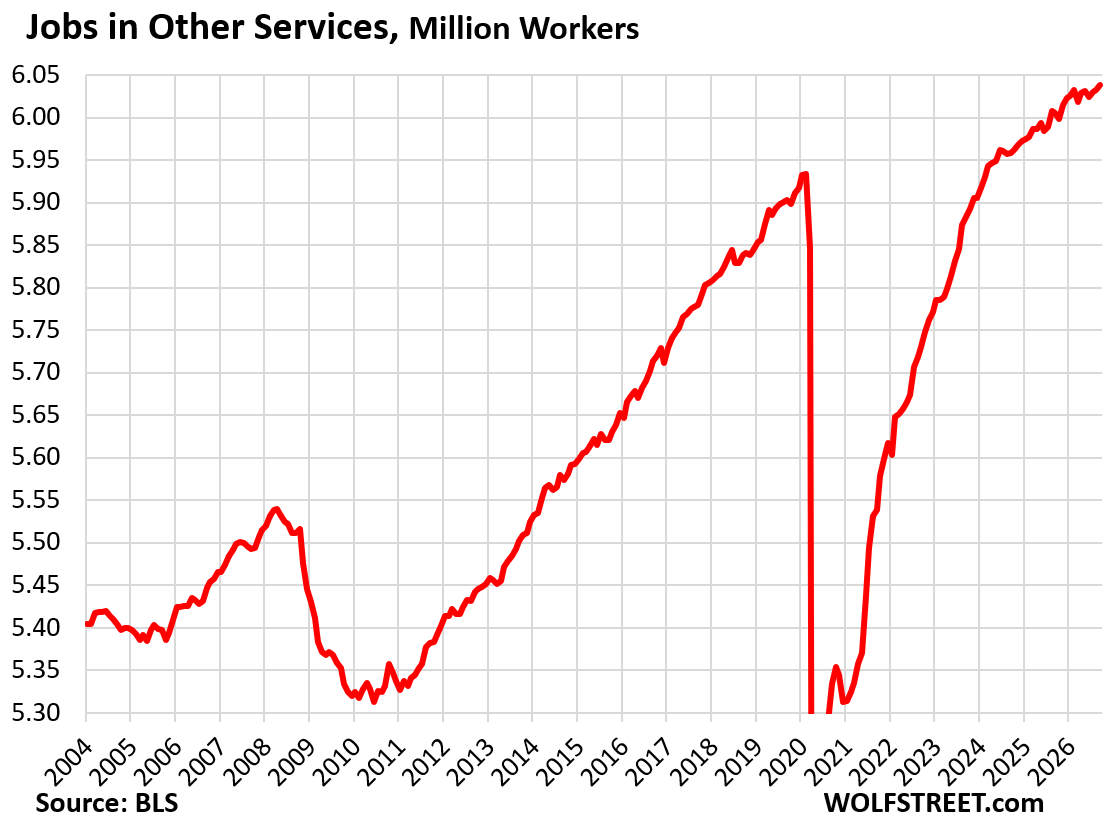
“Other services” include equipment and machinery repairing; promoting or administering religious activities; grantmaking; advocacy; dry-cleaning and laundry services; personal care services; death care services; pet care services; temporary parking services; and dating services.
- Total employment: 6.04 million
- Month-to-month: +6,000
- 3-month growth: +15,000
- 12-month growth: +34,000.
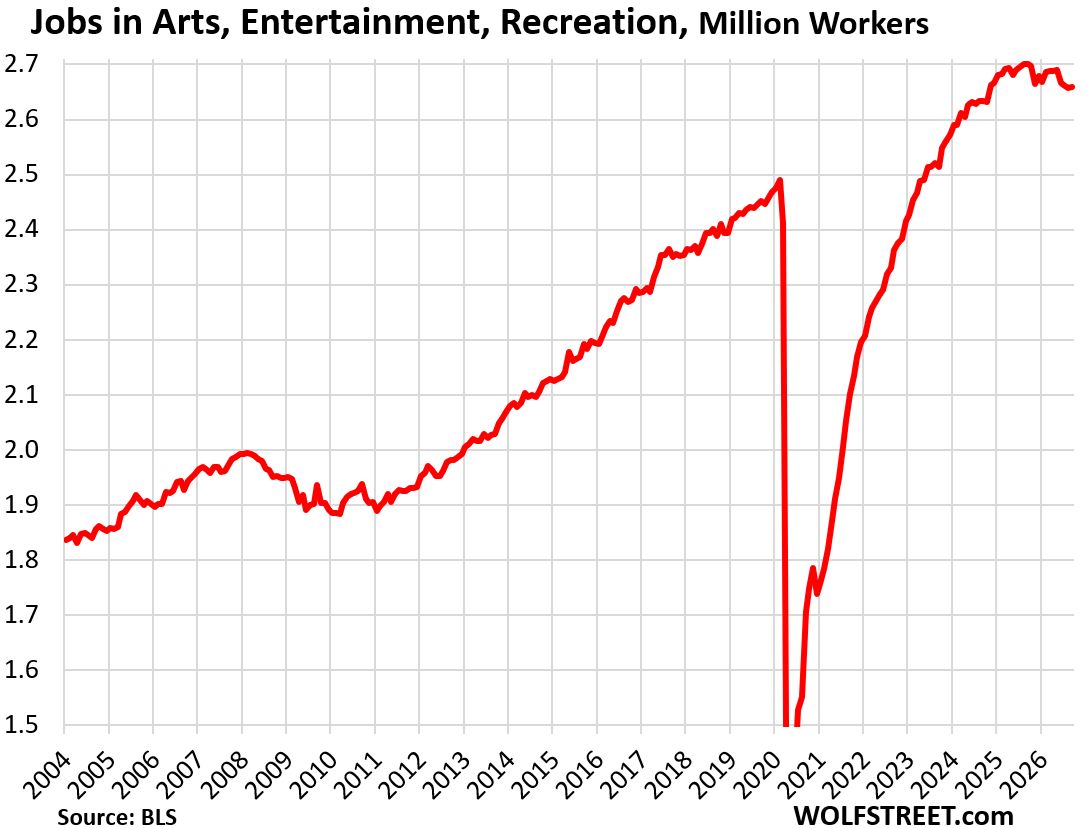
Arts, Entertainment, and Recreation:
- Total employment: 2.66 million
- Month-to-month: +3,000
- 3-month growth: -7,000
- 12-month growth: -43,000.
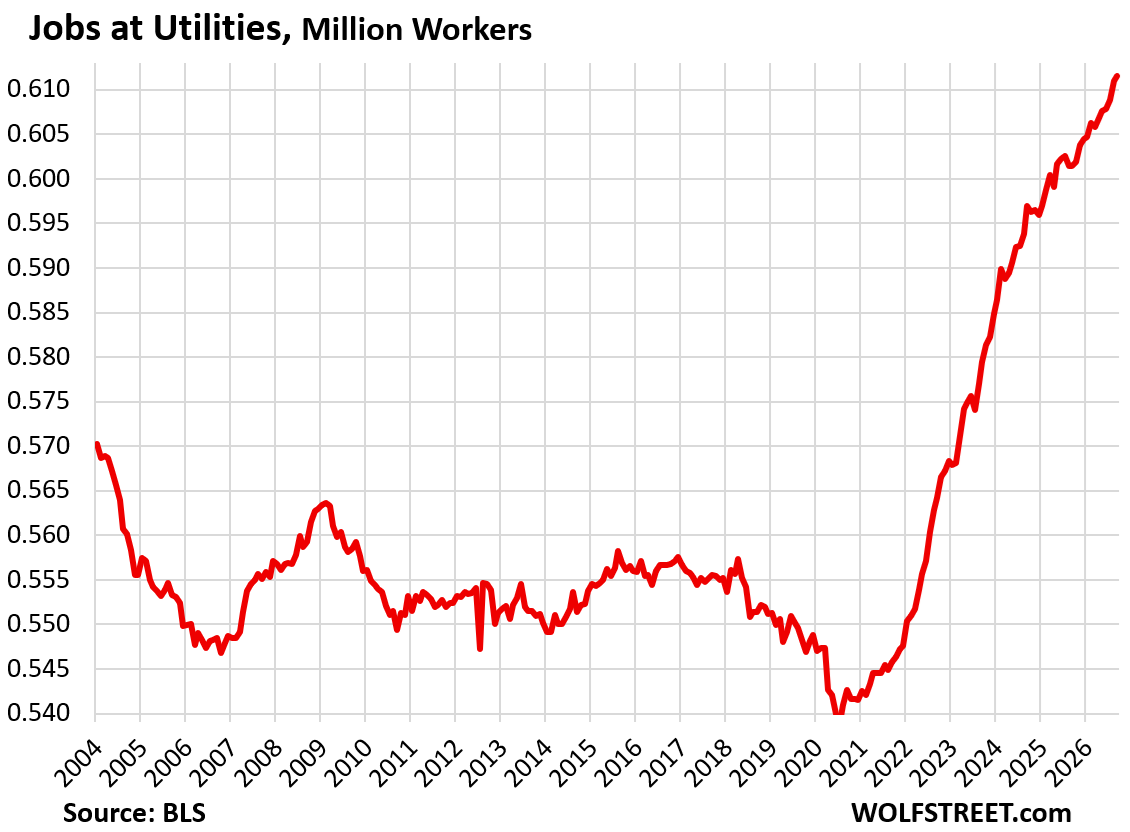
Utilities have a big economic impact with a relatively small workforce. And they’ve been on a hiring boom since 2021 when the AI infrastructure buildout and the factory construction boom demanded large amounts of electrical power at new locations.
- Total employment: 612,000
- Month-to-month: +500
- 3-month growth: +4,000
- 12-month growth: +10,000.
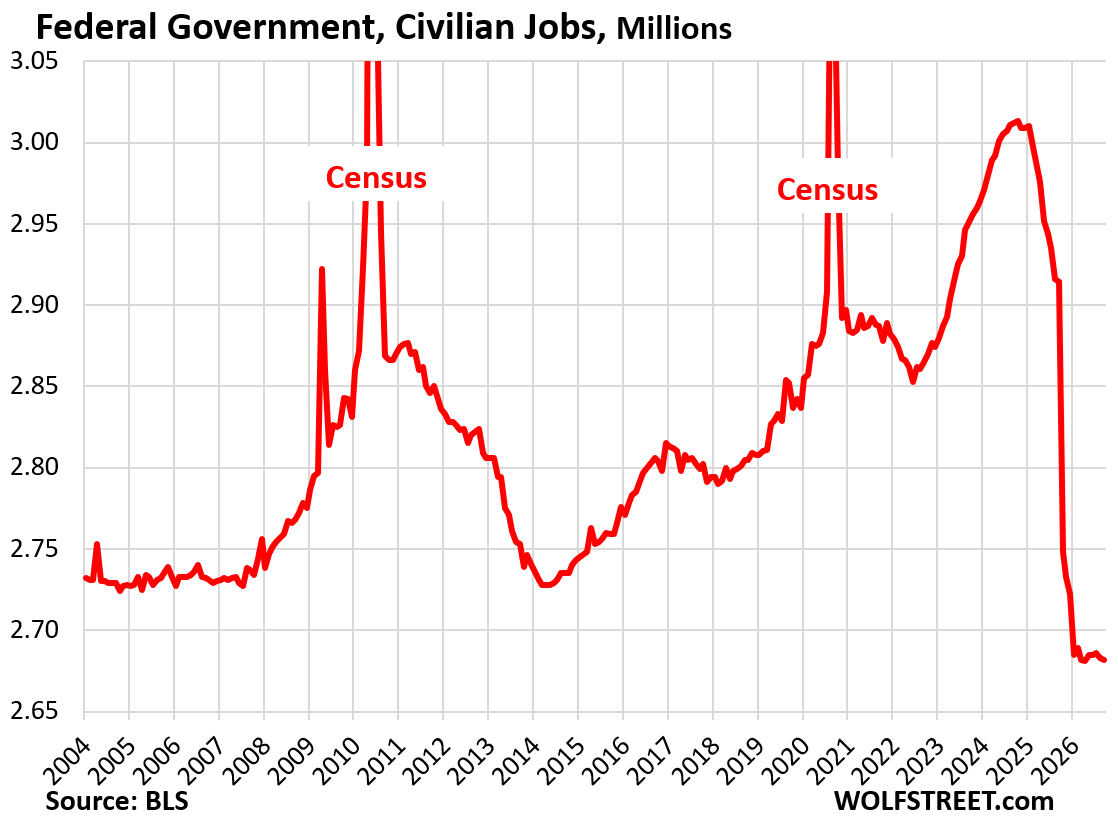
Government jobs.
The federal government has shed 328,000 civilian jobs, or 11% of its payrolls, since January 2025, not including the workers at government contractors that lost their contracts; they’re in private-sector categories, such as in “Professional and business services.”
Civilian employment at the federal government now accounts for just 1.69% of total nonfarm payrolls, the lowest in the data going back to 1939.
- Total employment: 2.68 million.
- Month-to-month: -1,000
- 3-month growth: -3,000
- 12-month growth: -232,000
- Since January 2025: -328,000 or -11%.
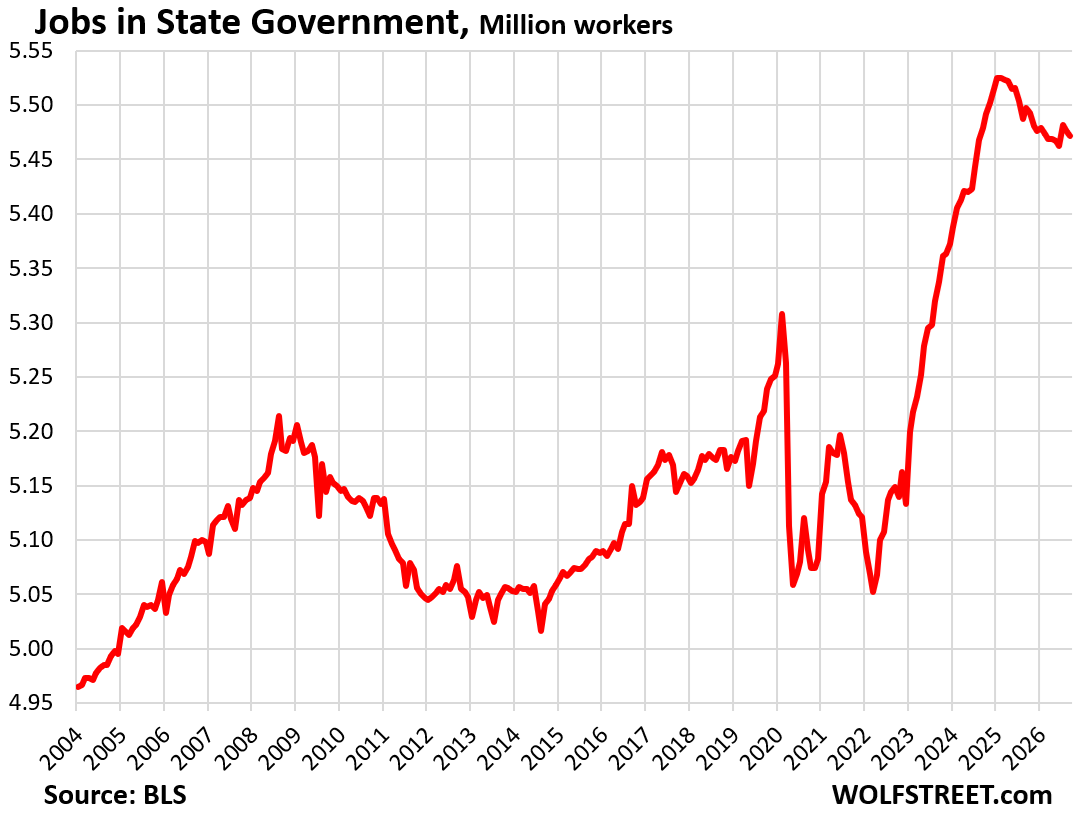
State governments have shed 53,000 employees since January 2025. Huge state university systems are the largest employers in state government, and they’re having enrollment problems.
- Total employment: 5.47 million.
- Month-to-month: -1,000
- 3-month growth: -3,000
- 12-month growth: -25,000
- Since January 2025: -53,000.
Employment at state governments accounted for 3.4% of total nonfarm payrolls, roughly the same as in 2019, and down from 3.7% 20 years ago.
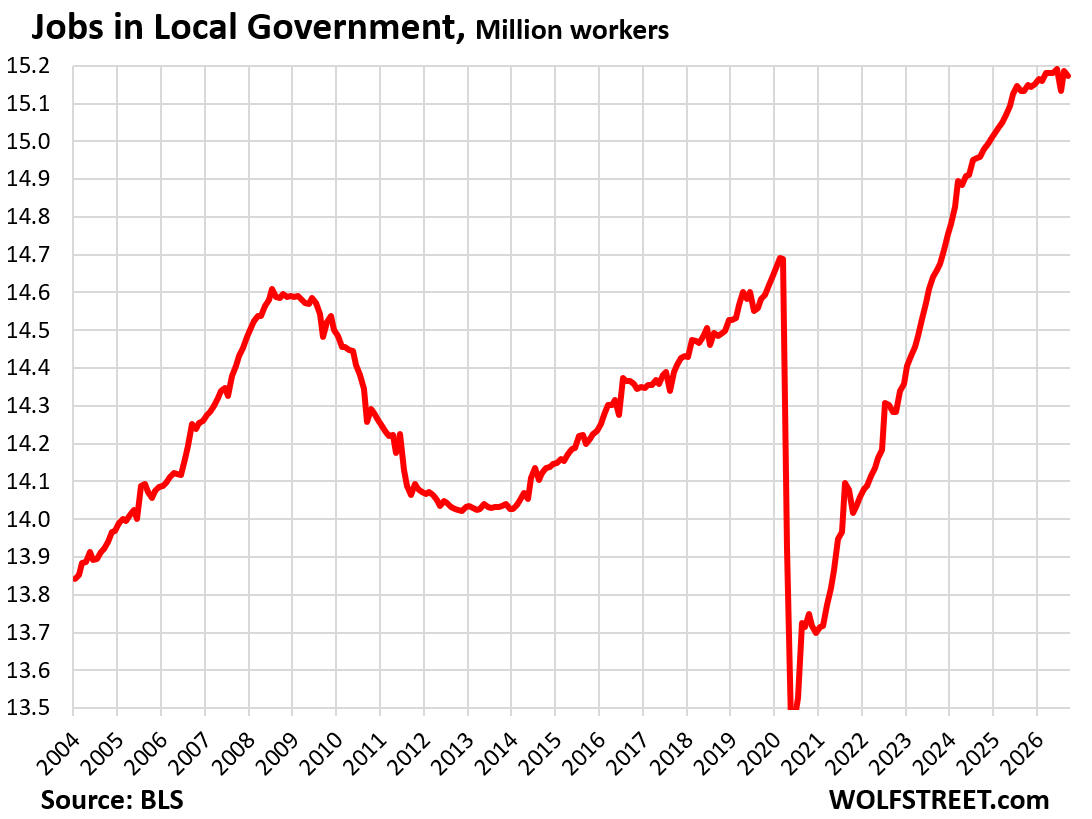
Local governments lost a lot of teachers during the pandemic when they shut down their schools and then had trouble hiring them back. Local government jobs are mostly in education from preschool across all grades to community colleges and trade schools; in healthcare; and in law enforcement and first-responders.
Local government jobs accounted for 9.5% of total nonfarm jobs, down from 10.5% two decades ago.
- Total employment: 15.17 million.
- Month-to-month: -13,000
- 3-month growth: -18,000
- 12-month growth: +41,000
In case you missed it: Private Sector Employers Created 46,000 Jobs, Governments Shed 17,000 Jobs
Enjoy reading WOLF STREET and want to support it? You can donate. I appreciate it immensely. Click on the mug to find out how:


Financial activities has had a lot more disruption than just having the real estate sector drag it down. Mergers and acquisitions, retirements, automation, and inflation. Insurance outstanding from the rest of the industry group has a ton of job openings. We’re actually in a pretty soft market at the moment.
And that is exactly why no in Congress or the White House will slow down the budget deficit spending.
Wow, this is great information!
It’s great to be able to see at a glance who’s doing well, who’s treading water, and whose employment charts look like the altitude graph of Abu Dhabi Flight 1073…
Agreed.
These long-term charts are very valuable.
The MSM and DC are almost entirely geared towards getting the other 260 million adults in the US to focus almost exclusively on the past 6 minutes/days/months (at most).
And the almost entirely mythical MSM/DC “promised land” of the next 6 months.
But taking the longer view over years/decades, reveals the truth about America and why MSM audiences evaporated the second they were given a choice and why Congress has had single digit approval ratings for decades.
I think this would really be highlighted if 1982 (or 1979 to avoid low base effects) to 2004 sectorial employment growth charts were overlaid on the charts above.
Spoiler – almost every sector had much stronger employment growth from 1979/82-2004 than from 2004 to 2026 (without massive QE money printing/interest rate strangulation-stimulus).
*Especially if measured in percentage growth terms*.
TL:DR – In historical terms, the last 20-25 years have been crud. Even with massive money printing/savings stealing in order to “stimulate” the macro-economy via gvt spending.
The futures so bright, I gotta wear shades.
With everything going so well on the job front, domestically, one must wonder how come deficits continue to accelerate like wild flowers.
Just after ww2, deficits here resembled today’s deficits percentage wise, and they were reeled in then by significant tax increases for years. I remember my dad telling me taxes soared to almost 90% in some cases then. People bellied up to the bar, and paid them off, and the national debt was brought in, completely.
What brought down the burden of the national debt was high inflation in 1946 – 1948 that reached into the double digits.
Was not aware of that. It spiked to 18% one year https://www.macrotrends.net/2497/historical-inflation-rate-by-year
John Mauldin gave you a favorable mention in his weekly newsletter today.
It is interesting how 27% inflation in 1946-47 is hardly known whereas 44% in 1978-81 is much better known.
Shows how wars are really funded. And history books selective.
And how gold-standard-exit, USD implicit devaluation really played out post Bretton Woods in the 70’s
Yes, that’s how the war debt got handled, along with lots of economic growth including through the baby boom. Everyone paid for it via inflation. And then it was mostly gone.
It also shows that people who were adults in 1946, and old enough at the time to have actually experienced it, would now be 100+, and there are not that many around, and they’re not getting quoted much by CNBC. People like me only read about it. But I was an adult during the big inflation bout in the 1970-1980s, and I remember what it was like.
Also interesting to note that if you average out (and ignore compounding) the annual inflation for the two periods, the ’46-47 inflation was 13.5% per year and 11% per year for the 1978-81 period.
Not terribly far apart per annum.
Might argue that roughly speaking (*historically*) things can get as bad as 12% inflation per annum in the US (for shortish periods) with people getting pretty pissed…but not quite literally bringing torches, pitchforks, and guillotines to DC.
(Concerningly, that might play into institutional memory/planning)
(And still kinda amazed that economic and history textbooks pretty heavily omit that ’46-47 inflation…)
But the world of 2020-2026, ain’t the world of 1946-7 or even 1979-82.
Great analysis as always Wolf. Have you ever performed a similar exercise using the Standard Occupational Classification (SOC)?
I think that might shine a different light on where employment is being disrupted.
1. Cannot be done correctly without doctoring the data because the job classifications are changed every five years.
2. I’m interested in employment by industry, not in employment by job titles, like how many CEOs there are and how many plumbers, that’s just irrelevant for what I’m trying to do.
I’ve been told from people in commercial construction management that their have never been this high of number of journeymen electrician in our country, when the AI data center boom turns to a bust not only will capital have been mis allocated but also labor, people choosing professions as electricians will get hammered. Everyone is on one side of the ship betting on AI for the future.
apprentice electrician is what was said!
They’ll just have to start wiring houses. :-) Always booms and busts in construction trades, but the skills are portable as opposed to working for an organisation at a fixed location. Many good ones are often kept on as maintenance electricians when the plants, mines, whatever are up and running. That is if they want to stay on. Lots of my friends have done that over the years. Getting a double ticket is always worthwhile, too. Then you can switch back and forth as needed or for a change. It’s nice to do something different.
I do agree with you about AI. Looks unstoppable until it is eclipsed, outdated, or lending conditions change. But there will always be a need for healthcare professionals. People will always need something built or repaired. If you have a good reputation in your trade you can find a new job with a few phone calls. There is a network out there.
There will always be a need for healthcare professionals — lets include nurses and carers and Healthcare is the biggest sector employer in the uS and has been growing because of all those unhealthy folks that are taking their various meds and living longer.
but
Elon has a plan to tap into that
Musk has predicted that Tesla’s Optimus humanoid robot will outperform top human surgeons within 3 to 5 years (by around 2028–2031) and make medical school “pointless”.
Also regarding Nursing and Caregiving jobs , Musk has also suggested that Optimus could serve as a 24-hour nurse or helper for physical assistance, hazardous tasks, and elder care.
These robots will take loads of folks jobs , Musk is planning to make millions of them
Musk has a mainstream 2030 target of 1 million units annually
With a top end aspirational Texas factory target of 10 million units annually
Which is why I think those charts contain many tops in them and others will top out soon
Not doom saying but it looks like without government intervention 2026 just might be the peak year for human employment
Anyone who takes Musk’s promises and lies seriously is braindead.
AI will have have to be profitable to sustain the current rate of capex growth. That has been the universal problem with new tech buildouts….
AI is already eating it’s own excrement.
Electricians are always in demand. Unlike what the Tesla Fanbois think, electrical systems always need maintenance, fail, and require upgrades.
We don’t need more jobs; we need higher productivity and higher wages.
Ohio truck plant closes, jolting 1,400 workers days before MAGA rally
Is that the Ford plant? They have massive supplier issues and ran out of parts.
AI is the latest of the disruptors, and the biggest since the internet and computerization of everything, that have triggered structural changes across the industries that span the US economy.
Well, America has always been a social Democracy with an everyday market system that approximates the capitalist ideal of the glorious struggle between equals;
the buyers and the sellers
How many jobs gained in the ‘influencer’ industry? 🤮 🤮. I added the word industry as a joke only, bcuz that’s what influencers are. But it sure seems there are a lot of them, as well as wannabe influencers. Bring back real jobs!
Influencers fall under Internet Publishing and Broadcasting and Web Search Portals or under Media Streaming Distribution Services, Social Networks, and Other Media Networks and Content Providers
It’s essentially the same as news, journalism, etc but for the younger generations who are social media addicts rather than MSM addicts.
Who know what they’ll think up of next??
Maybe they’ll finally get teleportation working.
Then we could move material like people in those old music videos. One second ago, they’re on the left side of screen, close to the viewer, the next, they’re wayy in the back, on the right! The second after that they’re in another place! When that happens, transportation costs will drop to zero and will allow us to have a truly interstellar economy!