
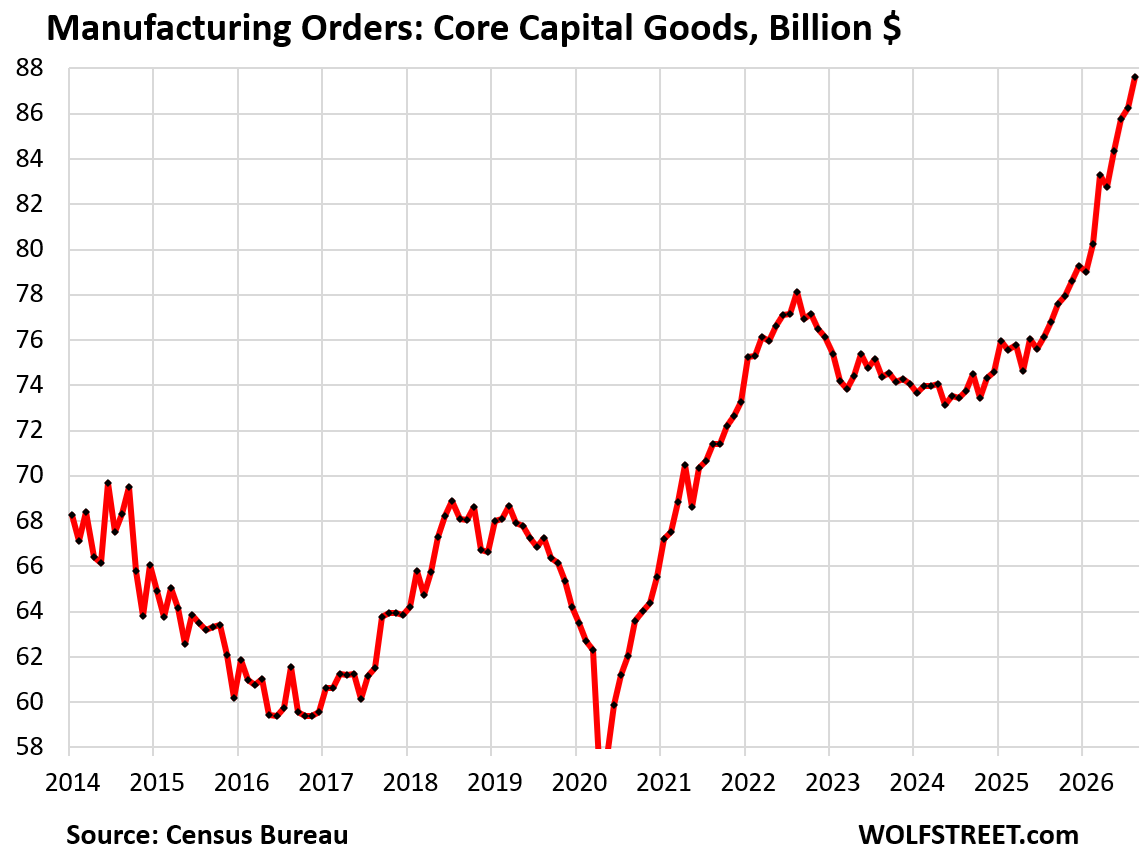
Orders received by US-located manufacturers of core capital goods spiked by 14% YoY, of machinery by 15%, of IT equipment by 16%.
By Wolf Richter for WOLF STREET.
Orders received by manufacturers in the US of “core capital goods” (durable goods without defense and aircraft), a proxy for business investment, spiked by 1.6% in August from July, and by 14.1% year-over-year, to $88 billion, according to data from the Census Bureau today.
This category includes manufacturers of factory equipment, construction machinery, farm implements, computers and electronics, electrical equipment, appliances, heavy-duty trucks, railroad rolling stock, ships, and fabricated metal products. More on specific AI-investment-related categories in a moment.
These core capital goods orders are a sign that manufacturing is getting a massive boost from the AI infrastructure investment boom, with orders ranging from rebar to gas-turbine and diesel generators for data centers, and for everything else in between, amid reports of intractable shortages of all kinds, such as of turbine blades and vanes, that are tangling up supply chains.
“Orders” are an early indicator of future economic activity. It may take months before orders emerge from the backlog and become actual economic activity of production, sales, and investment.
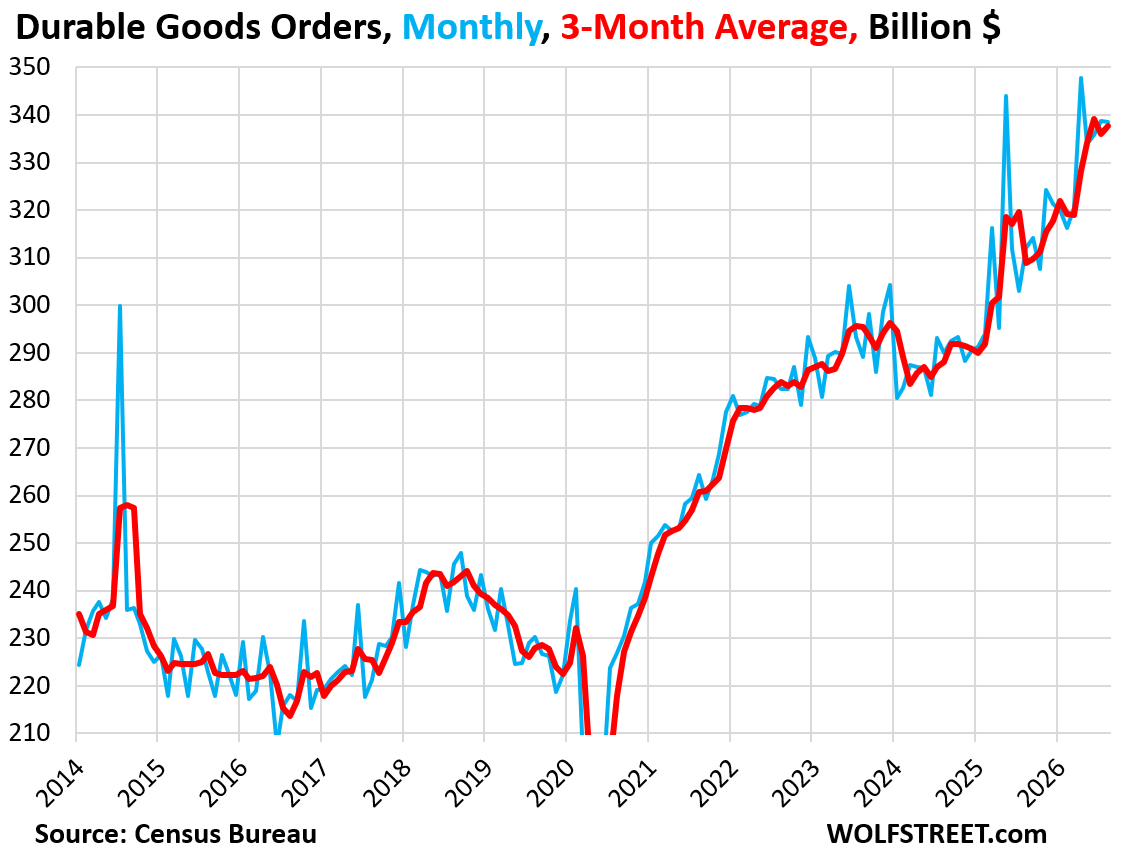
Orders for all durable goods, including aircraft and defense, were unchanged in August from July, at $339 billion, seasonally adjusted, on a drop in transportation equipment orders.
But year-over-year, durable goods orders jumped by 8.5% (blue line in the chart below).
In one month, an airline orders 30 Boeings, and aircraft orders spike by a huge amount, and the next month no airline orders 30 jets, and orders plunge off that spike, giving transportation equipment its extremely volatile nature.
The three-month average, which irons out some of the month-to-month squiggles, rose by 0.5% in August from July, and jumped by 9.3% year-over-year (red line).
These are hot year-over-year growth rates, and they’re largely driven by the AI infrastructure buildout boom.
AI infrastructure investment boom in durable goods:
Here are the orders received by some of the industries that are included in “core capital goods” manufacturers and are involved in the AI infrastructure investment boom.
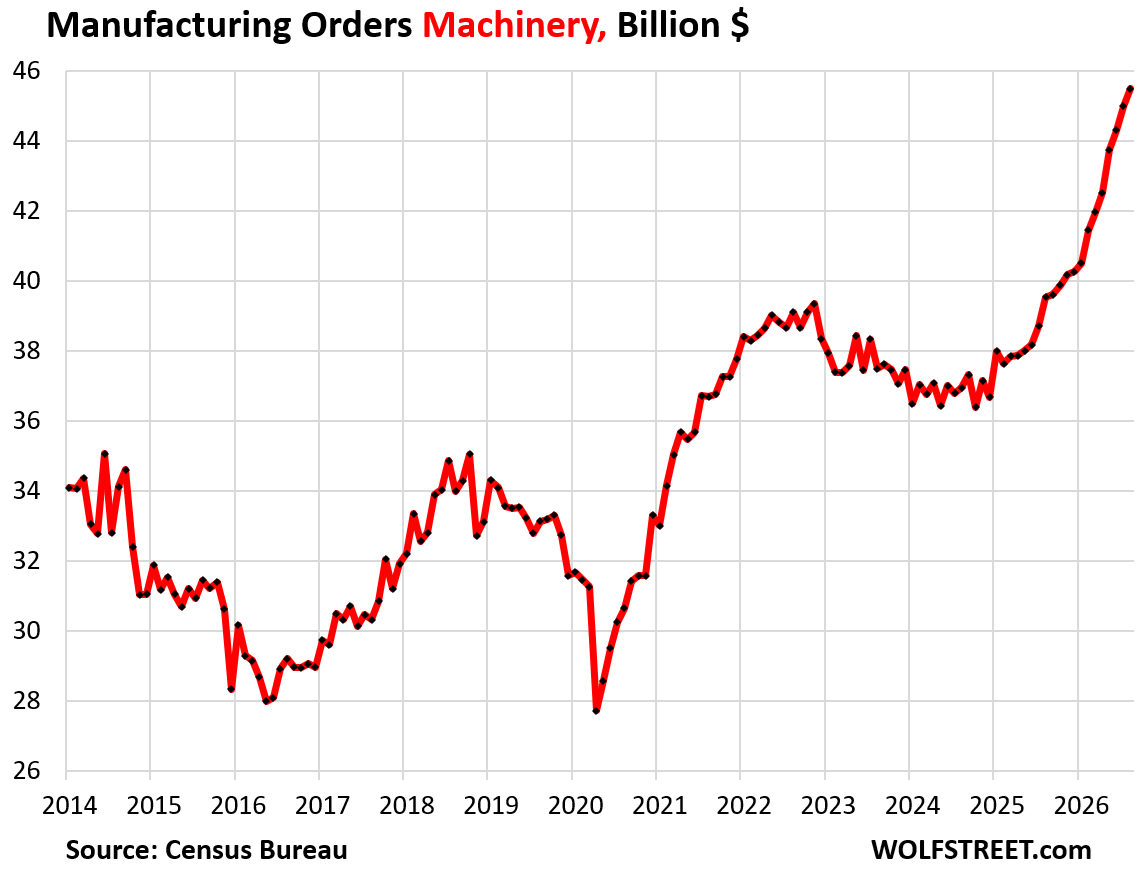
Orders for machinery spiked by 1.1% month-to-month and by 15.1% year-over-year, to $45.5 billion. This has data center buildout written all over it.
Industries in Machinery Manufacturing (North American Industry Classification System, NAICS, code 333) includes manufacturers of:
- Engine, Turbine, and Power Transmission Equipment
- Ventilation, Heating, Air-Conditioning, and Commercial Refrigeration Equipment
- Machinery for Construction, Agriculture, and Mining
- Industrial Machinery
- Commercial and Service Industry Machinery
- Metalworking Machinery
- Other General-Purpose Machinery.

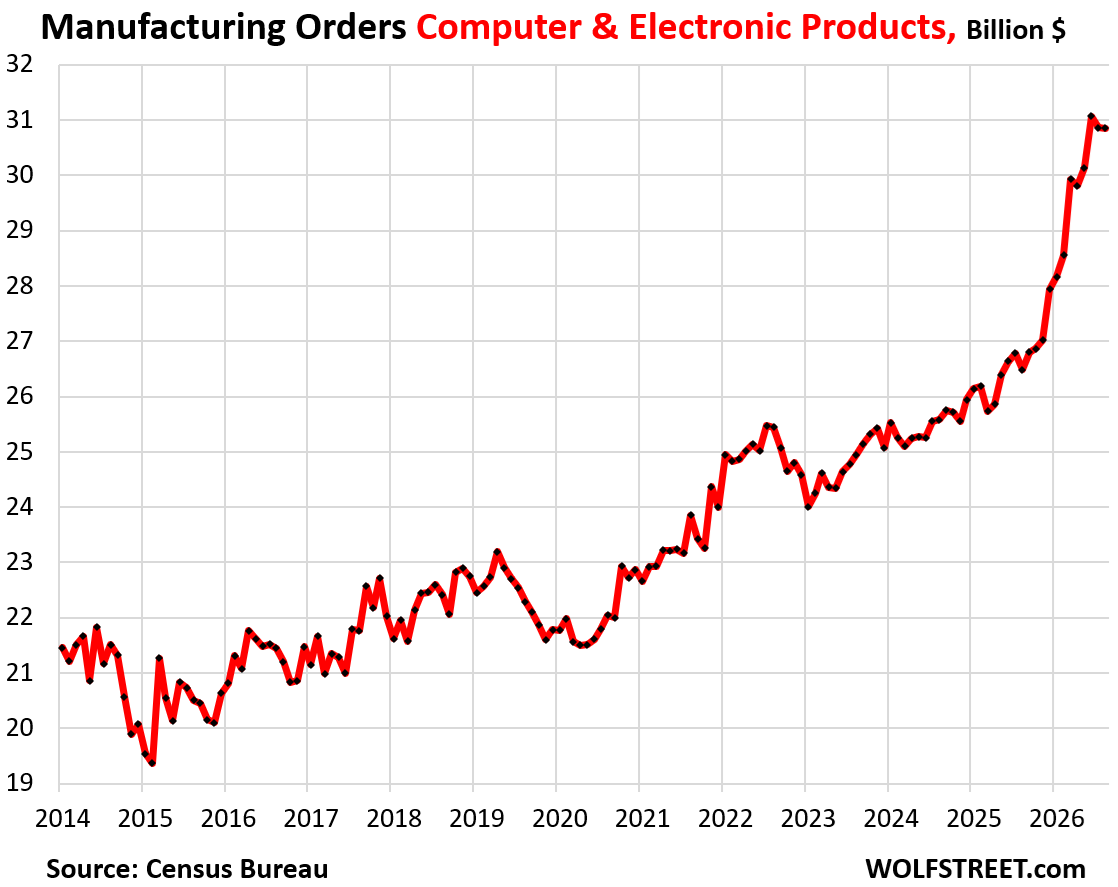
Orders for computer and electronic products were unchanged for the month at $31 billion, but spiked by 16.5% year-over-year. This includes orders for semiconductors at US-located semiconductor fabs.
Industries in computer and electronic products manufacturing (NAICS 334) include manufacturers of:
- Computer and Peripheral Equipment
- Semiconductor and Other Electronic Components
- Communications Equipment
- Audio and Video Equipment
- Navigational, Measuring, Electromedical, and Control Instruments
- Magnetic and Optical Media.
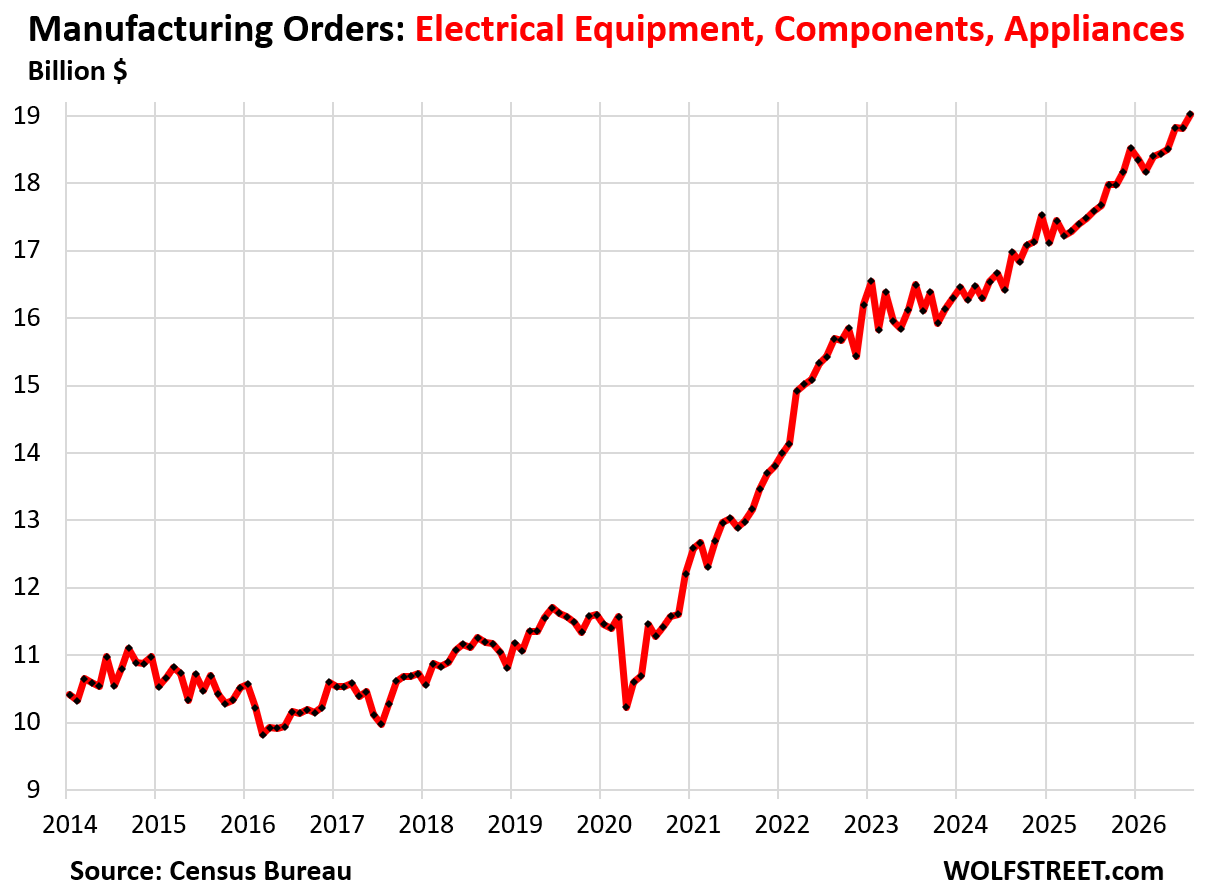
Orders for electrical equipment, components, and appliances, which includes some of the electrical equipment needed in data centers, jumped by 1.1% month to month and by 7.6% year-over-year to $19 billion.
Industries in Electrical Equipment, Appliance, and Component Manufacturing (NAICS 335) include manufacturers of:
- Electrical Equipment
- Electric Lighting Equipment
- Other Electrical Equipment and Components
- Household Appliances
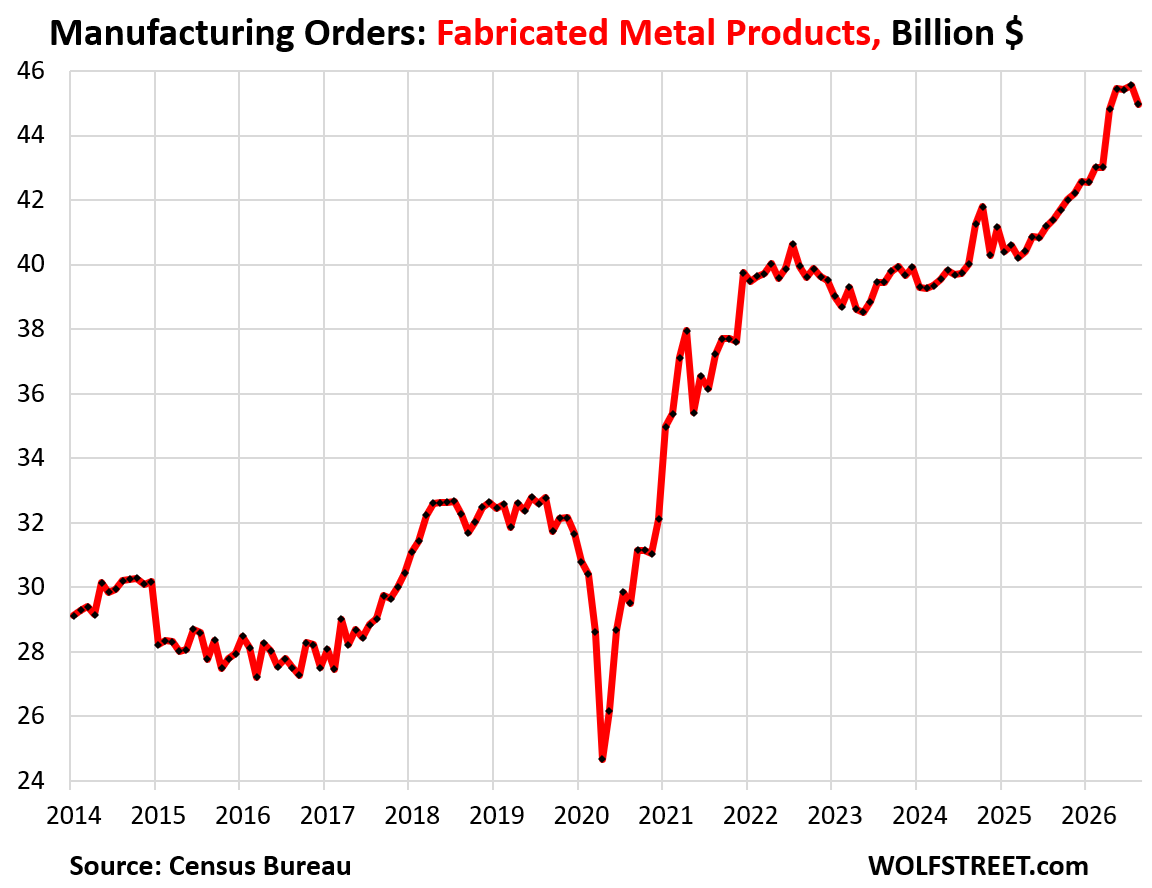
Orders for fabricated metal products declined by 0.6% in August from the record in July, and jumped by 8.6% year-over-year, to $45 billion.
Industries in the Fabricated Metal Product Manufacturing category (NAICS 332) use processes such as forging, stamping, bending, forming, machining, welding, and assembling metals into intermediate or end products (other than machinery, computers and electronics, and metal furniture).
These strong orders for core capital goods in August come on top of the hot S&P US Composite Flash PMI for September manufacturing and services that had inflation pressures written all over it, indicating that core capital goods orders for September will show more signs of strength and that inflation pressures will continue to percolate through the economy from business to business.
The hot S&P PMI report, and its “worry for the inflation outlook” had sent bond yields into an upward spiral (we discussed this here). Some excerpts from the S&P report:
“US business continues to boom, with output growing at the fastest rate for over five years in September…
“Business is clearly booming now in both manufacturing and services.
“However, this growth is being accompanied by some of the most severe supply chain bottlenecks seen in the near-two-decade survey history if the pandemic is excluded, with companies also reporting increasing problems finding suitable staff. Backlogs of work are consequently rising sharply….
“While this accumulation of uncompleted orders bodes well for the further expansion of output and capacity in the coming months, it also indicates that companies are developing more pricing power, and hence is a worry for the inflation outlook.
“Firms’ input costs have meanwhile jumped in September at the steepest rate for four years, with fuel and transport costs spiking higher thanks to the rise in oil prices seen during the month, which will add further to the upward pressure on selling prices and inflation in the coming months.”
In case you missed it: $6.53 Diesel US Average, $8.25 in California, Worsens Already Hot Inflation, amid Record US Diesel Exports. Gasoline & Jet Fuel Prices also Spike
Enjoy reading WOLF STREET and want to support it? You can donate. I appreciate it immensely. Click on the mug to find out how:


Those are some pretty explosive charts. Just more data supporting more inflationary pressures. Hopefully its all just transitory!
It is a good thing manufacturing orders are up. Need to continue to grow the private sector and shrink wasteful spending and fraud in government. Need to reduce the deficit and debt. That will reduce inflation and improve national security. I don’t mind paying temporarily higher fuel costs if it means stopping evil in the world. Democrats who cut gas and oil exploration and production while pushing the green scam. Thankfully that has been reversed and we are also advancing nuclear power as well. Dependable and low cost power is essential to a strong economy and national security.
I just read where California closed two refineries in the last 8 months and now they are importing from foreign countries. I don’t get it.
Wine consumption in the US and globally collapsed. Look at the charts in this:
https://wolfstreet.com/2026/03/26/us-winemakers-and-beer-brewers-face-an-existential-crisis-plunging-alcohol-consumption/
The state didn’t directly close the refineries, they’re just the two most recent in a string of closures of refineries that are old and increasingly unprofitable. A paper from the Stanford Climate and Energy program from February said that there are multiple causes:
“…The downward trend in refining activity reflects myriad factors, including most critically: (1) the depletion of California’s crude oil fields and a corresponding decrease in the economic viability of in-state crude oil production, (2) declining in-state gasoline sales, (3) declining in-state fossil diesel consumption, (4) ongoing national and global consolidation of the oil industry, and (5) increased availability of imported finished fossil fuel products. For these reasons, the downward trajectory in California petroleum refining capacity is likely to continue in the years to come.”
— The Writing on the Wall: Why California Refineries Are Closing
#2 and #3, plunging consumption of gasoline and diesel in CA, are the primary reasons; consumption has plunged because of more efficient ICE vehicles, including a large percentage of hybrids, a large share of EVs, and useable mass-transit systems the biggest cities. CA refiners EXPORT gasoline and diesel to Mexico because they cannot sell their product in CA. That trend has been known for two decades. No one is going to invest in an industry with structurally dying demand.
As long as the Republicans continue to play choose-your-own-reality with the government then China will continue eating our lunch, and we will continue trying to maintain our global hegemony by just borrowing money from everyone else to pay for it. The rest of the world will also be at least somewhat prepared for climate change as the damages increase, while the US is off with our news friends who also aren’t Paris signatories, which I think right now is basically just Libya, Yemen and Iran.
It’s a scam buddy, the climate has always been changing.
I doubt it. But suppose you are right, and the whole CO2 / climate thing is incorrect. We still need to transition away from fossil fuels, because at some point the amount remaining will become very expensive to recover. And we are transitioning away, which is a good thing.
That said, do you work in climate science, meteorology, geochemistry, or something like that? I don’t, but I do work in science. And I know enough to know that I don’t know enough about the methods employed by those fields, and do not have a deep knowledge of the scientific literature in those fields. And I’m glad that for the measurements I make, there’s not a huge collective of people who don’t know my field, who have decided that they have a strongly held opinion about the measurements that I make. But it has happened before. The scientist who first discovered that lead was accumulating in the environment due to leaded gasoline, had a whole army of industry shills try to discredit him.
In my own subdiscipline, a scientist named Kristine Hansen published an innovative early method for measuring certain chemicals now known as PFAS or “forever chemicals”, and found that the blood of every human she measured was contaminated with the stuff. Because she had published it, other scientists could apply her methods, and/or improve upon them, and I was one of those scientists running a version of the Hansen method back in the day. And we could all see the same thing that she saw, that everyone was contaminated with this stuff, and there was no better explanation. What I didn’t learn until years later, was that because the “suits” at her company, 3M, didn’t like her results, they did everything they could to discredit and sideline her. So she went on to have a mildly tragic career, all because some company men had a vested interest in her being wrong. And I bet they convinced some other non-scientists that she was wrong, people who believed those company men were acting in good faith, but they weren’t
So if you don’t work in climate science or an adjacent field, ask yourself, are the people criticizing it from the outside, really acting in good faith, or are they acting in bad faith to further their own economic agendas?
Yes, China is eating our lunch. They brought a lot of new coal plants online this year.
I need someone to convince me that this AI boom is a productive use of capital by the private sector.
Sooner or later these investments have to pay for itself; actually carry itself. Right now it is a gold rush. I read an article yesterday about people selling their homes for AI stock. Crazy times.
I can not. All those big data centers will become useless. Remember the IBM 360s and the big buildings they were in. Along came the cell phone and now these little beasties can compute better than a 360. No need of the big buildings, We got 3500 or so.
The unknown is if those orders for “core capital goods” actual turn out to be capital goods and not consumption of capital.
I’m thinking 1800’s and rail roads and 1980’s and Fiber Optics.
AI has great potential, but I’m not sure the current AI rentier business model is the best way forward for the economy to enjoy that potential.
I guess, time will tell.
Mr. Wolf writes: “In one month, an airline orders 30 Boeings, and aircraft orders spike by a huge amount, and the next month no airline orders 30 jets, and orders plunge off that spike, giving transportation equipment its extremely volatile nature.”
Issue: It would seem that huge contracts of this type may have publicly released data as to delivery times that could smooth out the volatility, the same could be said of defense contracts in the Federal Registry and foreign export control licenses. While a huge amount of work, somebody at the Federal Reserve Bank of New York must be obtaining this data.
Sounds like Embedded inflation is here.
If you’re a hyperscaler.
New Orders for Durable Goods has not been an accurate Leading Economic Indicator for about six months because inflation and supply delivery problems have caused manufacturers to stockpile in advance to avoid rising costs and delays. Shipments have been a better indicator. However, I believe new orders and shipments are moving back to more normal relationships.
Bad time to be building a PC.
If I ran a manufacturing company at the moment I’d be inclined to accept orders from new customers only if they paid part upfront. Especially for any non-standard goods where I couldn’t expect to find another customer easily if the original one welched on the deal.
Or is there some other way of getting insurance against customers who won’t stump up?
Yes you can get credit insurance, but for new companies with poor balance sheets, it’s expensive or unattainable.
This is solved with Nvidia-style buisness model. You give (“invest”) your customers money to buy your product.
It’s hard to read where everything is going. One could say everything is bullish with this data and the money printing that will happen with our debt. Others are more bearish and say people will seek safer options with higher bond yields or safe havens like gold, silver, copper, etc.
Both seem logically possible scenarios, neither one of them particularly great with inflation
I’m never quite sure what this economy would look like without massive government budget deficits, year after year. Hard to suss out I suppose.
“I’m never quite sure what this economy would look like without massive government budget deficits, year after year. Hard to suss out I suppose.”
Very few countries around the world can get away with the sh*t the US has been able to pull for 55+ years vis a vis perpetual fiscal/trade deficits.
So they sort of provide a laboratory sample of what might result.
Nobody is willing to take deficit countries’ IOUs/fiat paper promises for more than a few years running – trade surplus countries don’t want to hold that much in fiat-based paper-thin promises of future payment for most perpetual trade deficit countries (at least anywhere near the level of fiat-paper crapola in USD they are willing to hold).
Think of it this way – would you continue extending credit (in exchange for your real-asset, real-cost produced goods) to “buyers” who perpetually could not balance their books (fiscal deficits) or generate enough real assets (trade deficits) to exchange real assets for real assets?
A few years of “gimme-a-hamburger-today-and-I’ll-gladly-pay-you-someday” wears very very thin for trade surplus countries.
So it is sort of a mixed bag regarding what the US would look like without massive fiscal deficits.
On the one hand, it could end up like sclerotic Europe – slow-growing-to-stagnant-to-rotting-away.
That is the most likely outcome.
And that is even with Europe running unprecedented ongoing fiscal deficits in their already debilitated economies.
But if by some remote miracle, the US could shrink/eliminate its “forever” trade deficits and become a “real boy” economy, growing through trade surpluses vs. phony-baloney, moron-directed fiscal deficits, then the US might look like the US of the 1950’s/1960’s or the China of the last 25 years.
In the end, all that matters is real asset growth/productivity and not the phoney-baloney, paper-shuffling circle-jerk of perpetual trade/fiscal deficits.
It is just that the US (thanks to the huge accumulated asset/savings base of the fast-receding past) has been able to play the bullsh*t games for longer/harder than fragmented/far less wealthy Europe.
But not forever.
The USD is the reserve currency for the world and in order to get those dollars out there to be used by other countries for their transactions, the US needs to run trade deficits. Triffin dilemma/paradox.
Similar to the dot com boom, there is double ordering to avoid shortages. Growth rates are pulled forward and the hangover will be brutal!
All this negativity. Want to be convinced of anything? Hire a $500/hour therapist.
The deficit? Aren’t tax revenues are rising faster than the interest expense required to service it? So what’s the problem?
Inflation? How much faster did inflation increase more than per-capita GDP, anyway?
All these negative waves can be tiresome in the short term but but in the long run, these are the ‘good old days’.
Best wishes to all.
How do you separate out price gouging from “unit” sales? I’m guessing the vast majority of this is price gouging.
Nope, and yes we can separate. The “Core Goods” Producer Price Index, which applies here, rose by 4.6%. The rest of the 14% core capital goods growth is unit sales.
I discuss this stuff here for a reason:
https://wolfstreet.com/2026/09/10/ppi-shows-surging-inflation-across-prices-that-companies-pay-each-other-the-fed-should-stop-dilly-dallying-around/
“ WHOOSH, Go Orders at US Manufacturers of “Core Capital Goods,” Fueled by the AI Infrastructure Boom.” Oh great – so money is going into this parasitic sector of the economy that benefits a very small percentage of the populace, instead of into the economy in general.
This is a vampire-squid sector – little to no benefit to the economy as a whole.
Wolf may disagree with my stance, but then again he is at the epicenter of the AI Boom itself.
Jerome yes haven’t you heard everything is going so well that consumer confidence has posted its second worst month ever!
Strange days indeed. Perhaps all isn’t what it says it is, but what does a Yappy mutt know?
Consumer confidence measures have deteriorated into a bad political joke. Look at the partisan divisions, confidence by Democrat-leaning and by Republican-leaning respondents, it’s just BS ridiculous, look at the chart of what happened after Trump won the election. ZH has been doing a good job pointing out that BS. I’ve pointed this out here many times.
No one with any brain is taking this BS seriously.
It’s hard to really know what to believe in these days. I suppose we can all cherry-pick which fits ‘our narrative’. As we see in so many things.
One man’s news is another man’s faux noise. I’ll just call that a sign of the times, and I do know why so many believed the earth was flat well after Copernicus died. Actually some still do.
“#2 and #3, plunging consumption of gasoline and diesel in CA,”
If plunging demand were a cause of supply reduction, why are fuel prices in Calif so high. When demand collapses, prices should decline. I guess in our Corporate Regulatory Capitalist economy, the mechanisms of supply and demand dont operate.
When I drive to Calif – which I do often, I always gas up in Reno where gas is $1/gallon cheaper than it is as soon as I cross the border into Calif. My Hybrid has a 550 mile range on a tank of Gas. That means I can usually get away with 1 refueling in Calif.
Nobody in their right mind would want to run an industrial operation like a refinery in Calif. Maybe thats the way Californians like it, but lets not pretend that refiners left the State and abandoned their assets for any other reason than the fact that Calif is hostile to business that involves actual production of molecules and increasingly hostile to all businesses.
“If plunging demand were a cause of supply reduction, why are fuel prices in Calif so high.”
Californians have every reason in the world to tell the refinery cartel here: FU, and buy an EV. California has long had a refining cartel, run by Chevron, that every new governor promises to do something about, and as soon as he gets going, even any inquiry gets squashed. California refineries are big gasoline and diesel exporters because what else are they going to do with their excess capacity? So they’re shutting some of their ancient operations down and are modernizing others. California gasoline consumption has been in freefall for two decades, and it accelerated in recent years due to EVs, which are everywhere. The more refineries charge, the more Californians buy EVs or fuel-efficient ICE vehicles. People are tired of getting fucked by the refining cartel. It’s not difficult to understand. Give it a try.
great summary and history. i’ve lived in 4 states over my first sixty six years. CA was by far my favorite. bay area. loved the intelligence, capitalism and inventors and weather and weed business and lifestyle and pure beauty of city and nature………NYC is great. my hometown. but the weather sucks. AZ was wonderful except the long summer. charlestonSC was delightful life. house in town and beach house 20 minute easy drive to folly beach. but the people there are drop dead stupid. but nice. they joked they were like japanese. polite racists who worship their ancestors and rice plantations….. best food town. bay area second.
“…and increasingly hostile to all businesses.’
I am inclined to agree, but if you call out CA, you have to look at what “business” has done to the world. We have one of their own driving prices skyward and could not care less, nor has ever lived as a regular American.
American Business isn’t this wonderful group of good folks just trying to get by. That is the low end and those of us who are still the ‘do-gooders’.
“Capital misallocations” are never evident until after the mania has subsided.
Wait…
Imagine the ‘WHOOSH’ sound that would/will happen when the AI boom implodes. Time will seem to stand still. Those modern, progressive cities of San Francisco and San Jose will resemble Pompei. No volcano needed!
San Francisco has been through numerous imploded massive bubbles, starting with the Gold Rush. The last Big One was the Dotcom Bust. We know how to do Boom and Bust!