
Spending on discretionary goods and services that people buy to have fun with was particularly motivated.
By Wolf Richter for WOLF STREET.
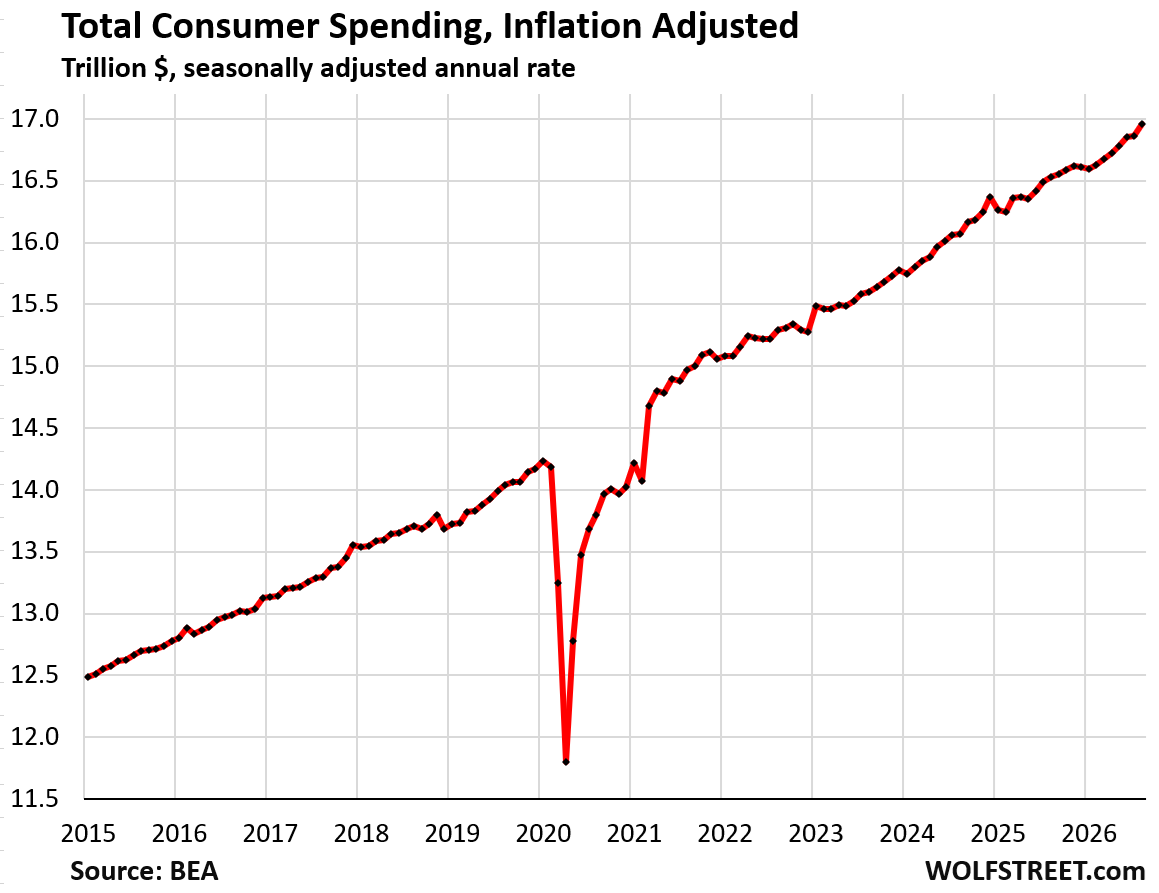
Adjusted for inflation, lots of inflation, consumer spending in August rose by 0.55% month-to-month and by 2.6% year-over-year, according to the Bureau of Economic Analysis today.
Americans have been out there spending despite soaring gasoline prices, AI-will-kill-us-all-mongering by AI companies, geopolitical chaos on the front pages… you name it, we have it – but no problem, the spending must go on, including or especially on discretionary experiences, such as restaurants meals and lodging, and on discretionary goods, such as recreational vehicles.
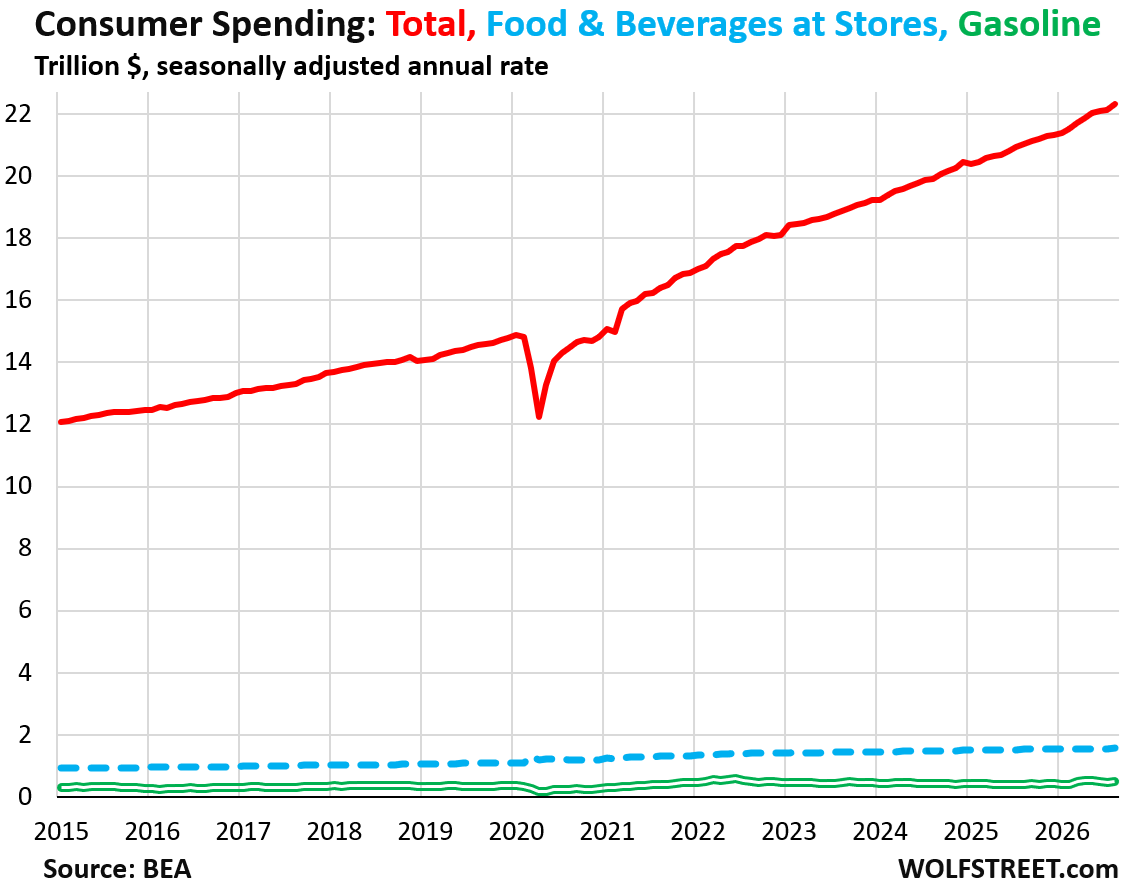
Not adjusted for inflation, consumer spending in August jumped by 0.86% from July, and by 6.1% year-over-year, to an annual rate of $22.3 trillion (red in the chart below).
These are big growth numbers, and we’ll see some bigger ones below, but there was a lot of inflation too. This is how an economy “is running hot” – lots of spending growth and lots of inflation.
Of the total amount spent:
- 69% got spent on services; half of that went to healthcare services (not including healthcare products) and housing combined.
- 11% got spent on durable goods, such as motor vehicles, recreational vehicles, computers, furniture, appliances, etc.
- 20% got spent on nondurable goods, such as pharmaceutical products, food, gasoline, clothing, footwear, household supplies, etc.
Food prices and gasoline prices are constantly in people’s faces, and when they rise, they piss people off, but they account for only a relatively small part of total consumer spending.
Spending on food and beverages at stores accounted for 7.0% of total consumer spending (dotted blue line). Gasoline and other energy goods accounted for 2.3% of total consumer spending, up from a share of 1.9% before prices began to spike (double green line). This relatively small share of total spending is in effect why the recent gasoline price spikes, and the 2021-2022 food and gasoline price spikes didn’t derail the economy.
About inflation adjustments: Price changes for each good and service that is in the consumer basket are tracked at that level, and spending on these goods and services is then adjusted for inflation by the price changes for those specific goods and services.
For example, if gasoline prices spike by 10%, “real” spending on gasoline is adjusted for 10% in price changes of gasoline. So, over time, gasoline sales adjusted for inflation are nearly flat, with seasonal variations and a slight downward trend, roughly paralleling gasoline consumption in gallons.
And if rents rise 2%, “real” spending on rents is adjusted for 2% in price changes.
Then the price changes for each product are combined and form the overall inflation rates.
So to see where people actually spend their money, we need to look at nominal spending, not adjusted for inflation.

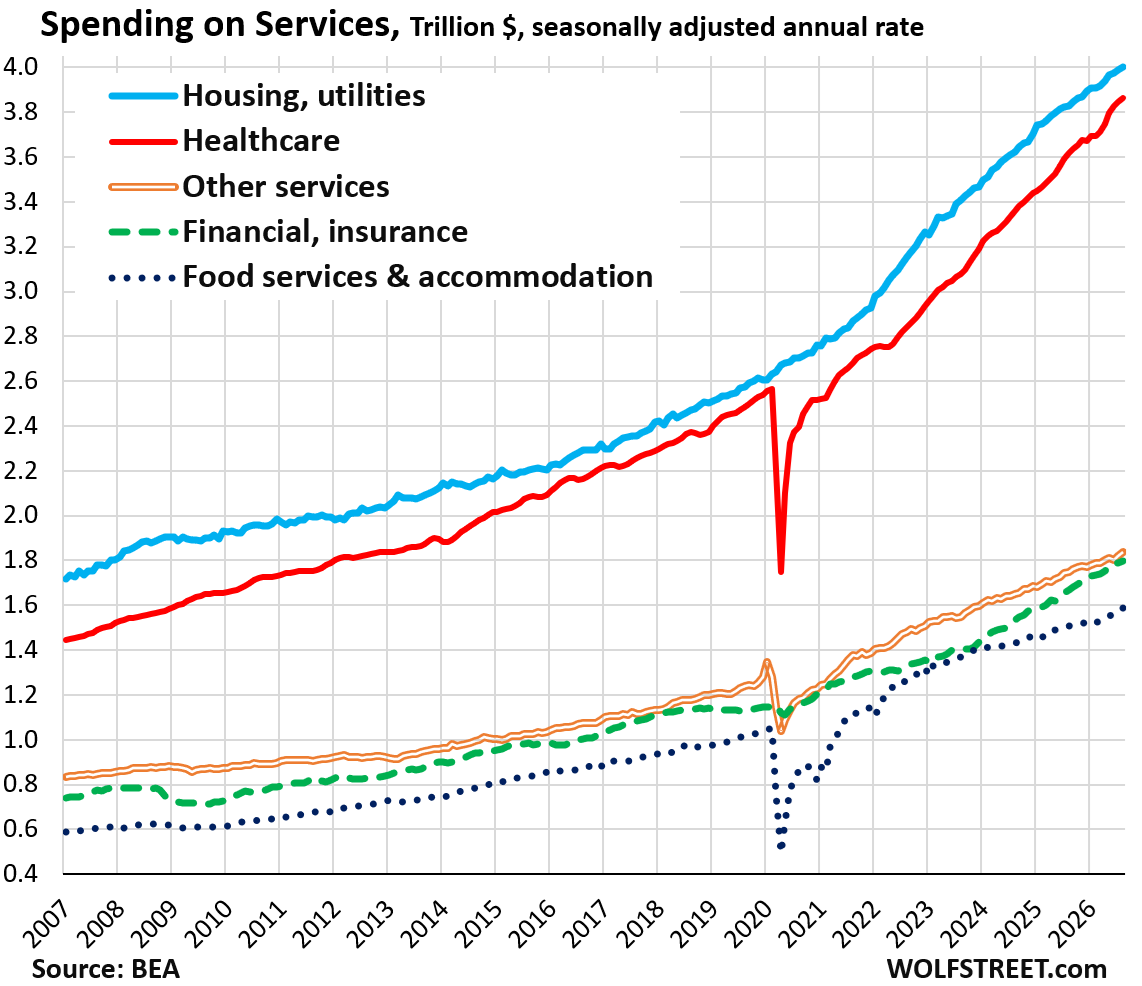
Spending on services, not adjusted for inflation rose by 0.50% month to month and by 5.9% year-over-year in August.
Spending on services is dominated by housing, which accounts for 17.9% of total consumer spending, and by healthcare services (includes health insurance but not healthcare goods), which account for 17.3% of total spending.
Spending rose in:
- Housing and utilities: +0.26% monthly; +4.5% YoY (blue in the chart below).
- Healthcare services: +0.39% monthly; +6.8% YoY (red).
- Other services: +1.03% monthly; +4.9% YoY (double gold).
- Financial services and insurance (not including health insurance): +0.48% monthly; +7.6% YoY (big dotted green).
- Food services and accommodation: +1.31% monthly; +5.2% YoY (small dotted dark-blue).
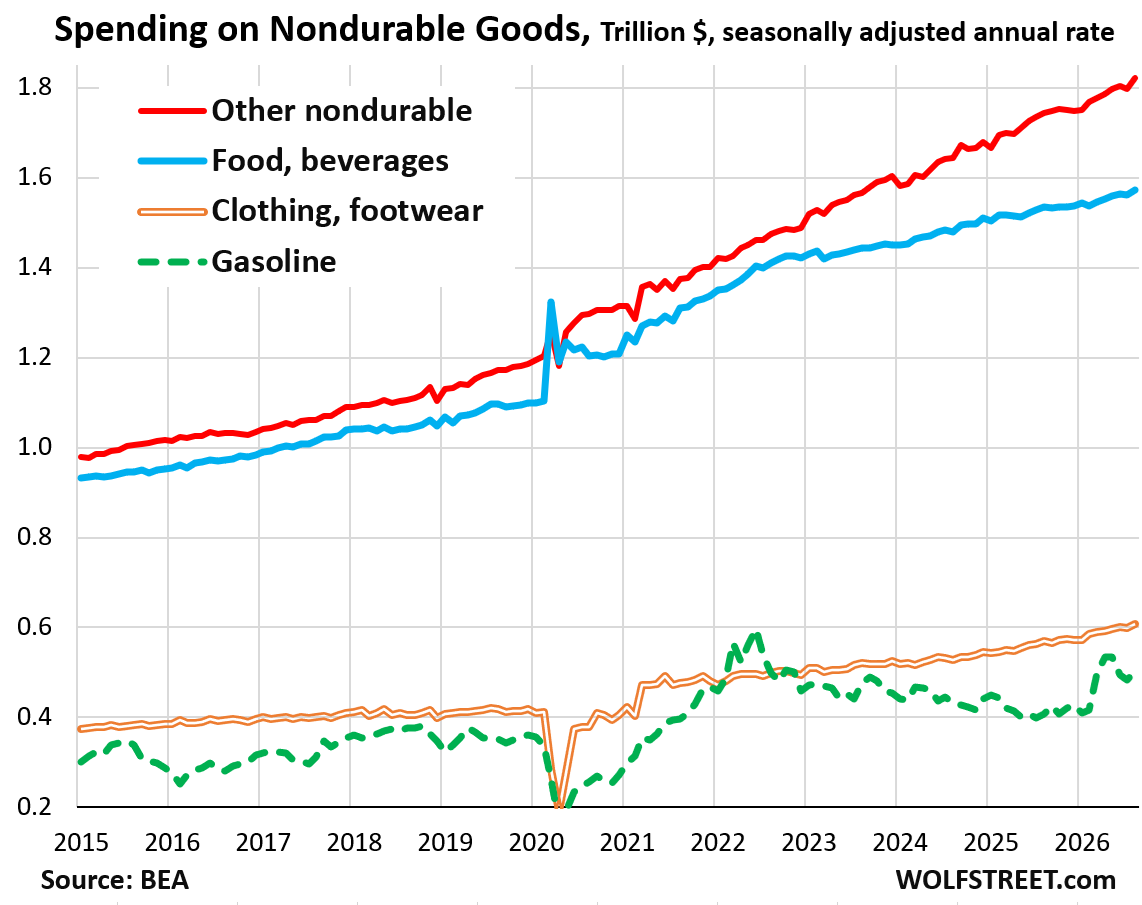
Spending on nondurable goods spiked by 1.5% in August from July and by 5.9% year-over-year.
The big driver was gasoline due to the price spike. If the price spikes are taken into account, “real” spending on gasoline (adjusted for price changes of gasoline) declined month-to-month and year-over-year.
Pharmaceutical products and medicines dominate the “Other nondurable goods” category. In addition, this category includes games, toys, pet items, etc.; household supplies; personal care products; tobacco products; magazines, newspapers…
Spending rose in:
- Other nondurable goods (mostly medical goods): +1.45% monthly, +4.5% YoY (red)
- Food and beverages bought at stores: +0.74% monthly, +2.4% YoY (blue)
- Clothing and footwear: +1.5% monthly, +6.9% YoY (double gold)
- Gasoline: 4.3% monthly, +24% YoY (big dotted green).
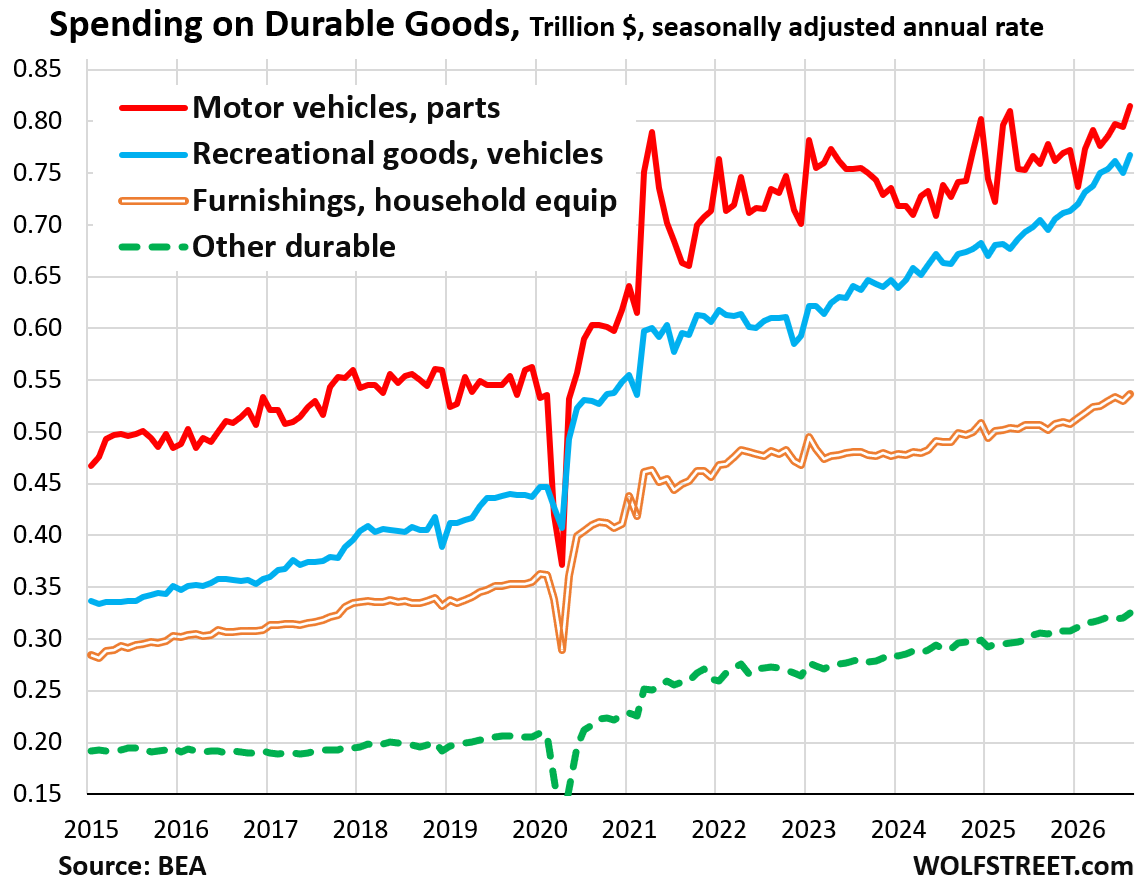
Spending on durable goods spiked by 2.0% month-to-month and by 6.4% year-over-year, not adjusted for price changes.
“Recreational goods and vehicles,” the #2 category of durable goods, are what consumers buy to have a blast with. This is discretionary spending: ATVs, snowmobiles, motorhomes, travel trailers, dirt bikes; video, audio, and photographic equipment; computers, tablets, and software used for entertainment; bicycles; hunting, fishing, and camping equipment; musical instruments; recreational books; and other stuff.
Spending rose in:
- Motor vehicles & parts: +2.5% month-to-month, +7.3% YoY (red).
- Recreational goods and vehicles: +2.3% monthly, +8.8% YoY (blue).
- Furnishings and household equipment: +1.2% monthly; +5.9% YoY (double gold).
- Other durable goods: +1.3% monthly; +6.4% YoY (big dotted green).
These dizzying rates of consumer spending growth amid lots of inflation show that the economy is “running hot.” That trend is also visible among businesses, where massive amounts of investments are now getting plowed into infrastructure; for businesses, inflation, as measured by the PPI, has been substantially hotter than for consumers. And of course, federal government deficit-spending has been running hot for years.
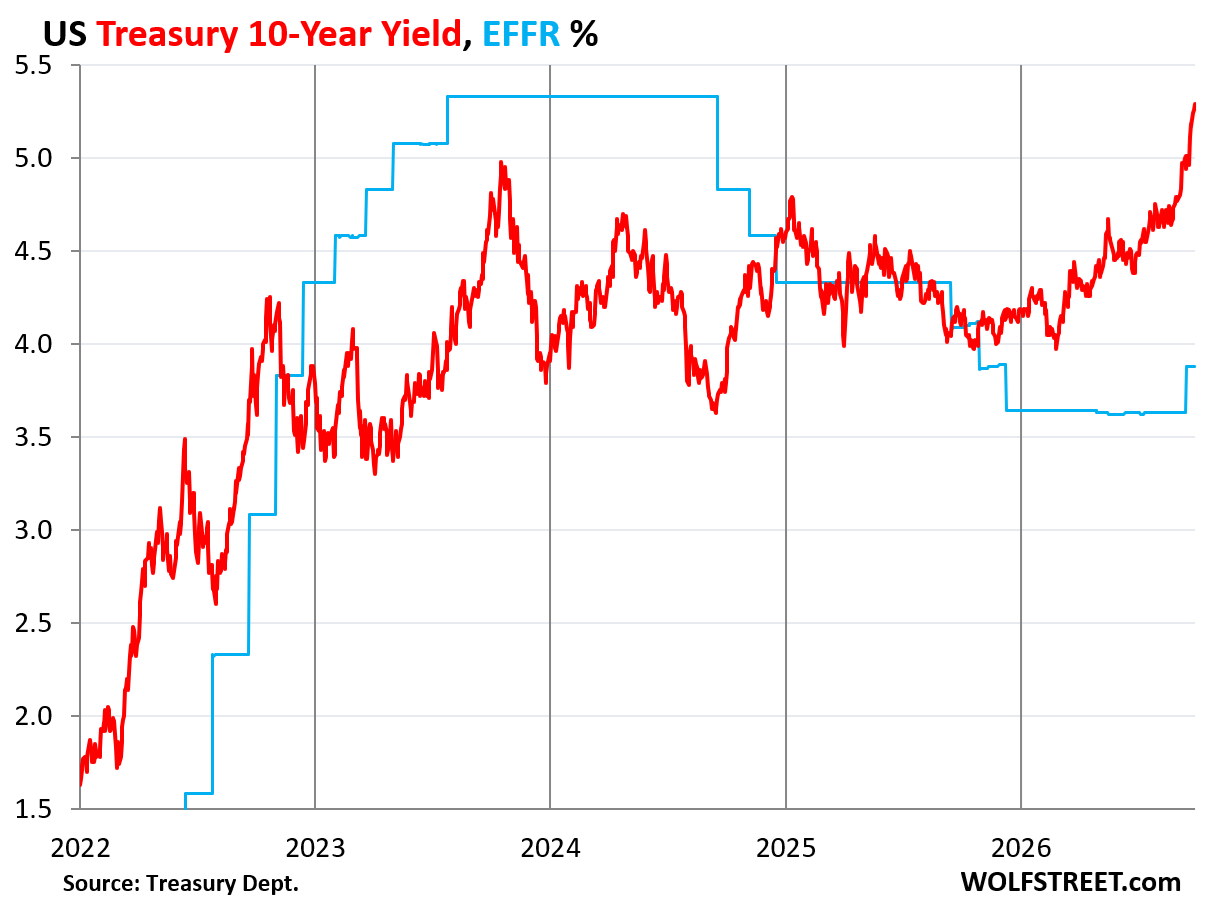
This is a powerful mixture. And the bond market is seeing it too. The 10-year Treasury yield today rose to 5.30%, welcome back to the normal range, so to speak, highest since mid-2007, just before the Fed’s interest rate repression and QE began to systematically demolish the bond market.
In case you missed it: Not Even the Massive Changes of Methodology Can Get PCE Inflation Back into the Bottle
Enjoy reading WOLF STREET and want to support it? You can donate. I appreciate it immensely. Click on the mug to find out how:


U.S. bond yields post biggest jump in a generation as global rout rattles investors
Howdy SoCal BD. The youngin generation has been ZIRPed, QEed, Dopeed, and has no idea what is coming. Except for the Lone Wolf Readers that is.
Yes, it’s the summer of 72′ again, the second wave of inflation is just getting started…
There is no Volcker in sight and this time around we don’t have the cool cars and have an irresponsible CONgress with 120% debt:GDP.
Read Studs Terkel
Nobody actually knows what is coming…
Maybe not, but history lends a great perspective and we may want to heed it.
The problem is bad economies are bad for voters. Pandora’s box has been opened and whatever crazy economic theory they can come up with they will. See ZIRP, QE, etc…
Plan accordingly imo.
I do:
1) American voters, who apparently get their information from TikTok, will continue to elect the most incompetent and corrupt leaders they can find.
2) The American world war enters a new phase after the election, with a ground invasion forever war costing tens of trillions over the next decade. Spoiler: The US loses again.
3) The US national debt hits $50T by 2028 as Don Jr. runs for / is rubber stamped for president.
4) Democrat voters continue their two decade strategy of being keyboard warriors as the real-world party and its old infrastructure continues to slide into obscurity, and living memory of being effective continues to fade. Trump and an army of AI bots funded by conservatives continue to serve them up fresh entertaining contradictions to repost and comment about. Apparently this lifestyle never gets old.
You keep saying this even though you keep getting shown it’s not true. The increase in 2022 from 1.5-4.1 was much larger, corresponding to a 15% drop in 10 year bond prices.
The last month saw an increase in yield of 1% and a massive 10 year bond price drop of… 3%.
The bond crash already happened and no one noticed because everyone expected it.
Howdy Folks. How dare Americans continue on with their lives.
Keep Sailing till Death.
Spent a few days on Maui. Plenty of tourists spending plenty. Decided to take my wife ti Mama’s in Paia. Maui’s iconic fresh fish venu. They were nice enough to squeeze us at the bar for lunch. They are booked for lunch and dinner 4 to 5 months out. Hard to get out of there less than $250 for lunch.
It’s literally always been that way. In fact, they used to be booked even further out then that. We had to book 6 months out couple years ago.
Would agree with that. Just a high end tourist trap so hipsters and wealthy can say, “we went to Mama’s” ans brag on how much they spent.
You want something better? Go to Tamuras for poke, Paia Fish Shop, or the Fish Shop in Ka’anapali. Foodland works too and go get what’s running and make it yourself for 1/6th the price.
Maui is a bit of non-typical representation of consumer spending. Interesting but not really insightful unless it completely breaks down. Kind of like saying it is still popular and expensive to go to Broadway plays in NY. Perhaps maybe more useful behavior observation would we trends in discretionary vs non-discretionary spending, luxury goods, Walmart, etc.
Wolf, I’m not sure where you got the gasoline and energy expenses as 2.3% of consumer spending, but I find that low percentage ludicrous. People that have to drive any amount to work would spend that in a week. And energy in the summer and winter is far, far above that 2.3%. Please tell us where you picked up those percentages.
Average household makes $88k
Average car gets 30 mpg
Average driver drives 12,000 miles per year.
Average gas price is $4.40
Average gas expenditure is $1750/year, which is 2% of $88k.
“Average household makes $88k”
Averages are always going to skew upward since bottom level is bound by zero and upper level is unbound. In other words, multimillionaires skew averages upward.
That’s why medians are a better measure of central tendency (“typical” household reality).
And…even medians can be skewed if the “universe” of households sampled is “creatively” defined.
(For instance, I’ve often wondered if college student households or non-earner (100% savings/benefits supported) households are definitionally excluded from gvt “medians”…don’t know…but interesting things can get buried in methodological definitions. Just take a look at headline unemployment numbers…long-term unemployed are definitionally excluded, artificially driving reported unemployment rates down.)
(Another possible “median household income” distortion…if 25% of young adults are compelled to live at home due to massive housing cost inflation…the median *household* income reported is going to go up but that household’s quality of life is likely going down…which would account for dissatisfaction surveys.)
Various things have to be considered when citizen financial satisfaction polls and “objective” metrics are going in utterly opposite directions.
OK, for the millionth time, try to remember it this time:
Household = 1 address, no matter who lives there. A college student living alone = 1 household. A widow on SS living alone = 1 household. A 3-generation family of 16 living at the same address = 1 household.
Therefore the overall “median” household income figure includes retirees on SS, lots of young people just starting out, about 6 million unemployed people with very little income, etc.
1. This overall “median” household income = $81,600.
2. The “median” married-couple income = $120,000.
3. Median income of “non-family” households, typically 1 person living alone, such as singles, widowers, widows, divorcees with no kids, college student in a shack, etc. = $51,000
4. The poverty income for a family of 4 = $33,000 for the US overall. It’s higher in California, Alaska, Hawaii, and other expensive states and lower in cheap states.
Gross earnings numbers, not net.
All taxable income. Then insurance costs rise, food costs rise, travel costs rise and that daily drive past the gas station….. Inflation.
Inflation is a bitch for everyone, and down the road employees will demand higher wages to keep up, and then companies have to charge more…… and so on. Happened in the 70s until the brakes had to be slammed on full stop. It took much higher interest rates than this to settle it down.
What absolutely amazes me is that consumer spending continues at such a high rate, as if it will never end. Food deliveries, yes…expensive lunches, last minute shopping for groceries. Buying ‘stuff’ on time.
I think most of this generation has not one clue about hard times and what it takes to survive them. Like it can never happen, won’t happen to them. There is a commenter on WS who always signs off with, “Got Preps”? I’m not talking about bunker survivalist nutjobs, rather sound and conservative plans and preps for a reduction of money coming in. It seems like so many are in a ‘live for the day’ mindset. And the biggest cause of US bankruptcies in the US is sudden medical expenses and last time I checked we are all aging forward to the land of health issues.
Car mpg is average 24 to 28.
Good is 30, not average
Trucks is 23 mpg which if you live in a real climate (not socal) is often needed it gets lower. Winter fuels often have lower mpg plus idle time to warm vehicle
Then remember most states gas is more expensive
It adds up fast. Not enough to curb spending overall, but to eat some budgets and make that overinflated value house 40 miles from work unappealing
And car pooling factors in how?
Sounds like you bought into the “I need an F250 4×4 platinum edition to get from point A to point B in a few inches of snow” argument they make on ads for $80k trucks with mpg in the teens.
One day you’ll get to use that winch on the many sedans cruising right through it with snow tires.
Chris B:
I have had a 1 ton Chevy Duramax since I bought it new in 2008.
Many told me it was a fools purchase at the time.
Kinda funny… doesn’t stop them from calling me when they have a large purchase needs haulin’, need a trailer or car towed, need to move, etc.
I bought it to work for me….
but the naysayers seem to like the thought of…. Can I use your foolish purchase to help me in my predicament.
Haha… people like to talk a lot of trash…
but then when it comes to brass tacks ?
@HUCK thank you for preventing your friends from having to rent uhaul trucks. That has no doubt saved them several hundred dollars over the years. Hopefully the truck has also served your construction, farm, landscaping, or tow truck business well, and helped you make many times more money than what its cost would have earned had you invested those payments into the stock market instead, and commuted in a sedan to a job where you use the employer’s equipment.
Also, thank you for not complaining about the price of fuel like everybody else who buys a big truck and is apparently shocked when it gets exactly the 15mpg posted on the window sticker and costs three figures to fill up. You seem to know exactly what you were getting into, and getting out of it.
Would you like a 25% discount on your gas bill tomorrow? 100% guaranteed to work.
You currently drive at or slightly above the speed limit. Lets say 75 mph.
Next trip, lower your speed to 55 mph. Just cruise in the right lane with the trucks. Congratulations, your fuel efficiency just went up 25%. A one hour drive now takes 20 minutes longer. That doesn’t work for some folks, but most people don’t do a lot with those 20 minutes anyway. For most people, that extra time does not offset the added fuel costs. Besides, half of you are working/calling or listening to some podcast anyway.
Average price of gas in SoCal this week is about $6.25+
I don’t think wolf is the one making up the numbers haha
Jon
1. data is from the BEA. Read the first paragraph at least.
2. median married-couple income in the US = $120,000 and quite a bit more in California. Meaning, 50% of the married couple households make over $120k a year.
3. We have one car (hybrid) that gets 40-50 mpg. My wife drives it to work every day. so that’s about 15 gallons a month, at $6 = $90 a month = $1,080 a year. I’m on foot, good for a radius of 4 miles (8 miles out and back total) around our place. If it’s farther, I take mass-transit for part of it. So a household with two incomes, some investment income, and SS, pays $1,080 for gas a year.
4. Many people here don’t have a car at all because they don’t need one. For them gasoline = 0% of household income.
5. Lots of people drive EVs, as do you, according to you. Gasoline = 0% of their total income.
The magnitude of personal consumption expenditure for healthcare services is an eye opener. We often think of personal consumption expenditures as discretionary — consumers deciding how much of their income to consume or save. And when prices change, we can adjust our consumption preferences.
However, with healthcare services, we have very little discretion. Healthcare services are mostly paid by third parties and the consumption levels and prices are mostly nondiscretionary. We get sick or injured, but it’s mostly a mostly opaque system of private and public medical insurance that pays healthcare providers a lot of money on our behalf, the prices for which are mostly unseen and mostly decided after the fact. It’s a component of personal consumption expenditure over which “persons” as consumers have little control.
That is why physical exercise, eating healthy and sleeping well save you lots of money down the line.
“However, with healthcare services, we have very little discretion.”
You have plenty of discretion. Just do like myself and follow truck drivers and ignore health problems.
Besides we all know the clankers are going to end the need for jobs and working class humans in a matter of months so we need the human population to die off asap.
The “clankers” are already here, a few dozen of them anyway. The one map I saw showed them operating long-haul truck loads over flyover state freeways.
Around 200 fully driverless heavy-duty trucks operating on commercial routes have been predicted by the end of the year (2026). An outfit called Aurora Innovation is predicted 30,000 driverless trucks by 2030.
Healthcare spending being as much as rent/mortgage is really dragging down the economy. I bet that’s more reflection of older adults. Most people don’t have healthcare or spend $300 to $500 which is much lower than rent/mortgage but still high. However, any care needed quickly skyrockets that price.
Adults with kids can easily be a $1000 to $2000 a month household in care costs. With age it just goes higher until something bad happens and you’re on the hook for a $1.2 million dollar bill.
We desperately need to force these greedy healthcare companies to make less money via competition.
Mangione?
Call me crazy but looks like FRED adjusted the personal saving rate up for the entire year! We were hovering in the mid 2s for a while now it’s all higher after latest update…. What gives?
FRED doesn’t do anything. FRED is a database that captures the data released by others. This data here and the savings rate, etc. were released by the BEA.
Yeah, sorry you’re disappointed that the consumer isn’t collapsing.
Is this COVID excess still? Debt funded? Where is all the money coming from? Is it all just the boomers spending their massive capital gains?
Those 3% annual raises aren’t doing much for many of us white collar, non- healthcare workers
Peak spending on everything is 47 years old in America, so we got a LOT more millennials and Gen Z turning 47 until the year 2053, before it turns down again for Generation alpha – so this is going to go up up up for a while!
Income-funded, and they saved the rest. People are making lots of money. The median married-couple household income in the US is $120k. It’s a lot higher in California and other expensive states, and lower in cheap states. This idiotic BS that most people live from paycheck to paycheck and are tapped out or whatever gives people brainfog and they cannot understand where “all this money is coming from.”
If you’ve read my articles here about consumers for the past five years, there would be no doubt in your mind where all this money is coming from: income.
I would go a little father and perhaps state it is coming from “dual income”. But that’s just me.
Dual income was a great achievement. It was accomplished by women that were entering adulthood when I was born. By the time I entered adulthood, ALL women I knew aspired to a career regardless of marriage status or kids. Boomer women were the first generation that expected to be free to work in a career all their lives and retire on their own retirement plan. That was a HUGE achievement.
And then of course, that money gets spent. That’s what money is for.
It’s coming from the federal deficit. The more than $2 trillion a year in extra federal spending always trickles down into consumers’ salaries. The military spends more, and military contractors like Boeing and Lockheed Martin can pay higher bonuses.
Aid to schools means that schools can hire more people. And then there’s health care spending. If the U.S. even remotely attempted to balance the federal budget, the economy would collapse.
This.
Nonsense. Only a small portion of the $2.2 trillion a year deficit goes to consumers. And the deficit has NOT grown. But we’re talking about GROWTH here. The Deficit has been about $2.2 trillion roughly for four years.
But consumers SPENT $22 trillion in a 12-month period. And that HAS grown by 6% in 12 months.
Well, yes and no, Wolf. The $2T deficit is a direct result of lower taxes. Those lower taxes enable people to spend more. The TCJA and OBBBA have contributed to the deficit both at times when the economy was already warm and contributed to peoples discretionary income. We’re surprised by inflation and consumer spending when the writing was on the wall well before it happened?
Most of the benefits of the tax cuts went to rich people and companies. That’s not going to help consumer spending one ijota. Some of the benefits went to people with tight incomes, including some on Social Security, that might increase their spending and that might help a little… probably not even a rounding error in consumer spending that grew by $1.3 TRILLION yoy to $22 trillion. You gotta keep a send of proportion.
Wolf would you agree that healthcare has been one of the hottest fields in hiring the past six years? Would you also agree that 50% of every dollar spent in healthcare comes from the government? Then i’d argue that a great deal of those 2 trillion dollars in red spending the past six years have had a lot to do with the job market!
You’re twisting things around.
1. agreed, healthcare has been a vibrant sector.
2. nonsense. Medicare is self-funded via contributions, so the government is just a conduit, and the money comes from workers and companies (payroll taxes) and retirees (Medicare premiums). Medicaid comes out of the budget. It totaled $670 billion in 2025. That’s a drop in the bucket of overall healthcare spending.
I’ll pretend you aren’t deflecting. Why no mention of Medicaid? Which tax pays for that or is it just completely non funded except via debt?
Mr. House,
🤣 My comment is so short, and you still couldn’t make yourself read it??? But had to argue with it without reading it???
EXACTLY!!!
Why anyone who thinks otherwise based on SO many recent reports is a mystery to this old, actually elderly person…
”HEDGE” accordingly is an attractive ”meme.”
What that means, these days, is also a mystery as many will find out, probably including all on here..
Good Luck and God Bless all y’all AKA ALL of us, eh!
The increase in the federal deficit is primarily being used to service the debt, not to pay Boeing and teachers. Debt servicing reduces liquidity in the economy.
Dan, first, the debt service is about 50% of the deficit, so there’s still a lot left. But second, where do you think those interest payments go? They go to t-bill holders, direct or indirect, who then have more income.
@Tsonder
And the interesting thing i’ve been pondering lately is how many of those Tbills are held by large corporations? Free money in the short term, might persuade you to not make some layoffs if you can afford some plebs yearly salary by putting a billion in four week tbills.
If this is true the real mechanism is just that taxes are not as high as they need to be, and if they were high enough to balance the deficit, people would have a little less disposable income. Nothing else sinister about it.
Interesting statement here, which Wolf did not address or try to negate – “If the U.S. even remotely attempted to balance the federal budget, the economy would collapse.”.
I believe this is likely true, which would mean two things: we are living on borrowed money, and more importantly, borrowed time. This is why we see Treasury yields rising.
I addressed this eloquently with the first word of my comment: “Nonsense.”
Hi Wolf, how much of this growth is due to the decline in savings rates? Or does that not matter? If the drop in savings increases available budget by 300-400 billion, that party will end eventually, right? So this inflation can’t last forever. We will have stagflation soon?
They’re still earning more than they’re spending. In August they saved 4.1% of their income.
the savings rate is just the difference between income and spending divided by income. But it doesn’t measure income from capital gains, for example.
Where does this stupid stagflation BS keep coming from?
Running hot is yield. There has normally been some bond buying overnight then premarket bonds start to sell off. Tonight yields are spiking
ten at 5.34
20 at 5.73
30 at 5.68
what do you think Bessent or Warsh can do to stop the bleeding? This sell off is relentless
“Oil prices rise as Chinese refiners reportedly ban October fuel exports; Brent back above $100”
No doubt what caused that yield spike
How does Bessent fix that?
Umm…. I don’t see any bleeding. I see a Treasury market adjusting to supply and demand. Trillions more in supply. Demand lessened from: foreign buyers, basis trade, hedge funds, etc. Thus rising interest rates.
The buyers are already coming out at those yields. Already happening right now. 5.30% was the trigger. 10-year now down 8 basis points.
I said here on Monday that the market would take a breather to digest the move. That didn’t happen until today. But now it’s happening.
Wolf:
“Where does this stupid stagflation BS keep coming from?”
I think you know where it comes from. It comes from main stream media hype, and internet click bait.
It seems that, for whatever reason, people enjoy hearing and reading that all is doomed, Rather than enjoy the good times that currently exist.
It is obvious to me why sex sells, but not as obvious to me why doom and gloom sells.
People are strange creatures.
There is a huge population of internet commenters who have been persuaded, by the internet, to sit in cash, bank CDs, MM funds, and gold coins.
They have been waiting years or decades to be proven right. They have missed the opportunity to get rich or retire, as their peers are doing. Changing course would involve admitting they were wrong, which would be too painful. Meanwhile the internet algos keep delivering information to them saying they’re on the verge of being proven right.
It’s basically a trap comprised of denial psychology and online information bubbles.
The stagflation argument is that an oil crisis must lead to stagflation, as it did in the 70s.
The argument is a bit dumb because the economies are different; oil’s contribution to our overall energy budget is smaller; and there would be a glut if the Gulf exports were returned to pre-Iran War levels and UKR stopped blowing up Russian refineries.
ChatGPT?
A bit off the subject. There is large divergence between the HYG and SPX since the beginning of the year. And and in the last month the ROC in that divergence has accelerated. I did a quick look back and every acceleration like this was accompanied or followed with a decent drop in the SPX. We know that there is a maturity wall coming up where a lot debt termed out at once in a lifetime low rates during COVD needs to be rolled over at much higher rates. The current war is not helping things. I’m wondering even if the war gets resolved, will rates remain elevated to the point that it will have a significant enough impact in 2027-2030, when all this debt has to be rolled. Or is this just another one of those “headlines” that gets attention, but the market just rolls on without missing a beat.
The maturity wall began last year (5 years after onset of COVID). It will likely cause “friction” through 2027, The total of commercial mortgage debt that has to be repaid is on the order of $2 Trillion. Nearly all of the projects make no economic sense at today’s rates. Anticipate an end to the “pretend and extend”. We should see some recessionary impact, but it might be masked by all tha A/I BS.
If you think your currency will be worth less every year in future why not spend it now?
And what you don’t spend just invest in gold.
Gold has plunged by $1,200 an oz, or by 25%, over the past 7 months or so. And it does not pay any kind of interest or dividend. Gold makes a lot of sense if you buy low. But if you buy high, including now, you might have to wait decades for it to catch up with inflation. Buy low, sell high rules, even with gold.
I exited my briefly held gold position a few months ago, scared out by the sudden upswing and media coverage. $4,000 seems like a good re-entry point.
$20 is a much better entry point.
Buy low… sell high….
But where is low and high ?
Like the tootsie roll tootsie pop owl said….
The world may never know !! Haha
“As long as there is plenty of demand for US debt and equities, which is the case, the US does not have a ‘payments’ problem. It can finance its trade deficits easily. A signal of a payments problem would be if US borrowing costs rose dramatically.”~ I saved this from some wise person from the beginning of the year. Wisdom re shared
You quoted this out of context. Yields are up only 1 percentage point since then, and are only back to where they had been before QE. They’re not at 15-18% like they were during the last crisis (1980s).
“And all at once, summer collapsed into fall”~ Oscar Wilde. “And bull markets in credit expansion collapsed into bear markets” ~
its about debt to GDP ratio now compared to low debt to GDP ratio during the high yield years and running a 6% budget deficit for years during bull markets when the 50-year average budget deficit was 3.8%. Buyers came in today about 2X the 200-month simple moving average as i discussed a few days ago at 5.332% as the line in the sand a close above for more than 3 days will create panic like circuit breakers going off, as buyers in $tnx get exhausted or if tomorrow the unemployment rate comes in tenth or .2% lower than the prior month, this freight train in yield breakout will gain momentum. The lie that with more debt we can grow our way-out of a debt crisis is just a lie to create more billionaires. this global rising yield will pop the credit bubble; most global wealth is a byproduct of credit bubble expansion. maybe the repo market goes to 30 trillion to keep the train going as time goes on, but this looks the like right time for a collapse, like summer into fall
“ The big driver was gasoline due to the price spike. If the price spikes are taken into account, “real” spending on gasoline (adjusted for price changes of gasoline) declined month-to-month and year-over-year.”
Is this a way that we can see demand decrease in real time? Another clear way would be to look at just total gallons of gasoline sold.
I cover this on an annual basis, at the beginning of March when the annual data is finished. The month-to-month data is too rough to waste my breath on it.
There is lots of important stuff in my energy articles, and it’s really important to read them to understand the US economy.
This is through 2025, barrels per day:
https://wolfstreet.com/2026/03/04/u-s-gasoline-demand-fell-further-amid-long-term-structural-shift-plunging-per-capita-consumption/
And per capita, in gallons:
Plus efficiency of ICE vehicles:
Yeah, the US economy SHOULD be running hot with the Federal government running serial deficits in the 6% range, eh?
That’s a lot of pressure on resource availability, including labour.
The annual cost of Heathcare is the main problem at around $16k per person is the main component in causing increased consumer spending and this is now starting to rise exponentially due to the ” Healthcare Parodox ”
Americans are living longer but not neccessarily living healthier due to the medications they are taking keeping them ticking along.
This is coming at an increasing cost however and healthcare robots and AI adoption will add to this cost it is thought so no quick answer .
So expect higher consumer spending at an increased rate as the chart shows
Plus that goverment 1% on the value of your house every year adds another $4k so if house prices keep rising consumer spending does too.
The effect being increasing consumer spending is signalling a booming or “hot” economy, which drives bond yields higher as demand for capital increases , increasing inflation and increasing interest rates .
In the long run this is not a good look and not very good in the short term either at some point drastic actions will be needed .
interesting household furnishings was only $50B less than the RVs in 2015 but now? quadruple that to $220B. This has to be the wealth effect of the top 10%ers. their portfolios keep growing more and more, so why not buy a skidoo, an ATV, a yacht… 2 yachts!
Yachts are like just burning money. My old mentor had to have a crew of 13 people. I’ll stick to cars.
Yachts are only fun at the dock. Party food drinks and then just disembark.
It only took the bond market 2 years.
Question is: did they finally wake up, or have they just latched on to another ‘transitory’ bogeyman(Iran)?
The road goes on forever, the party never ends.
Remember when Jerome Powell loudly and proudly proclaimed that “inflation is transitory” and that “we’re going to let it run hot?” And then, with egg on his face, began massive rate hikes of 50 and 75 basis points to try to cover his ass after inflation was not transitory, and was ripping through the entire economy? And then he started talking about “soft landings” and stuff, and cutting rates?
And here we are, YEARS later, and the economy is STILL running hot and inflation is still ripping through household balance sheets. How can Jerome Powell even look in the mirror. There was never even a “landing.” JP will go down as THE WORST Fed chair of all time, hands down.
Well, the “investigation” of the FED remodel is over with a whimper so JP can crawl off back to Wall St.
That credit goes to the Nobel Laureate Ben Bernanke.
Yeah. That guy. There is nothing to worry about – This was more or less said in 2007ish. And in 2010ish it was heard, Wow we thought self regulation worked, huh. Never thunk of it. Our bad.
I remember well. Easiest money I ever made was going against Powell’s statements as it was pretty obvious inflation was going to be an issue as the FED was buying trillions in Treasuries.
Kind of amazing really that someone with that much power would telegraph their [wrong] move so deliberately. Everyone that realized it was just eyeing the profits to be made.
JPow’s job was to be a scapegoat for the politicians who nominated and re-nominated him.
JPow didn’t cause the inflation. He was only one of 12 voting members on the FOMC, and had nothing to do with Congress and 2 presidents passing multi-trillions of dollars worth of stimulus – all borrowed and printed money.
But you took the bait, and so instead of attributing the inflation to your political leaders, you scapegoated a bureaucrat, who played his role beautifully and became widely hated. That’s exactly what the politicians wanted you to do.
Are you always this stupid, or just today?
OK, so yea, let’s just decide to believe this one scheming guy is individually responsible for inflation going to 8% in 2021-22. It was all part of his nefarious plot to pay more for socks or something, and to be viewed as a failure at the peak of his career.
The stimulus packages, the tax cuts, the massive increase in money supply, the actual shortages… none of that economic stuff had any effect at all.
It was this one scheming, nefarious guy. And there was nothing our heroic politicians could do to stop him, nothing even, the 11 other voting members of the FOMC could do to block his plot to raise the price of chicken nuggets and concrete.
They tried everything they could do to bring down prices, such as mailing people stimmie checks, passing infrastructure bills, passing tax cuts, and giving out hundreds of billions in loans to fly-by-night LLCs, but it wasn’t enough. The evil JPow erased all their votes and pushed the inflation button, negating their efforts.
Now that I’ve recited (and I think clarified) the internet consensus, am I smart yet?
Running hot on inflation but not quite so hot on gdp correct?
2% gdp kinda average growth and not enough to outrun all the debt as they’ve promised lol
GDP was driven down by HUGE imports of tech equipment for the data centers.
A purer measure of domestic demand that is also part of the GDP data, “Real Final Sales to Private Domestic Purchasers” jumped by 3.9% adjusted for inflation, which is very strong (green column). That is GDP without imports & exports, without government spending, and without change in private inventories.
Apparently the US will have moved 3 aircraft carriers into the Middle East by late November. That suggests the war with Iran resumes with gusto shortly after the midterm election.
Maybe this is what’s driving up bond yields. The market knows we’re in a forever war that will involve taking on tens of trillions more in debt compared to current baseline projections.
Even if the Democrats take the House and or Senate, they are not sworn in January, so Trump has 2 months to do as he pleases.
I’ve been wondering about this for a while now. Despite rising fuel costs and other economic constraints, consumer spending on goods and services continues to be robust. Anecdotal articles on slowdowns in home improvement and DIY projects as reported by the big box home improvement centers appears to offset by spending in other areas. The spending in recreational goods such as RVs appears is unexpected considering how much the cost of fuel has risen. Having owned 3 RVs in the past, I know a little bit about these things. As for durable goods and services, I am not so surprised. Many people, like me, are staying home to counter the effects of fuel costs and rising prices at restaurants. So, we are spending more on furniture, appliances and other items that make staying at home both more comfortable and desirable. Cheers.
Is the government dole get bigger or just personal debt to fund all the spending?
The spending is funded by big increases in incomes that consumers earn.
In terms of debt, neither. But corporate debt is ballooning, largely to fund the AI investment mania. consumer debts are modest:
https://wolfstreet.com/2026/08/11/household-debts-debt-to-income-ratio-delinquencies-foreclosures-collections-bankruptcies-in-q2-2026/
The daughter of a friend works for a large food and liquor wholesaler that supplies hotels and restaurants in the Coachella Valley (Palm Springs/Palm Desert area). According to her, orders for food and liquor were 20% off this summer compared to last year. Granted it’s a small sample size, but this is a relatively wealthy destination resort area, and spending is off enough to notice. It will be interesting to see what the local economy looks like once tourist season gets going around T Day.