
In 9 cities, from Oakland to Jacksonville, condo prices fell by over 20%. In 3 markets in California & Florida, they fell by 30%+.
By Wolf Richter for WOLF STREET.
In 33 bigger markets, prices of mid-tier condos through July have dropped by 15% to 33% from their respective peaks in prior years. These peaks occurred from 2021 to 2024, with the vast majority occurring in mid-2022. These 33 bigger markets that broke under their own weight are depicted in the charts below.
In nine of them – from Oakland to Jacksonville – prices of mid-tier condos dropped by 21% and more; in three of them by over 30%. These are substantial price declines over a multiyear period.
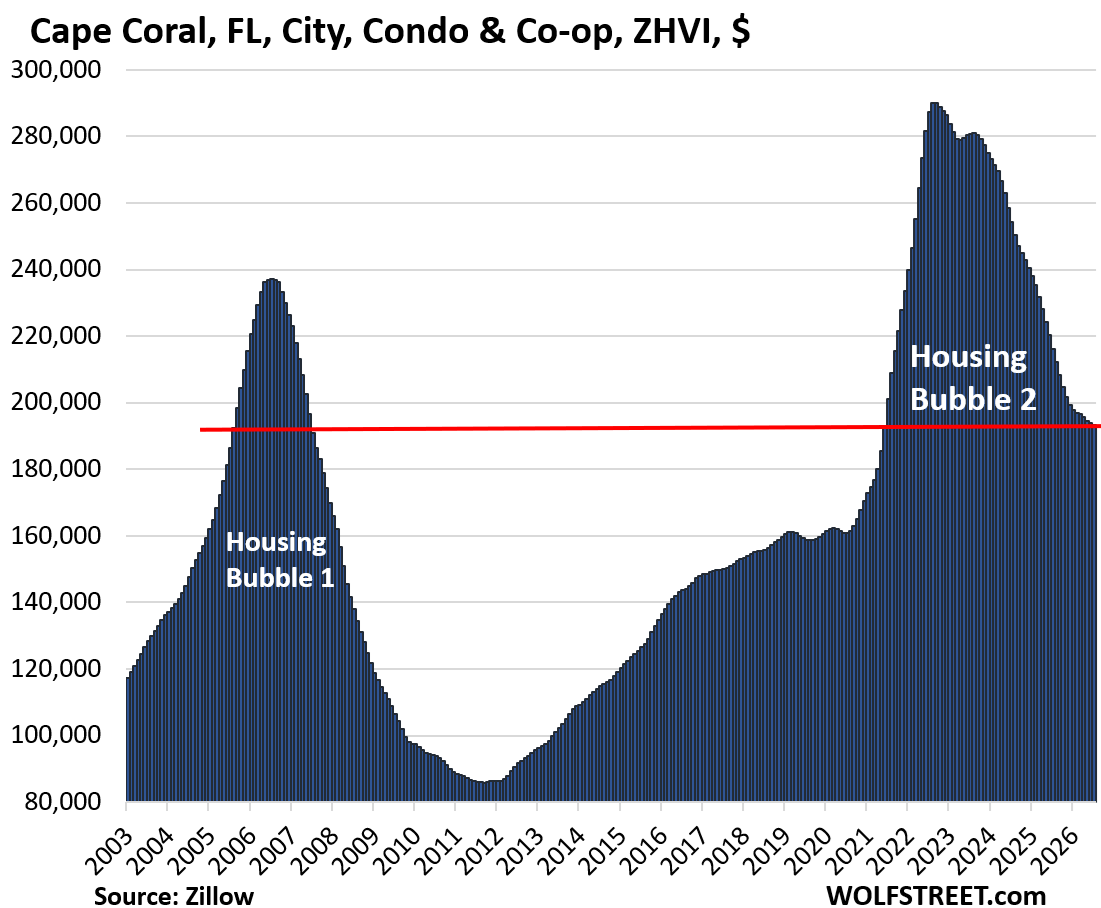
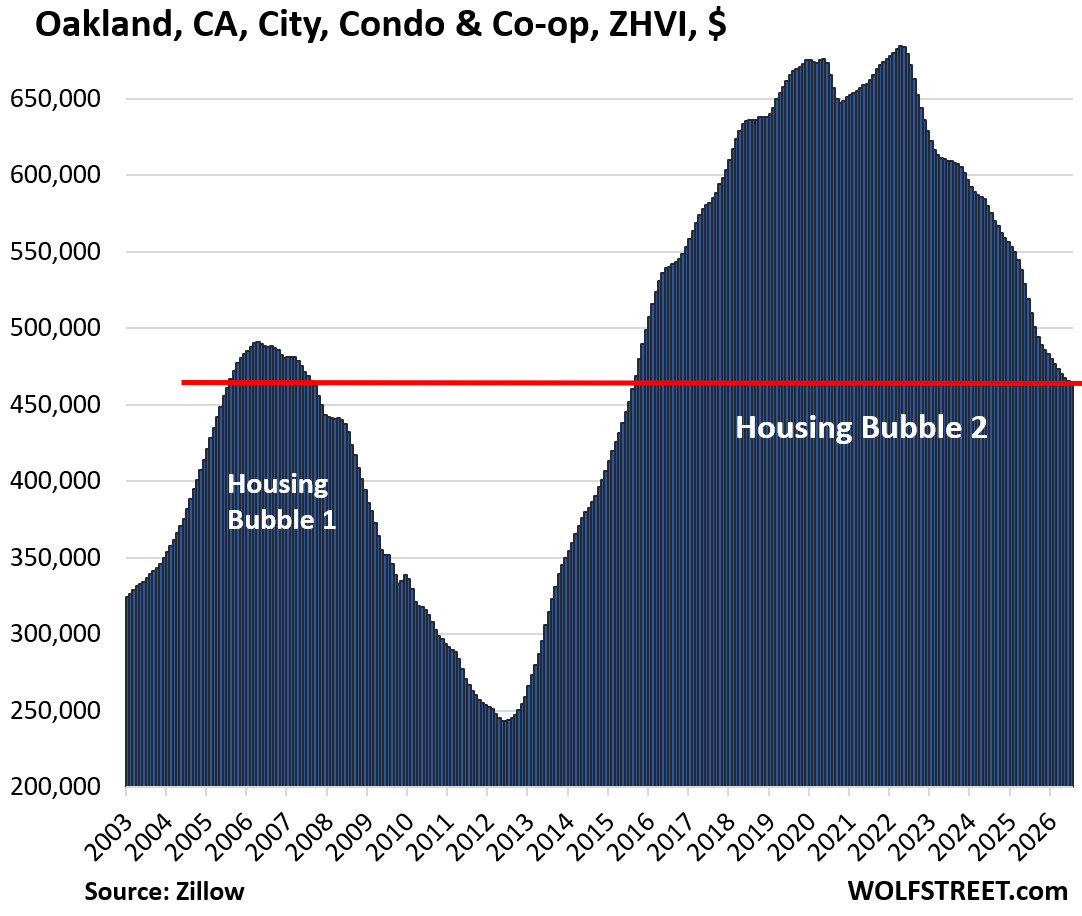
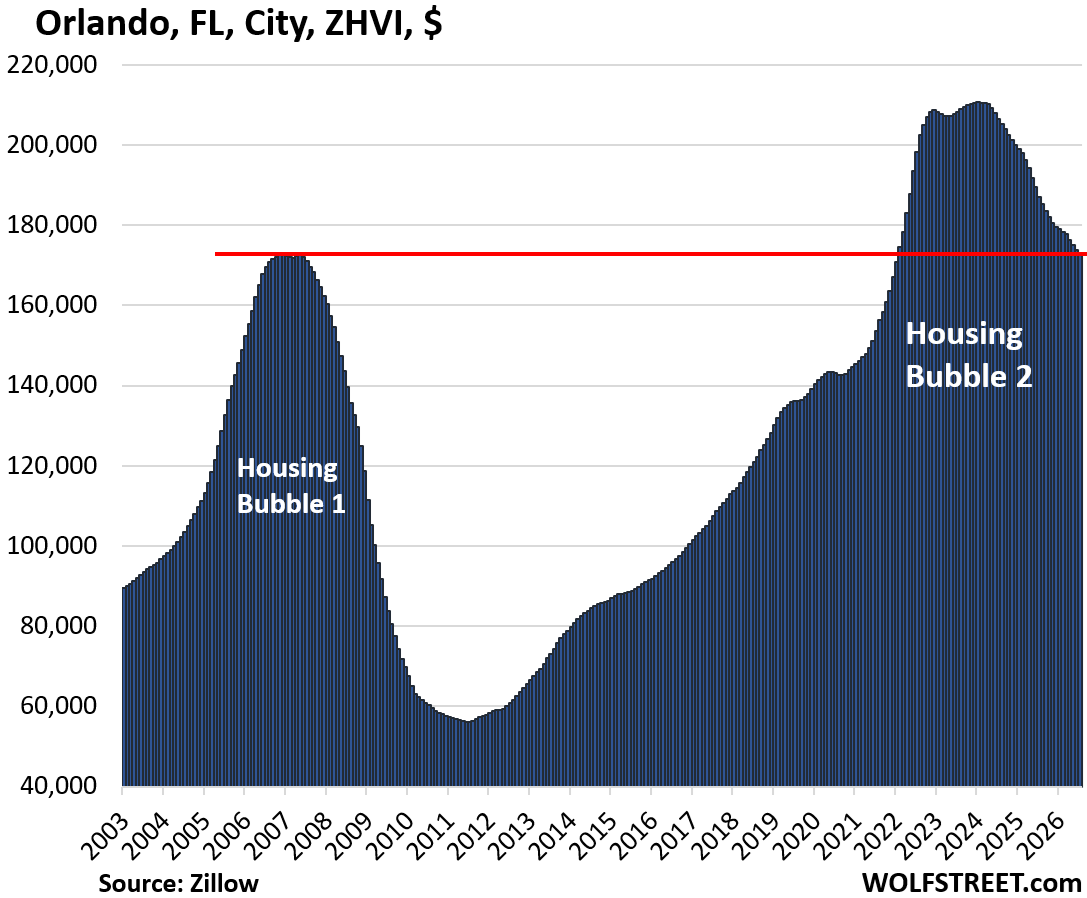
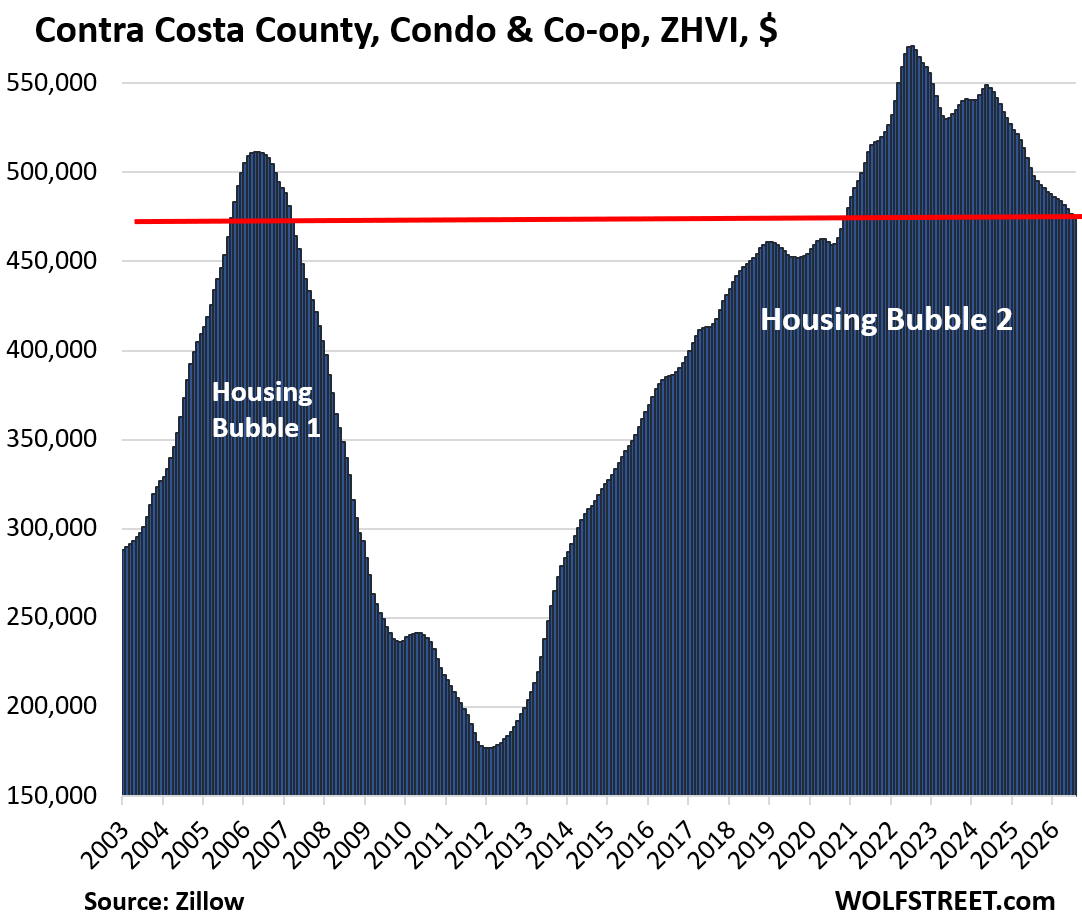
In six of these 33 markets, condo prices have already dropped below their Housing Bubble 1 peaks of 2006 and are back where they’d been 20 years ago. See the red line in those charts going from the current value straight across to 2005. Those are spooky charts.
- Oakland, CA;
- Sarasota County, FL;
- Cape Coral, FL;
- Contra Costa County (East Bay), CA;
- Fort Myers, FL;
- Orlando, FL.
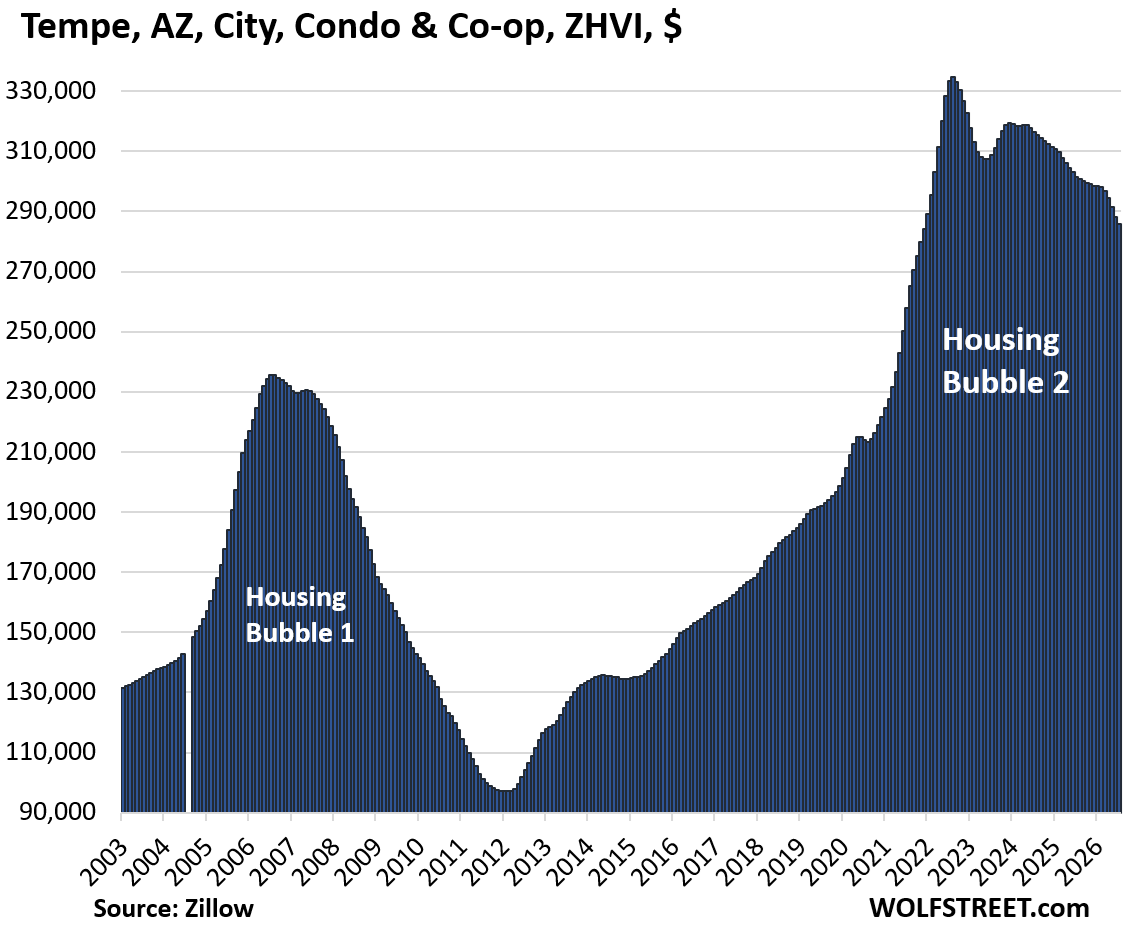
Two cities moved up into this line-up of 33 markets in July as their condo prices dropped further and pushed them over the -15% line: Houston, TX, and Tempe, AZ. No market that was on the list in June came off the list in July.
In another 37 bigger cities, condo prices have dropped by 8% to 14%. While they don’t have their own chart, they are listed in a table below the charts.
There are also many smaller markets where condo prices have dropped just as much or more, but that are not included here because the markets are too small.
Condos are subject to different dynamics than single-family homes – dynamics that fuel eye-watering booms and massive busts – see the discussion of those dynamics below the charts.
Part of the issue now is the breath-taking two-year price explosion from mid-2020 to mid-2022, which reached 50%, 60%, or even 70% in some cities, that came on top of already high and soaring prices. In the 10 years to the peak, prices had soared by 180% to 350% in these markets. We’re looking at the charts below and are shaking our heads. What were these people thinking, we’re thinking with hindsight.
And these massive condo bubbles have started to deflate relentlessly and some brutally.
Most of the markets here are “cities.” But the list of 33 markets where prices declined by 15% or more includes a few counties where the cities – though household names – are too small to be included individually; and New York County, which is Manhattan where condos are a huge part of the market. It includes one metropolitan statistical area that groups together several smaller cities.
In some densely populated big cities, condos and co-ops make up a big part or the majority of home sales. In most other markets, condos are a relatively small portion of home sales.
Methodology and data: These prices here are seasonally adjusted three-month averages of “mid-tier” condos and co-ops from the Zillow Home Value Index (ZHVI), which is backward-looking index, based on millions of data points in Zillow’s “Database of All Homes,” including from public records (tax data), MLS, brokerages, local Realtor Associations, real-estate agents, and households across the US. It includes pricing data for off-market deals and for-sale-by-owner deals.
Historic Condo Bubbles deflate in 33 charts.
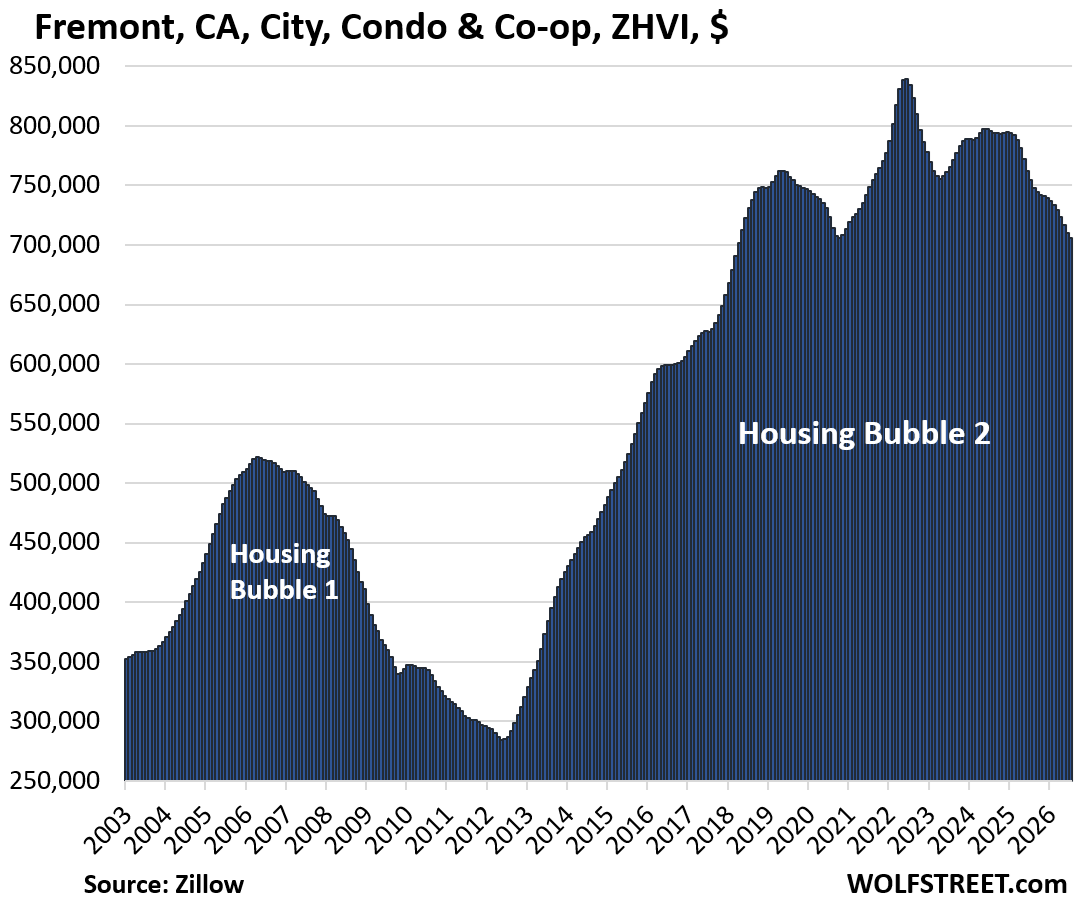
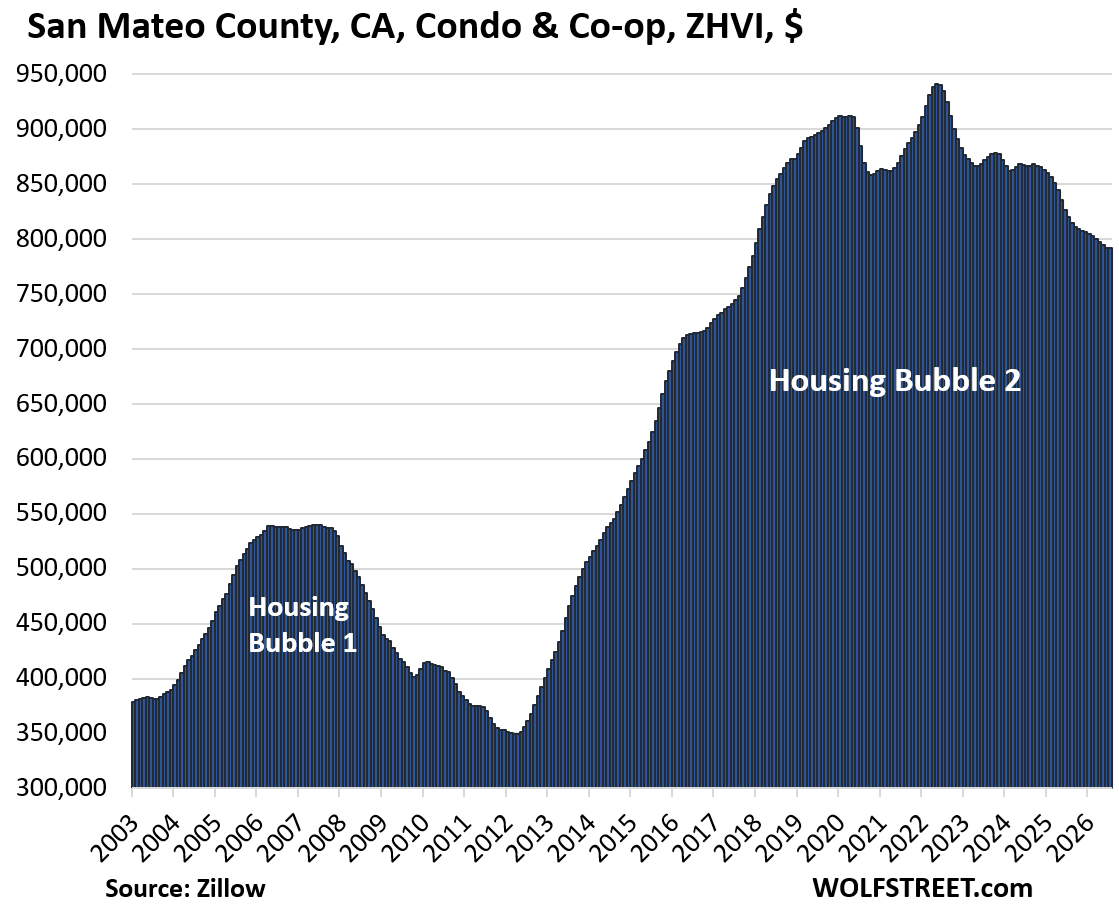
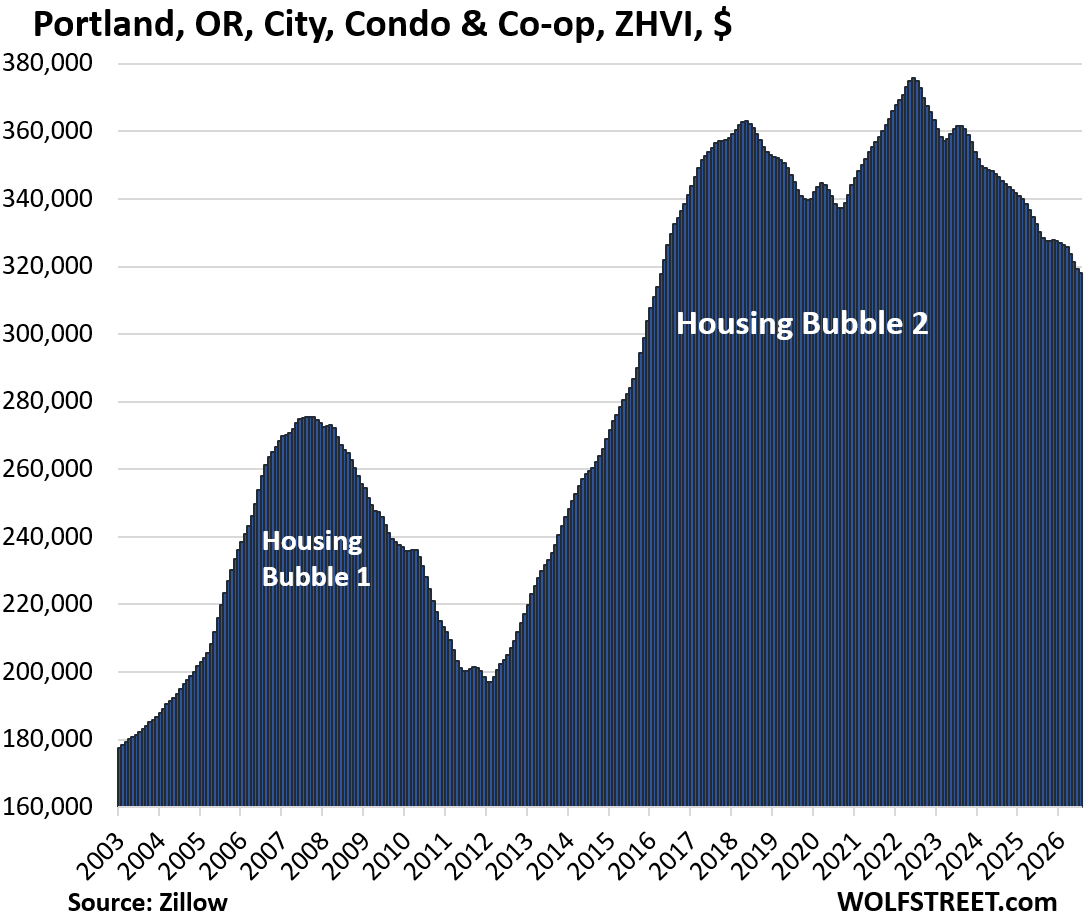
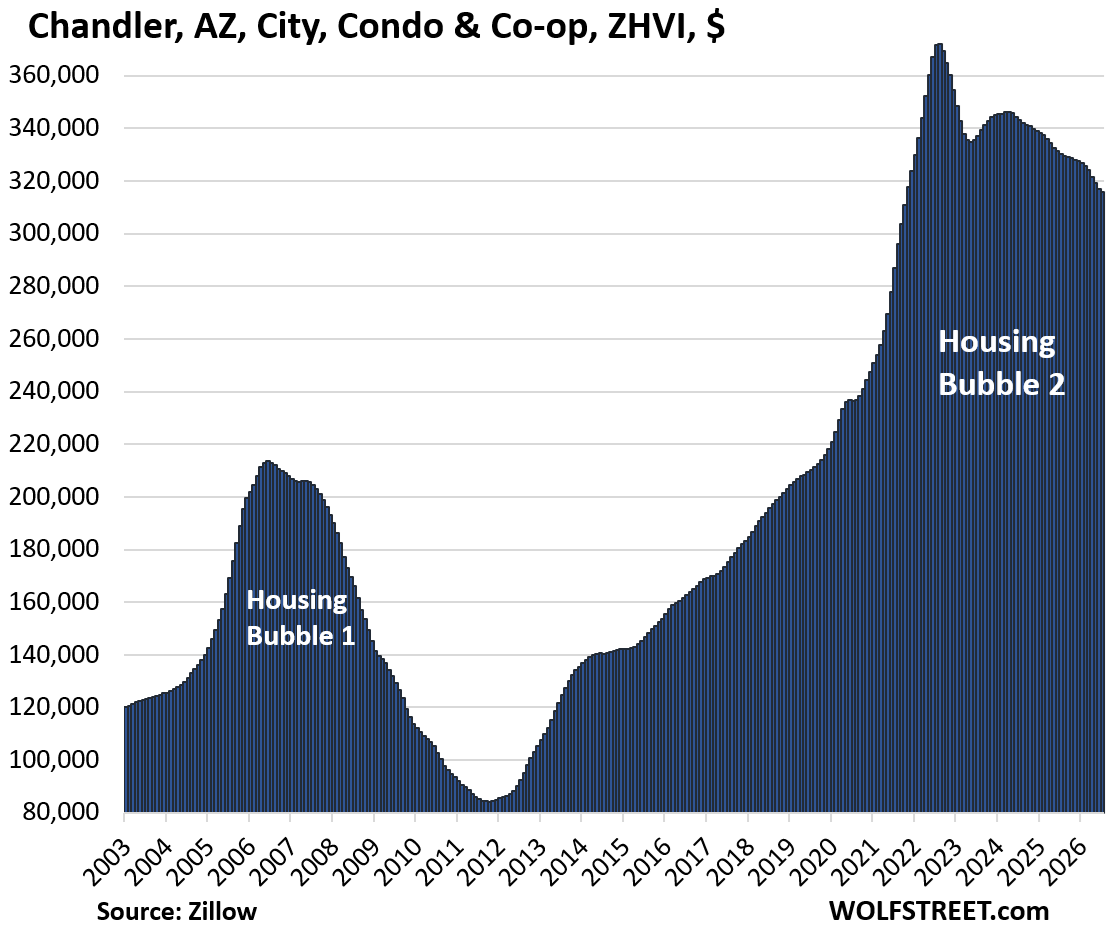
The tables for each market below show from left to right: price decline from the peak, change from prior month (MoM), change year-over-year (YoY), and remaining increase since January 2000.
| Cape Coral, FL, Condo Prices | |||
| From July 2022 peak | MoM | YoY | Since 2000 |
| -33% | -0.3% | -10.6% | 127% |
Prices of mid-tier condos are back to mid-2005. That was 21 years ago.
| Oakland, CA, City, Condo Home Prices | |||
| From May 2022 peak | MoM | YoY | Since 2000 |
| -32% | -0.1% | -8.7% | 138% |
Prices are back to where they’d fist been in 2005, but are still very high after the huge run-up in the years before 2022.
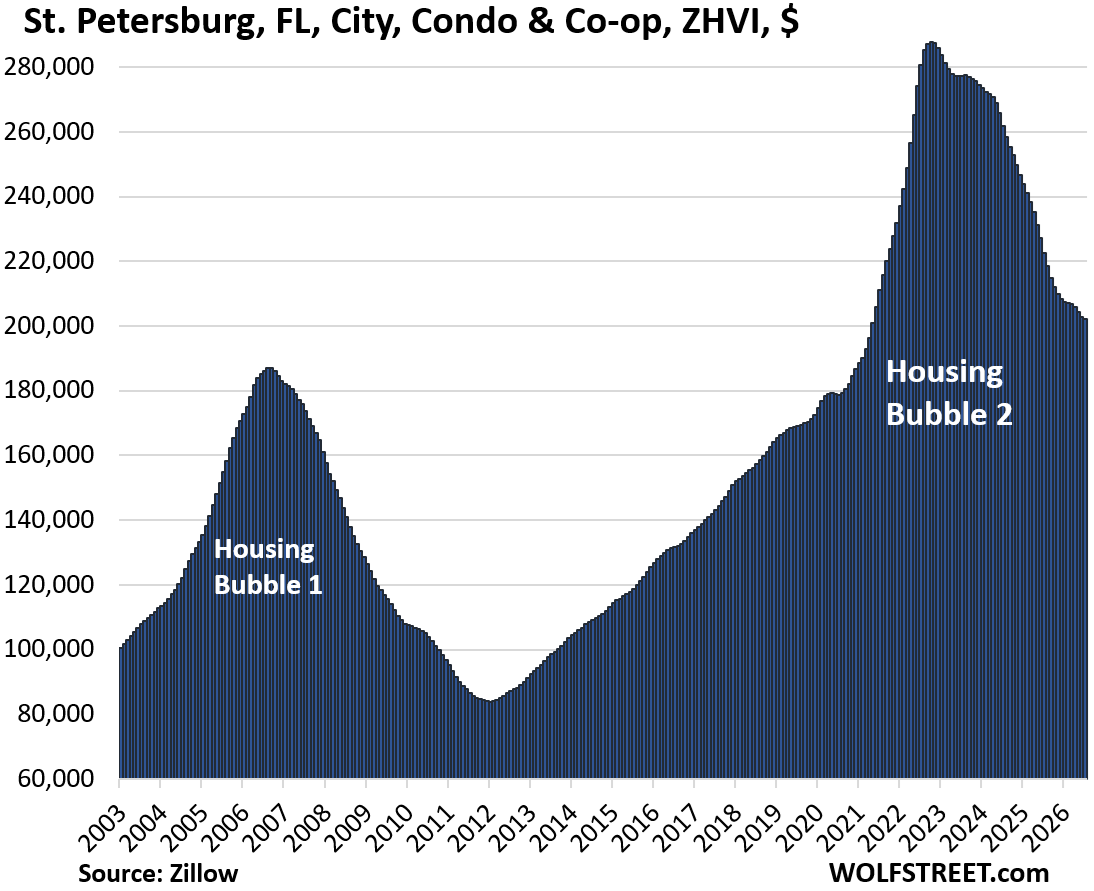
| St. Petersburg, Fl, City, Condo Prices | |||
| From Oct 2022 peak | MoM | YoY | Since 2000 |
| -30% | -0.3% | -9.2% | 176% |
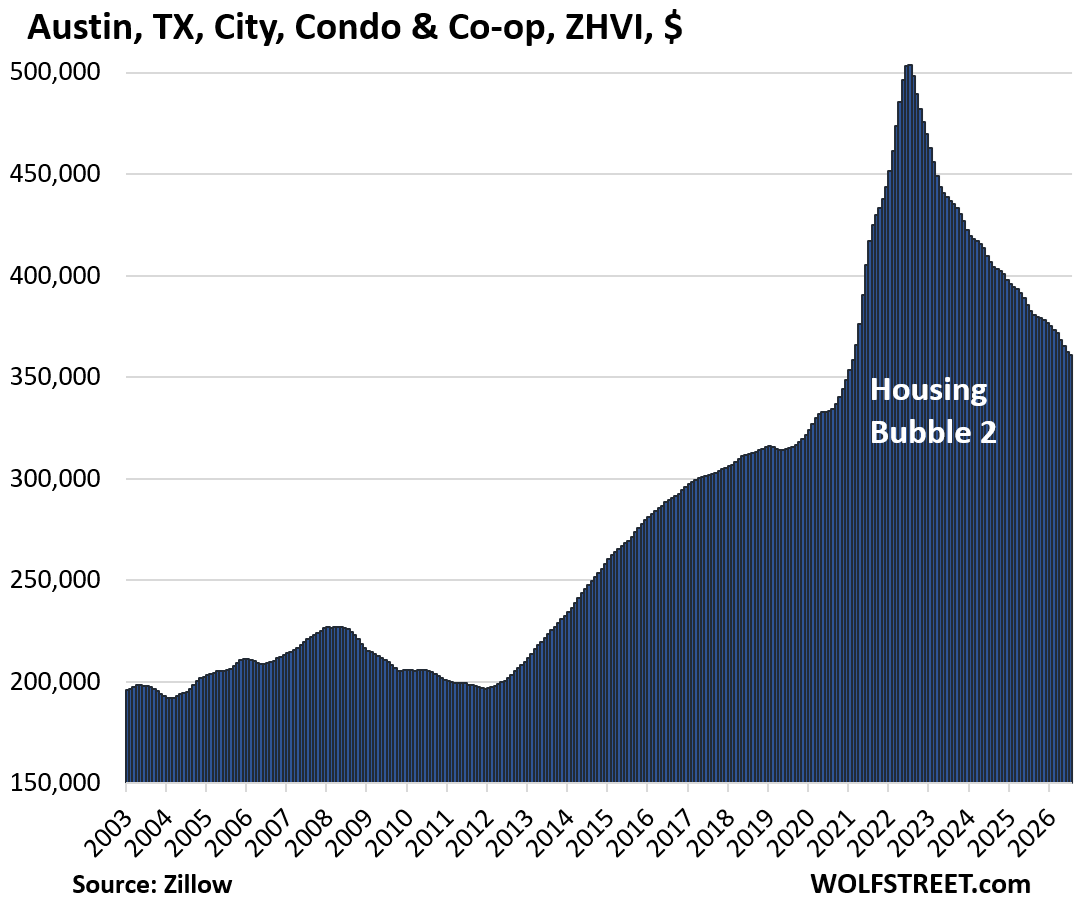
| Austin, TX, City, Condo Prices | |||
| From Jul 2022 peak | MoM | YoY | Since 2000 |
| -28% | -0.4% | -5.7% | 102% |
| Fort Myers, FL, City, Condo Prices | |||
| From July 2022 peak | MoM | YoY | Since 2000 |
| -27% | -0.5% | -10% | 118% |
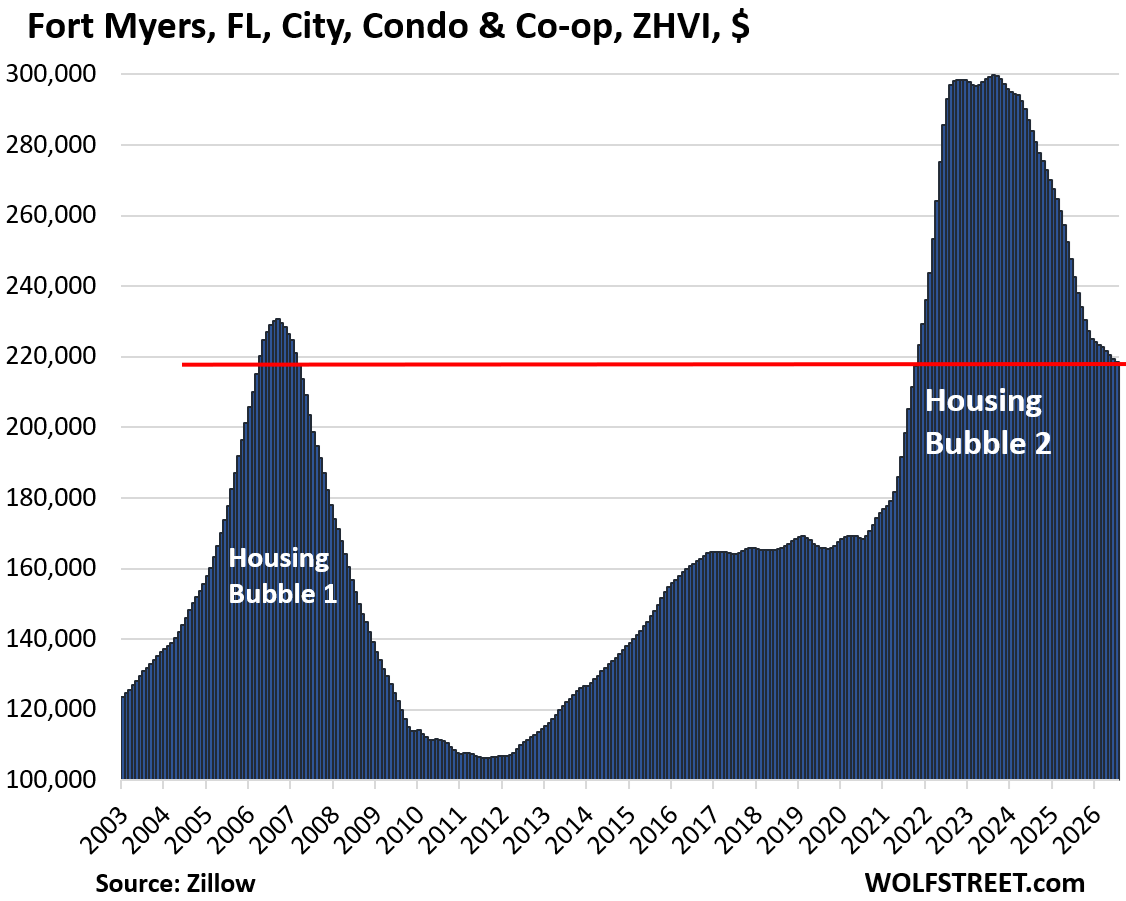
| Sarasota County, FL, Condo & Co-ops Prices | |||
| From Jun 2022 peak | MoM | YoY | Since 2000 |
| -24% | 0% | -6.3% | 129% |
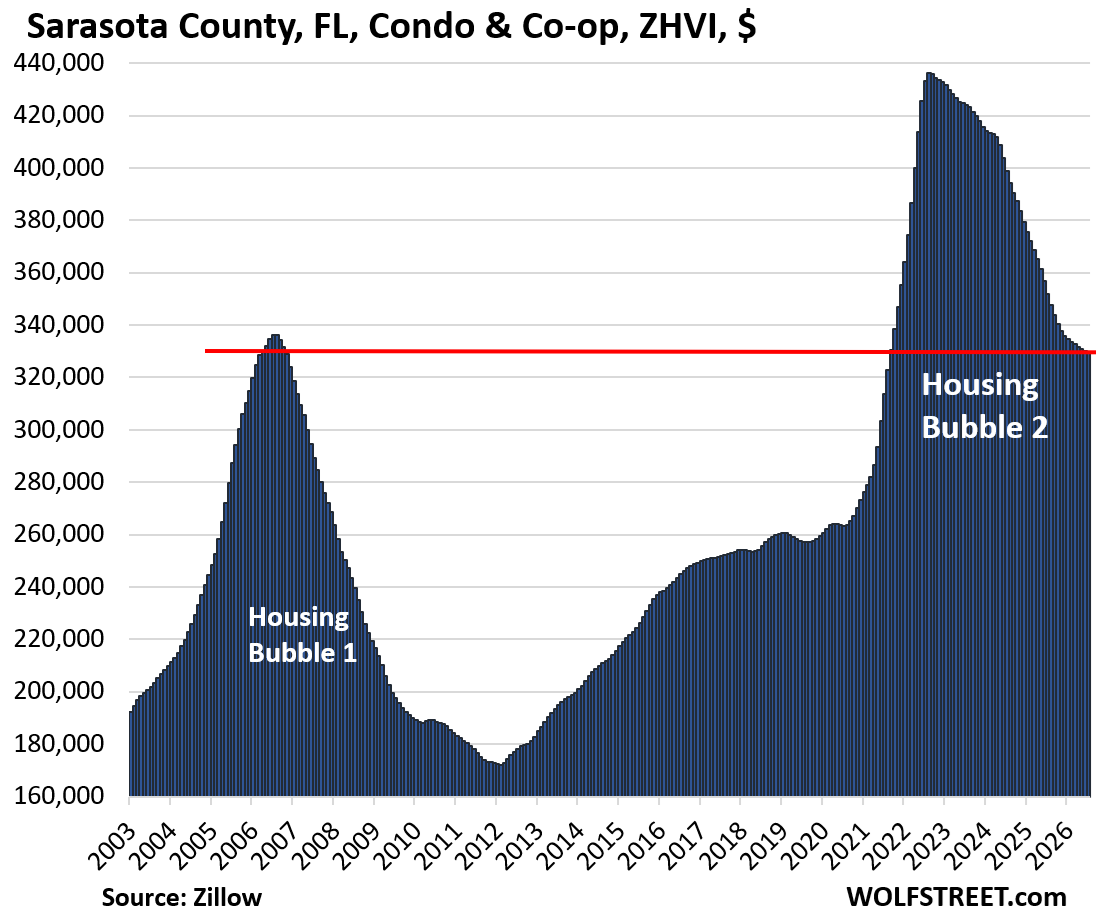

| Garland, TX, City, Condo Prices | |||
| From July 2022 peak | MoM | YoY | Since 2000 |
| -22% | -0.9% | -12.0% | 201% |
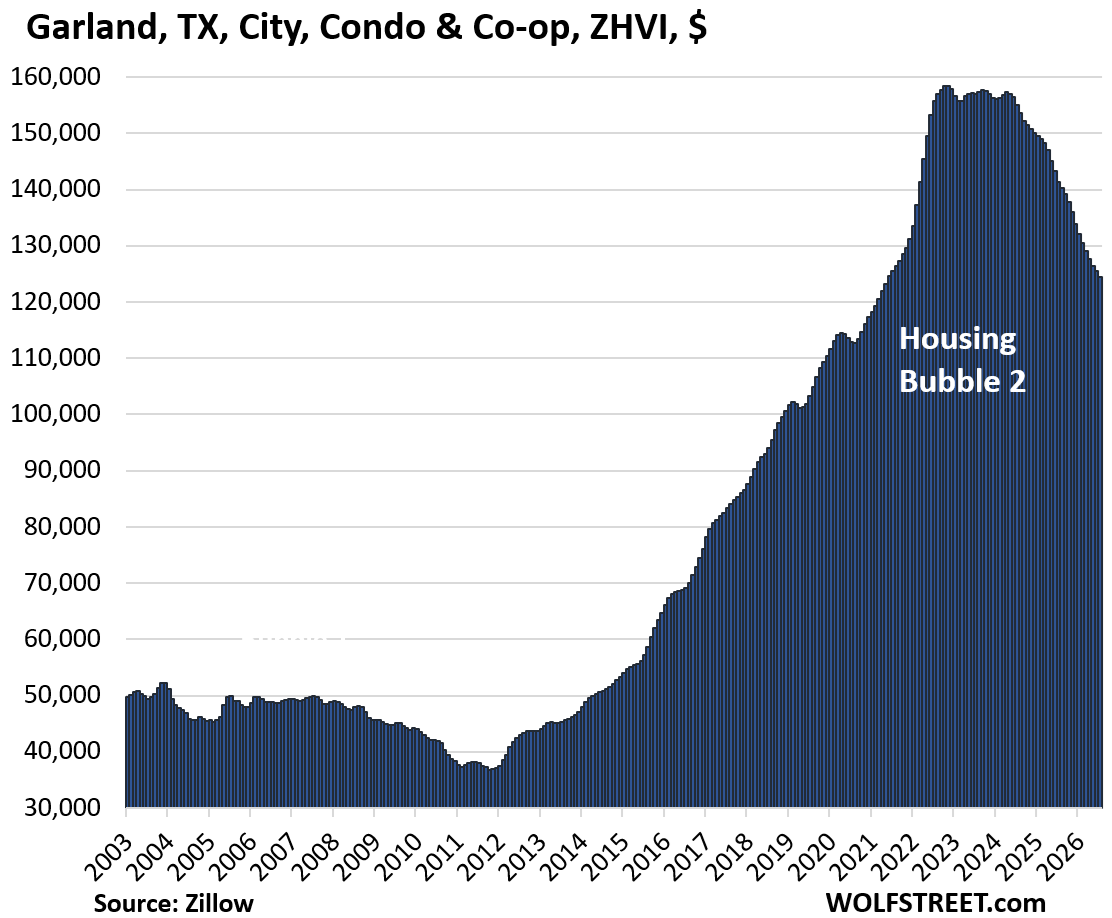
| Tampa, FL, City, Condo Prices | |||
| From Sep 2022 peak | MoM | YoY | Since 2000 |
| -21% | -0.5% | -8.3% | 244% |
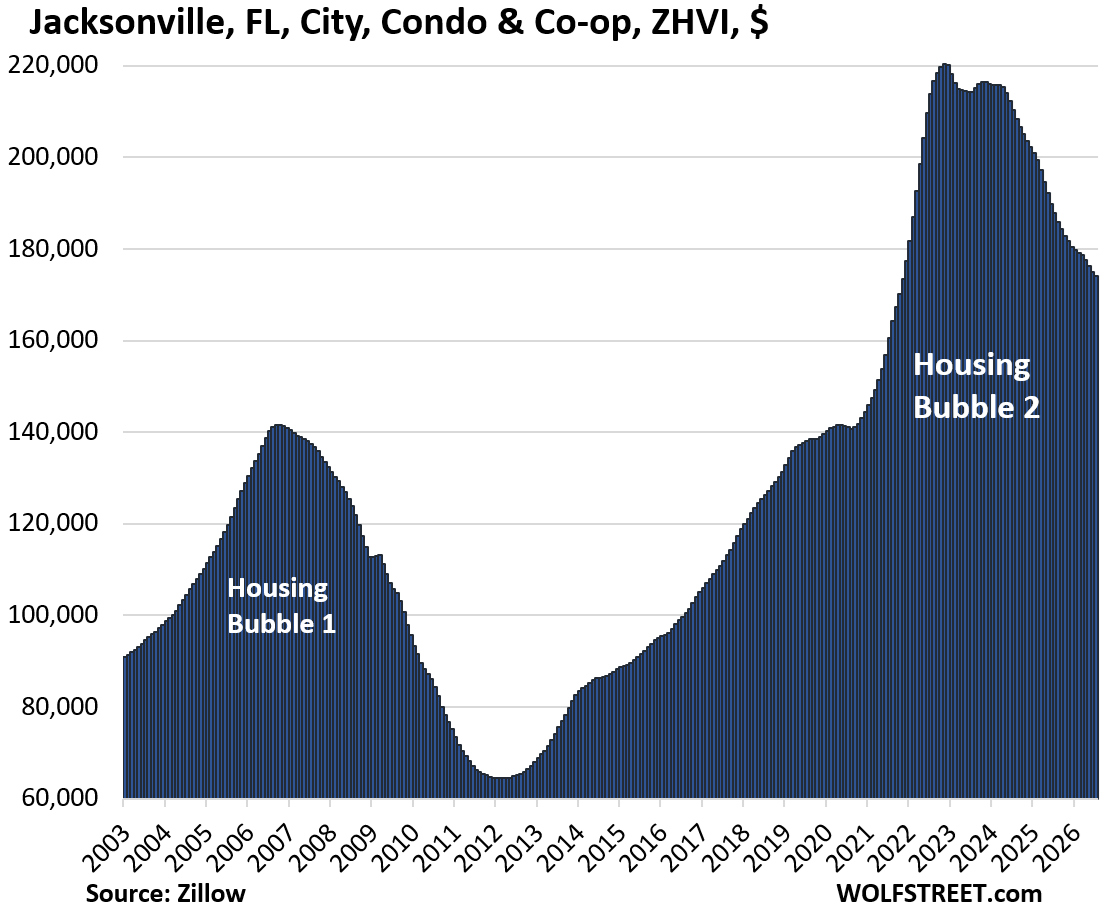
| Jacksonville, FL, City, Condo Prices | |||
| From Nov 2022 peak | MoM | YoY | Since 2000 |
| -21% | -0.5% | -7.4% | 139% |
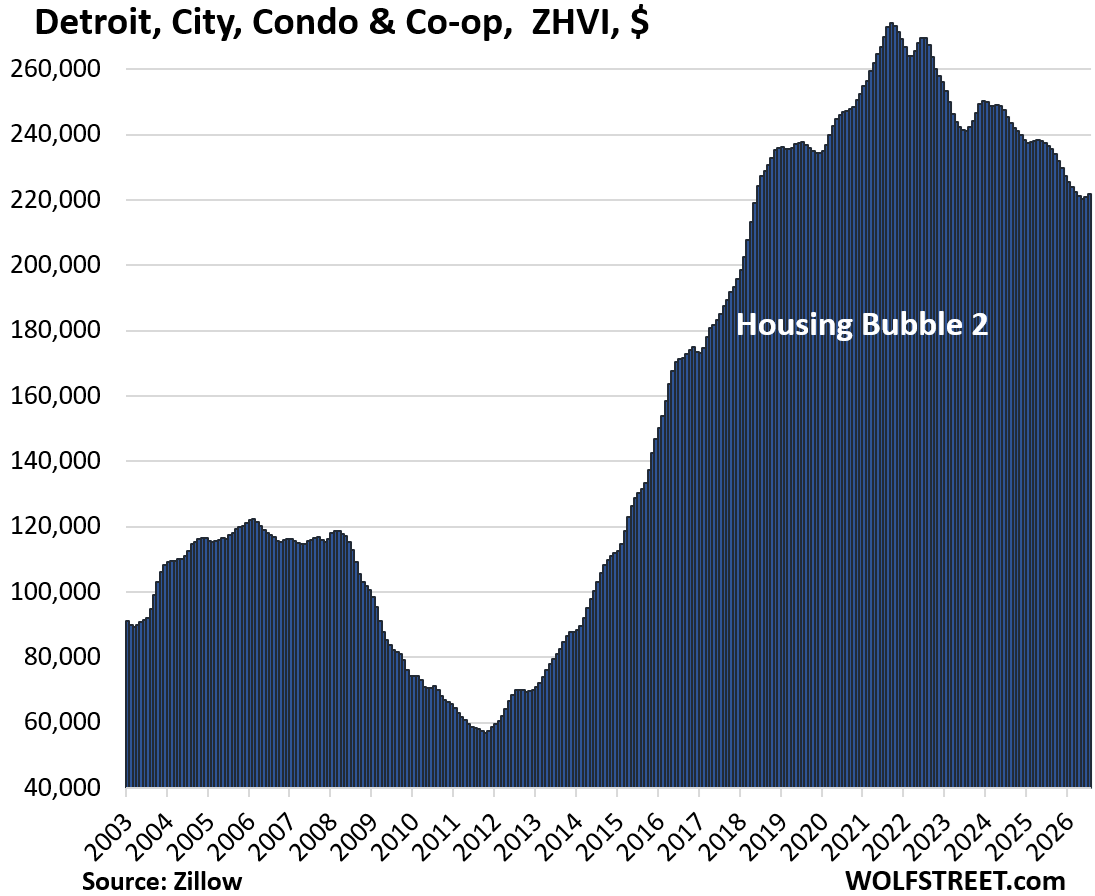
| Detroit, MI, City, Condo Prices | |||
| From Sep 2021 peak | MoM | YoY | Since 2000 |
| -19% | 0.4% | -6.3% | 245% |
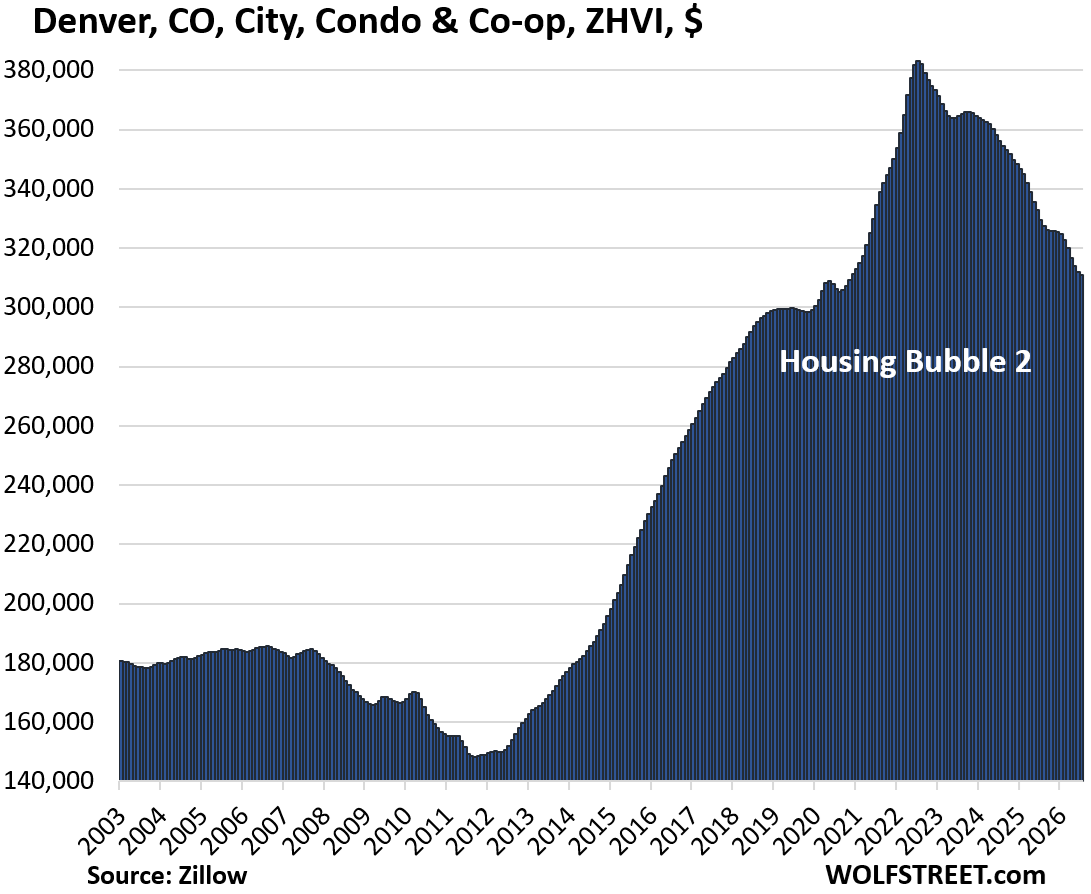
| Denver, CO, City, Condo Prices | |||
| From Jul 2022 peak | MoM | YoY | Since 2000 |
| -19% | -0.3% | -5.7% | 126% |
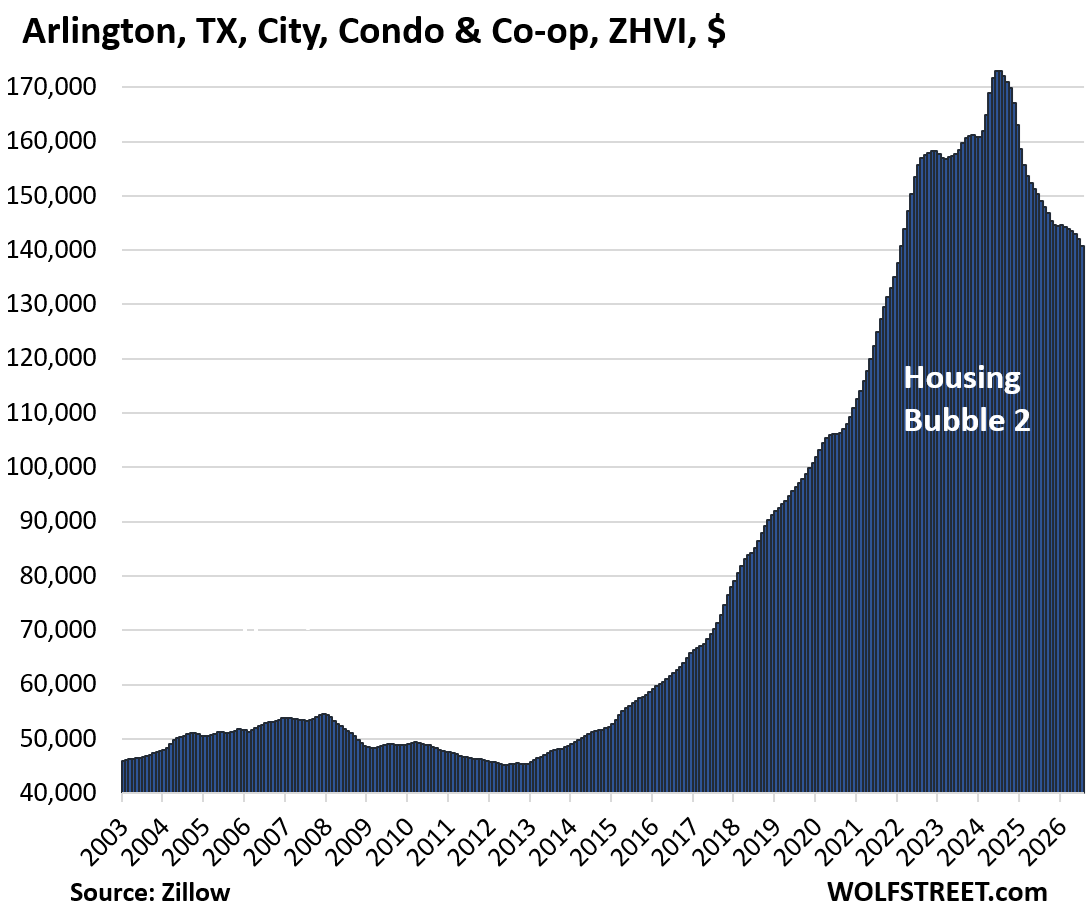
| Arlington, TX, City, Condo Prices | |||
| From Jun 2024 peak | MoM | YoY | Since 2000 |
| -19% | -1.0% | -5.5% | 222% |
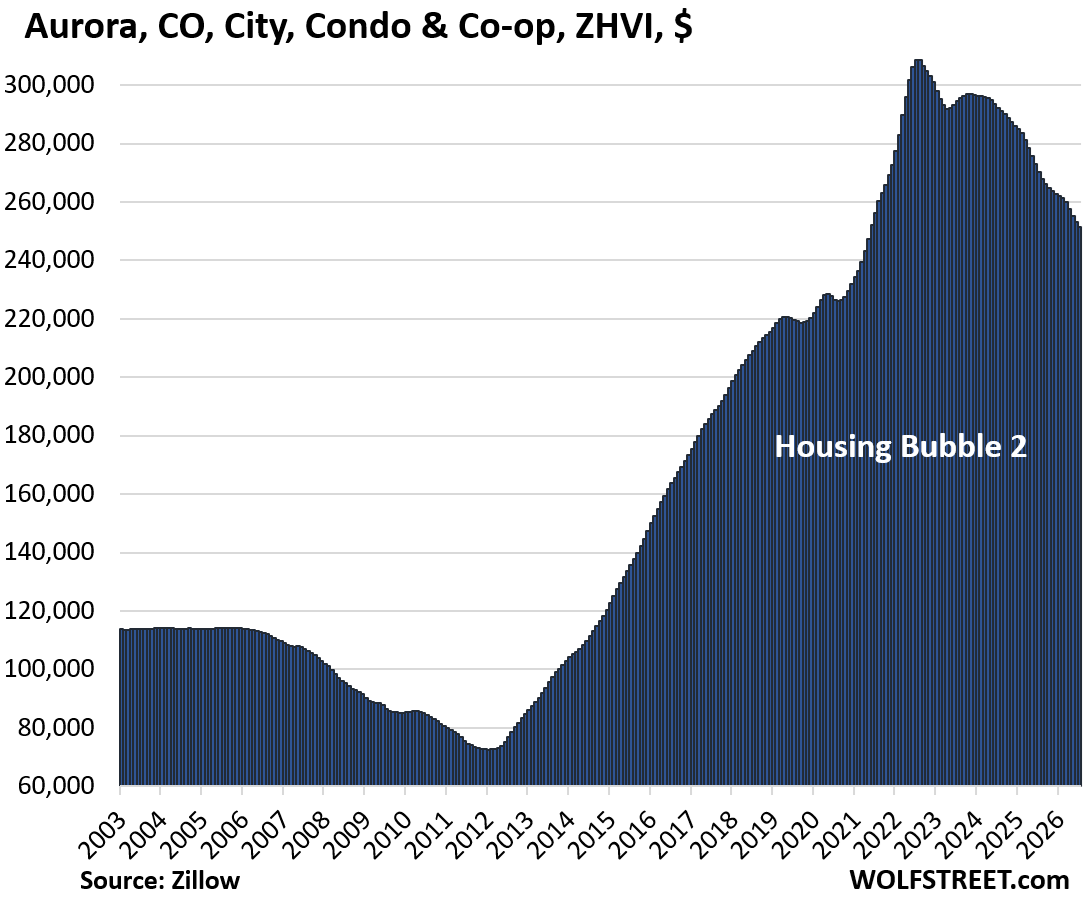
| Aurora, CO, City, Condo Prices | |||
| From Jul 2022 peak | MoM | YoY | Since 2000 |
| -19% | -0.7% | -6.9% | 188% |
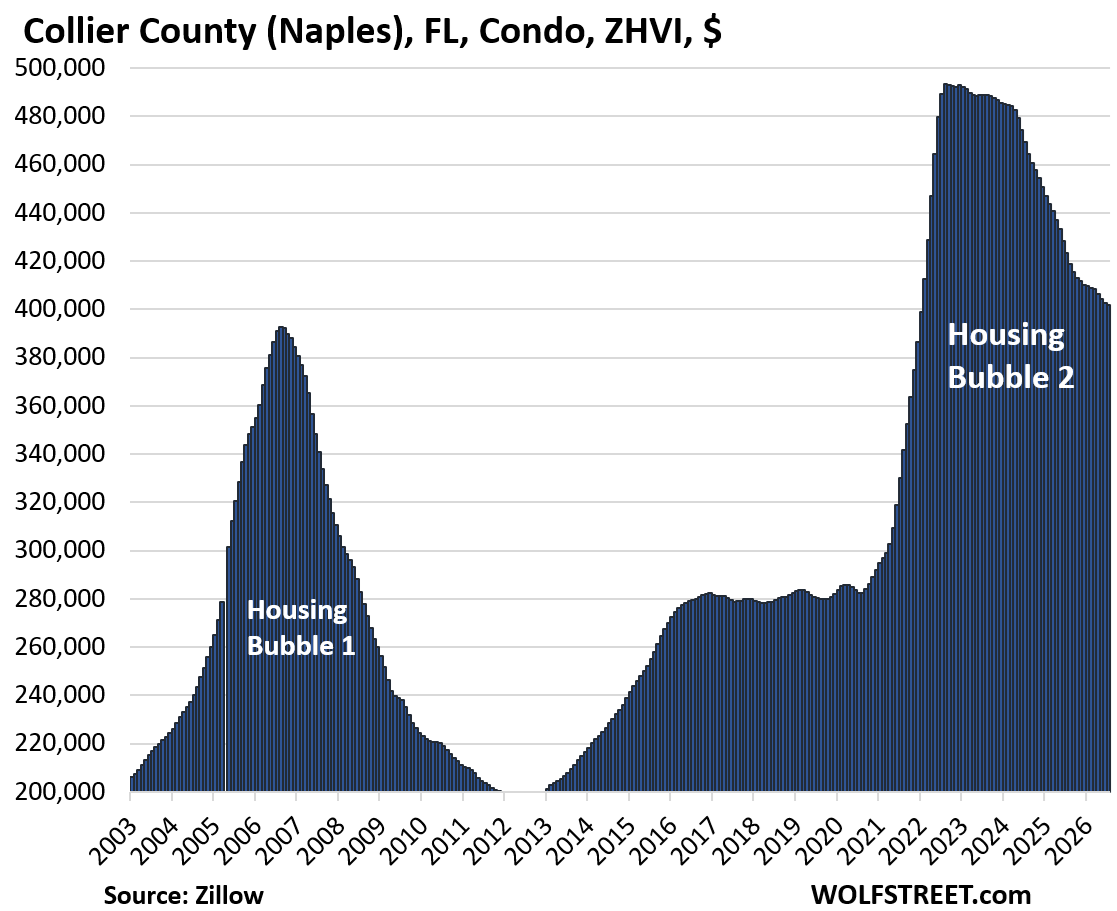
| Collier County (Naples), FL, Condo & Co-ops Prices | |||
| From Jun 2022 peak | MoM | YoY | Since 2000 |
| -19% | -0.1% | -5.1% | 152% |
| Orlando, FL, City, Condo Prices | |||
| From Jan 2024 peak | MoM | YoY | Since 2000 |
| -18% | -0.5% | -7.6% | 145.4% |
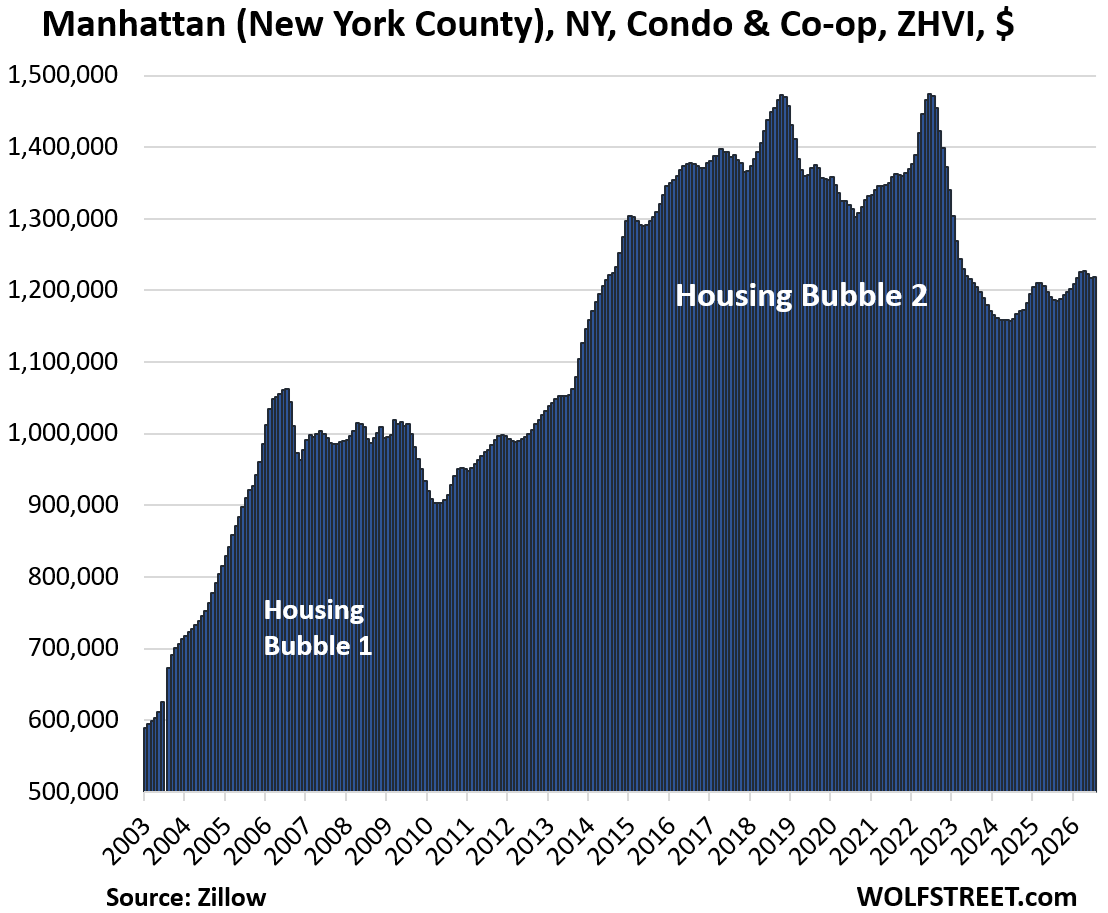
| Manhattan (New York County), NY, Condo & Co-Op Prices | |||
| From Jun 2022 peak | MoM | YoY | Since 2000 |
| -17% | 0.1% | 2.7% | 217% |
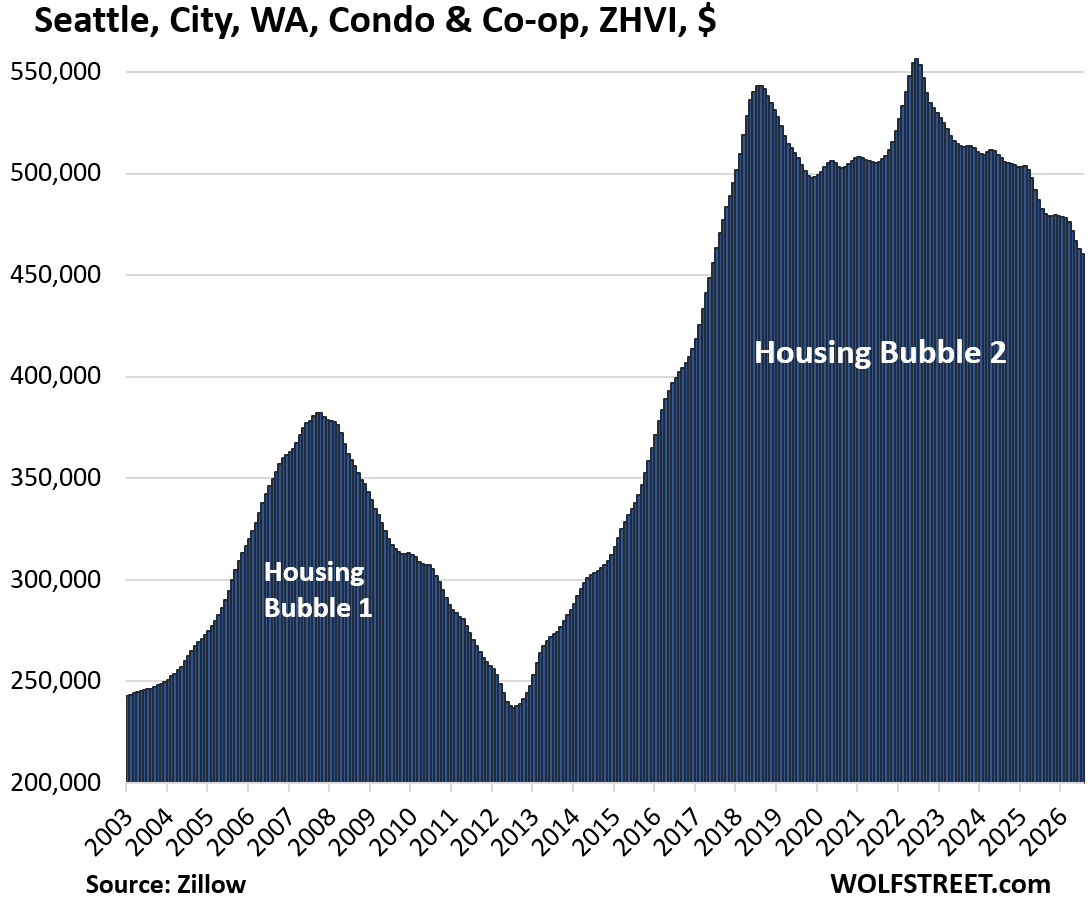
| Seattle, WA, City, Condo Prices | |||
| From Jun 2022 peak | MoM | YoY | Since 2000 |
| -17% | -0.5% | -4.6% | 127% |
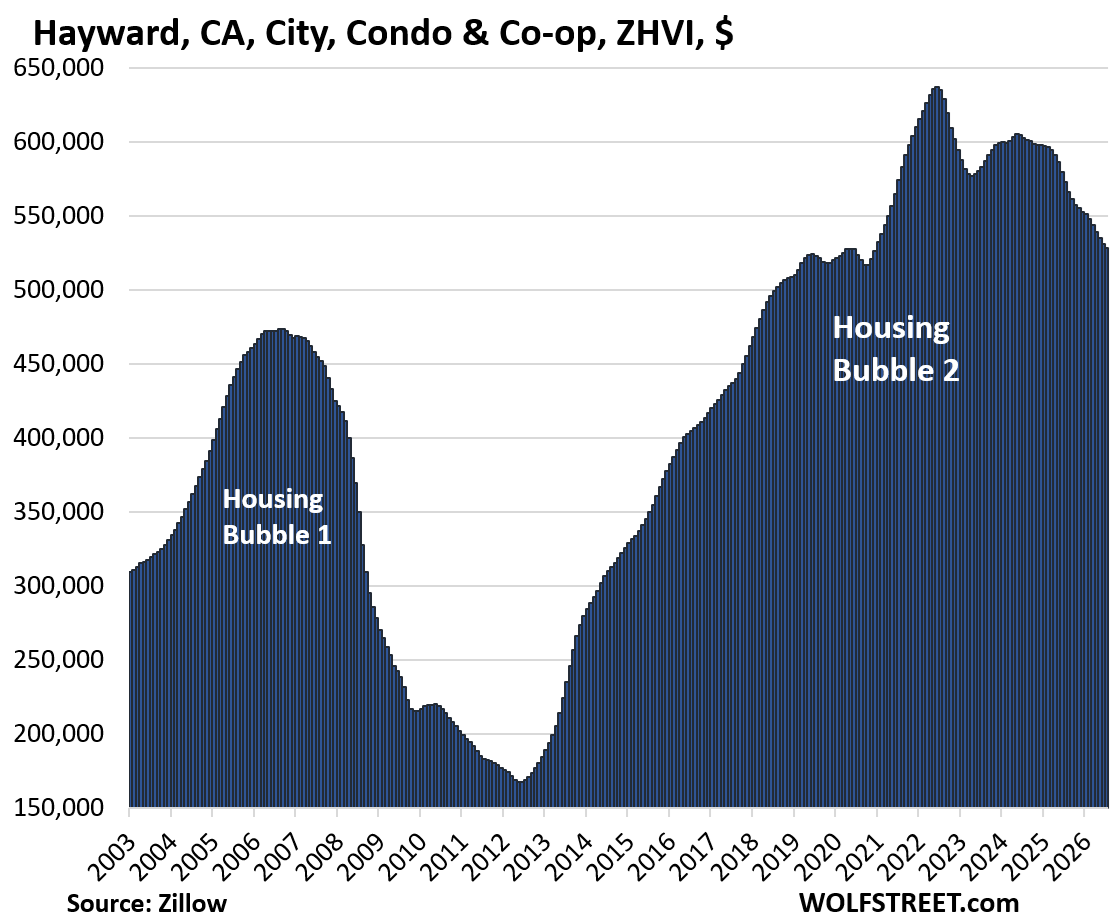
| Hayward, CA, City, Condo Prices | |||
| From July 2022 peak | MoM | YoY | Since 2000 |
| -17% | -0.5% | -7.8% | 172% |
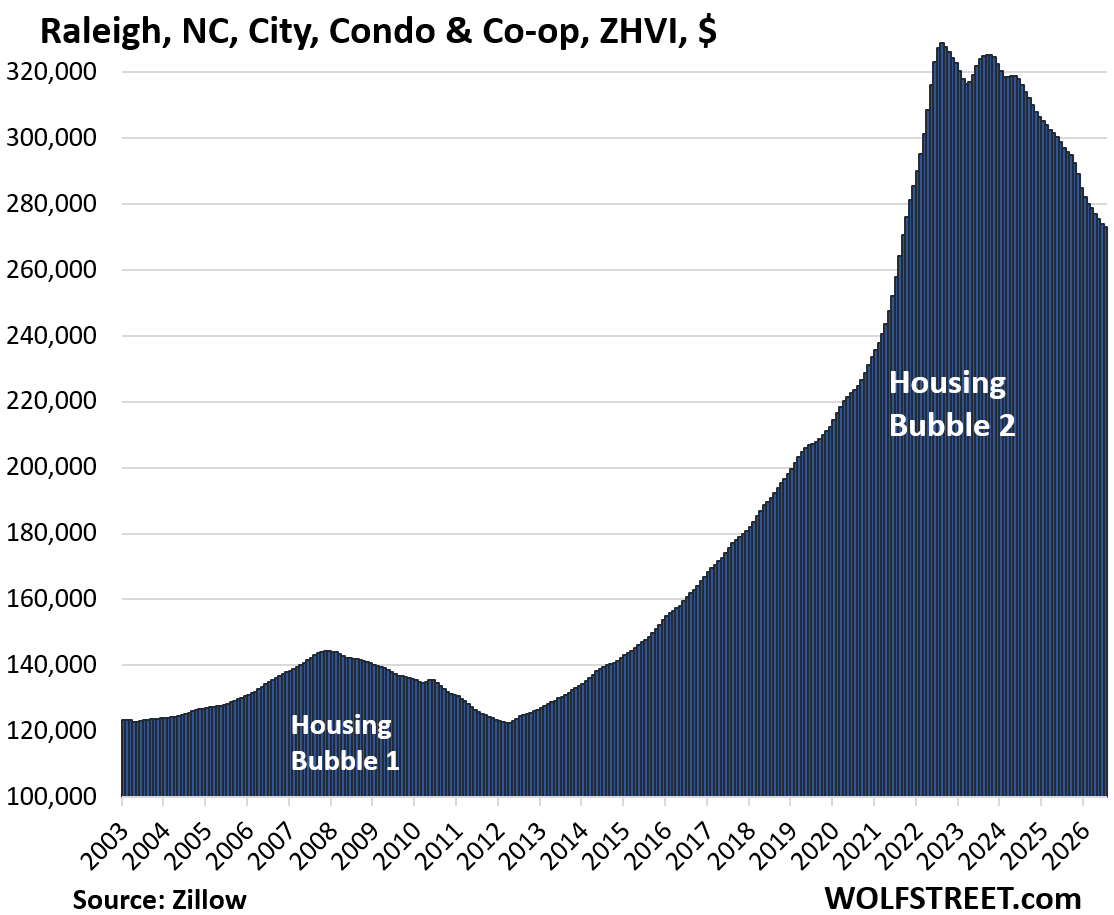
| Raleigh, NC, City, Condo Prices | |||
| From July 2022 peak | MoM | YoY | Since 2000 |
| -17% | -0.4% | -8.1% | 130.5% |
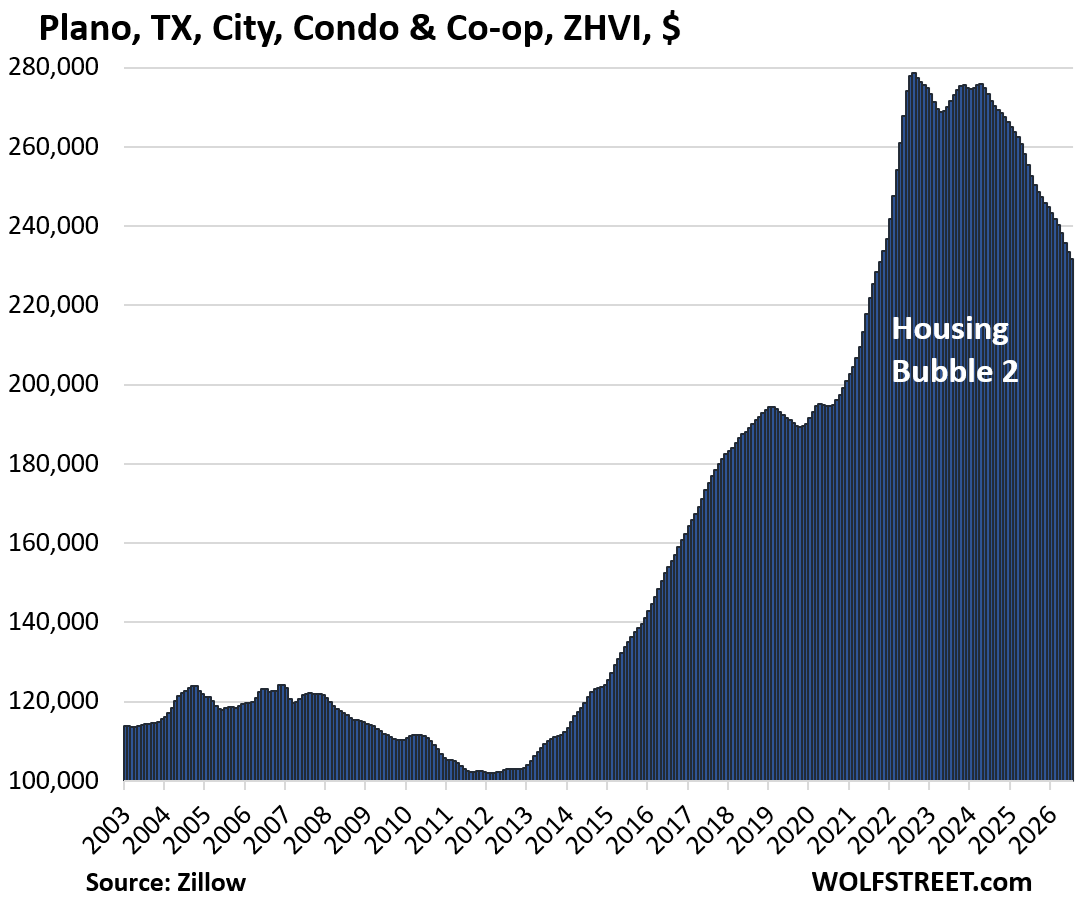
| Plano, TX, City, Condo Prices | |||
| From Aug 2023 peak | MoM | YoY | Since 2000 |
| -17% | -0.7% | -8.2% | 120% |
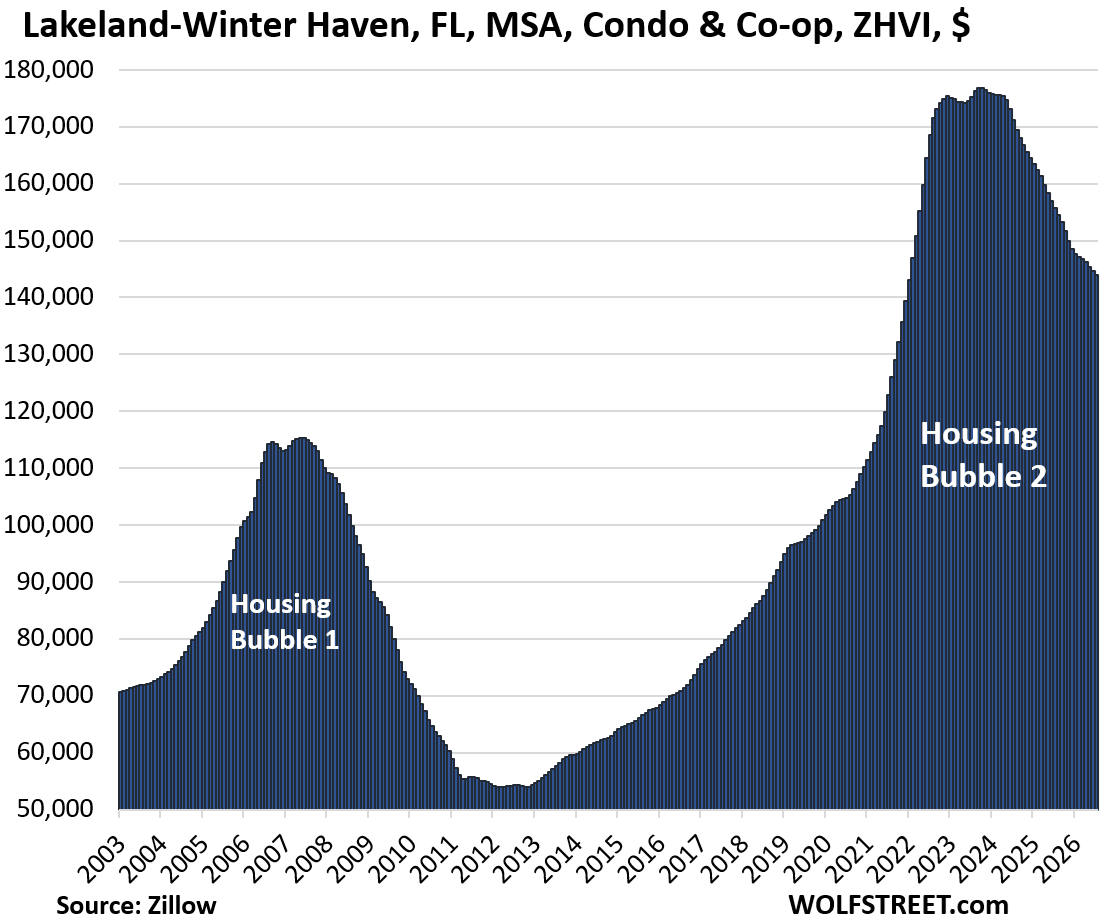
| Lakeland-Winter Haven, FL, MSA, Condo Prices | |||
| From July 2022 peak | MoM | YoY | Since 2000 |
| -17% | -0.5% | -7.6% | 121% |
| Contra Costa County (East Bay), CA, Condo & Co-Op Prices | |||
| From Jun 2022 peak | MoM | YoY | Since 2000 |
| -17% | -0.2% | -4.5% | 131% |
The East Bay county comprises Concord, Antioch, Pittsburg, Walnut Creek, Richmond, San Ramon, and many other smaller cities.
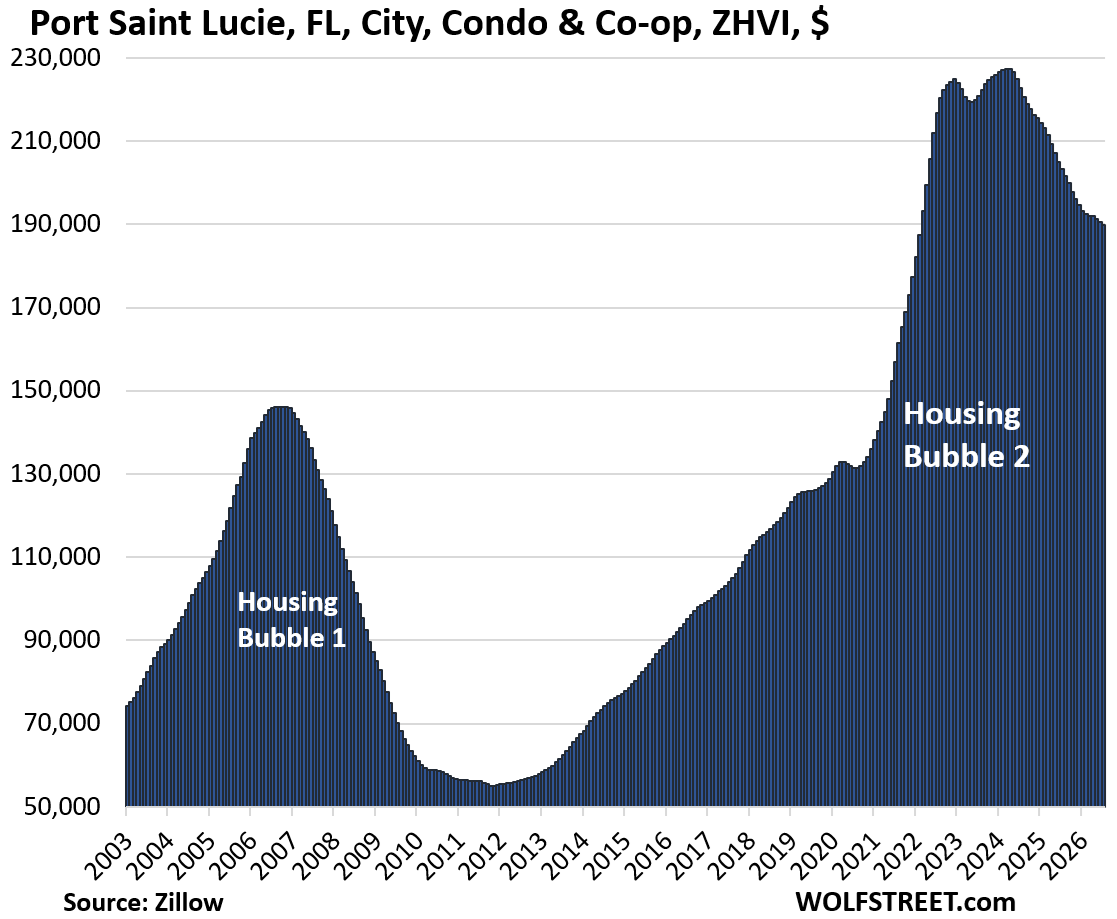
| Port Saint Lucie, FL, City, Condo Prices | |||
| From July 2022 peak | MoM | YoY | Since 2000 |
| -17% | -0.5% | -6.6% | 225.4% |
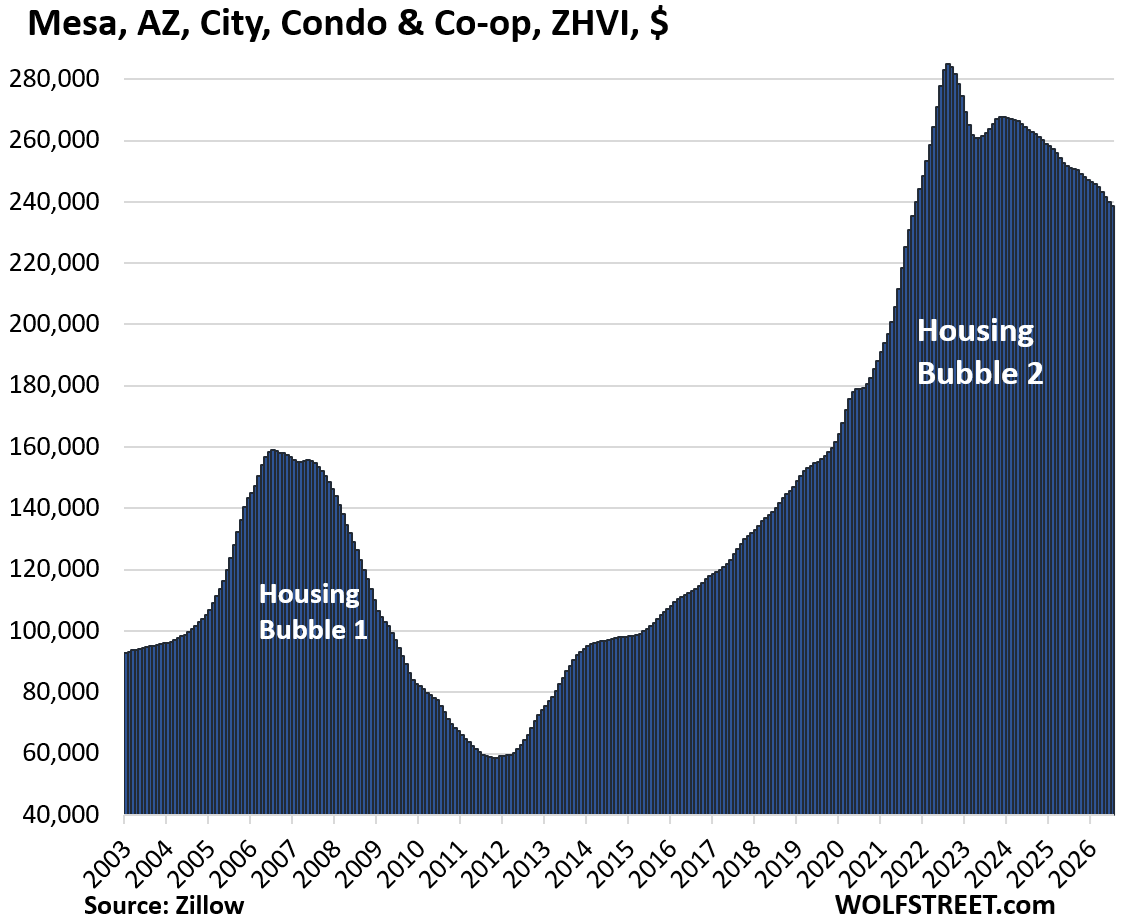
| Mesa, AZ, City, Condo Prices | |||
| From Aug 2022 peak | MoM | YoY | Since 2000 |
| -16% | -0.5% | -4.9% | 194% |
| Fremont, CA, City, Condo Prices | |||
| From May 2022 peak | MoM | YoY | Since 2000 |
| -16% | -0.6% | -6.4% | 193.3% |
| San Mateo County (Silicon Valley), CA, Condo & Co-op Prices | |||
| From Jun 2022 peak | MoM | YoY | Since 2000 |
| -16% | 0.1% | -3.4% | 192% |
San Mateo County comprises lots of smaller cities that make up the northern part of Silicon Valley.
| Portland, OR, City, Condo Prices | |||
| From Jun 2022 peak | MoM | YoY | Since 2000 |
| -15% | -0.4% | -3.7% | 104% |
| Chandler, AZ, City, Condo Prices | |||
| From Aug 2022 peak | MoM | YoY | Since 2000 |
| -15% | -0.4% | -4.3% | 202.0% |
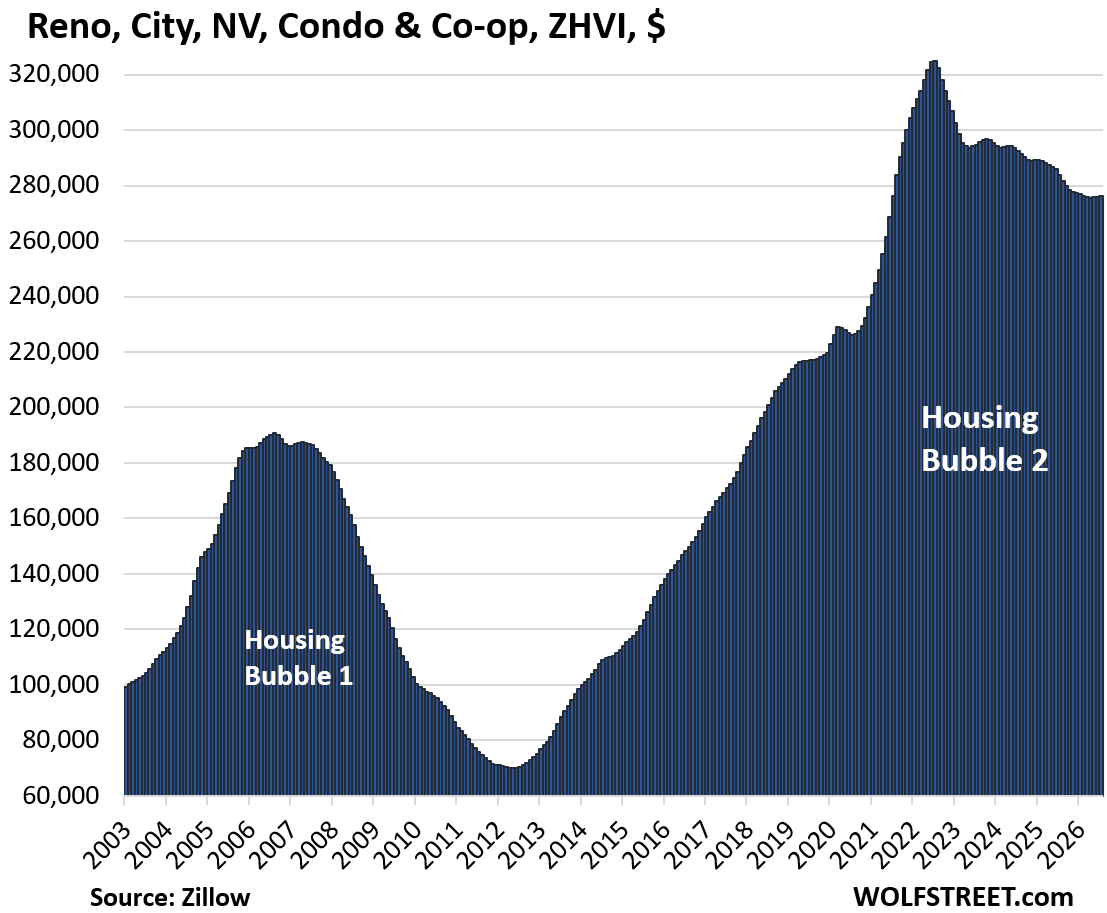
| Reno, NV, City, Condo Prices | |||
| From Jun 2022 peak | MoM | YoY | Since 2000 |
| -15% | 0.1% | -2.7% | 242% |
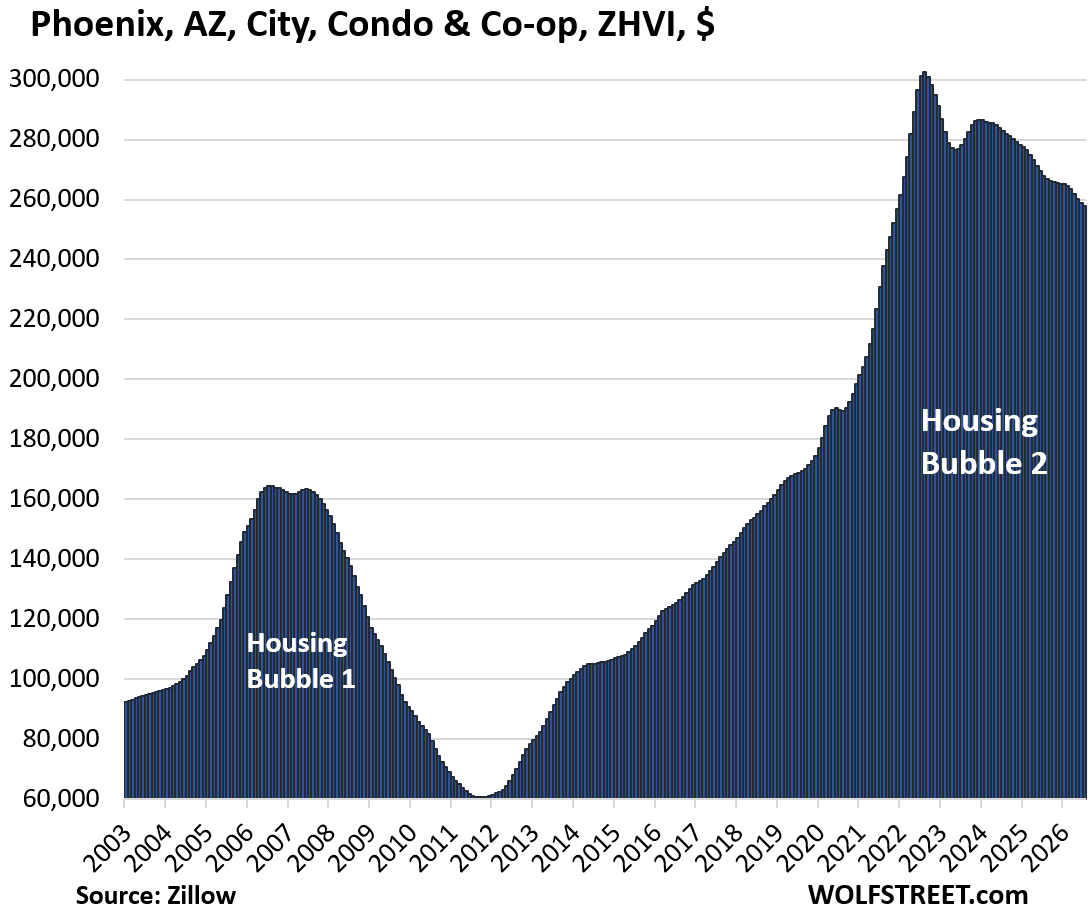
| Phoenix, AZ, City, Condo Prices | |||
| From Aug 2022 peak | MoM | YoY | Since 2000 |
| -15% | -0.4% | -3.8% | 226% |
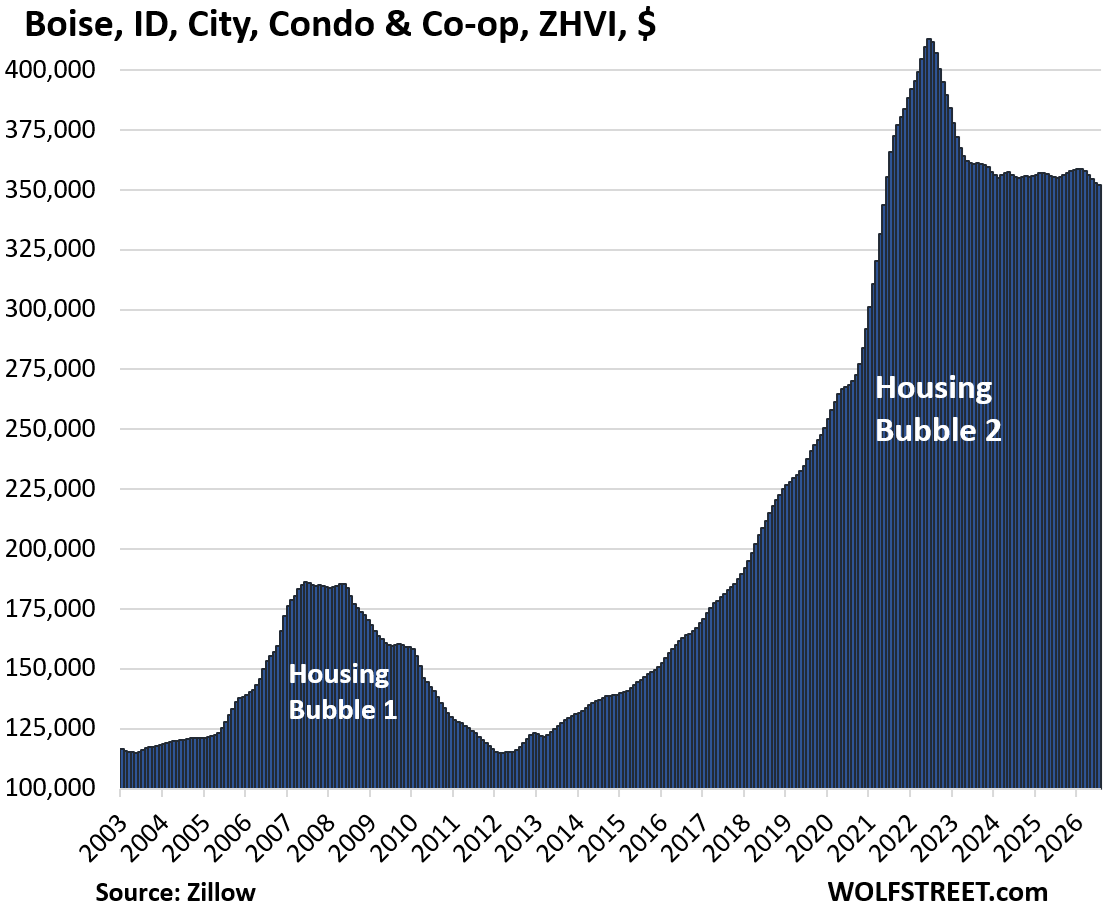
| Boise, ID, City, Condo Prices | |||
| From Jun 2022 peak | MoM | YoY | Since 2001 |
| -15% | -0.3% | -1% | 221% |
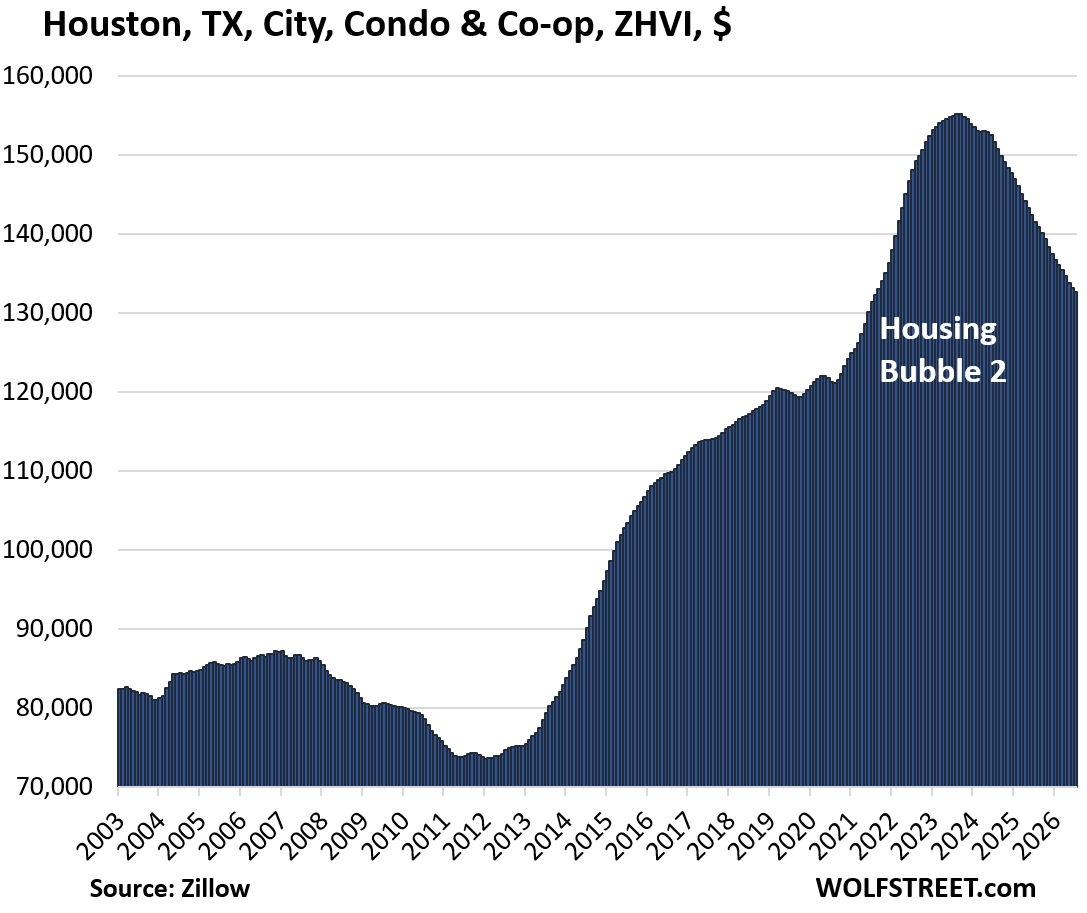
| Houston, TX, City, Condo Prices | |||
| From Aug 2023 peak | MoM | YoY | Since 2000 |
| -15% | -0.4% | -6.3% | 64% |
| Tempe, AZ, City, Condo Prices | |||
| From Jul 2022 peak | MoM | YoY | Since 2000 |
| -15% | -0.8% | -5.1% | 155.8% |
A sample of cities where condo prices fell by 8% to 14%.
In many bigger cities, condo prices have dropped by less than 15%, and they weren’t included in the above line-up.
Here is a sample list of 37 bigger cities where prices have dropped by 8% to 14% from their respective peaks. Several of them are only a few bad months away from joining the above line-up, including San Antonio and Dallas, two of the biggest cities in the US.
| Mid-tier condo prices fell by 8% to 14% | |||
| Market | Since peak | Year of peak | |
| 1 | Glendale, AZ | -14% | 2022 |
| 2 | San Antonio, TX | -14% | 2024 |
| 3 | Dallas, TX | -14% | 2023 |
| 4 | Huntsville, AL | -14% | 2022 |
| 5 | Irving, TX | -14% | 2023 |
| 6 | Sacramento, CA | -14% | 2022 |
| 7 | Queens, NY | -14% | 2022 |
| 8 | Scottsdale, AZ | -14% | 2022 |
| 9 | Colorado Springs, CO | -13% | 2022 |
| 10 | Stockton, CA | -13% | 2022 |
| 11 | Corpus Christi, TX | -13% | 2023 |
| 12 | Modesto, CA | -13% | 2022 |
| 13 | Fort Lauderdale, FL | -12% | 2022 |
| 14 | Las Vegas, NV | -12% | 2022 |
| 15 | Henderson, NV | -12% | 2022 |
| 16 | Spokane, WA | -11% | 2022 |
| 17 | Elk Grove, CA | -10% | 2022 |
| 18 | Nashville, TN | -10% | 2022 |
| 19 | Atlanta, GA | -10% | 2023 |
| 20 | Washington, DC | -10% | 2022 |
| 21 | Salt Lake City, UT | -9% | 2022 |
| 22 | New Orleans | -9% | 2022 |
| 23 | Memphis, TN | -9% | 2024 |
| 24 | Minneapolis, MN | -9% | 2021 |
| 25 | Fort Worth, TX | -9% | 2024 |
| 26 | San Diego, CA | -9% | 2023 |
| 27 | Los Angeles, CA | -9% | 2022 |
| 28 | Tucson, AZ | -9% | 2023 |
| 29 | Marietta GA | -8% | 2024 |
| 30 | Wilmington, NC | -8% | 2022 |
| 31 | San Jose, CA | -8% | 2022 |
| 32 | Lubbock, TX | -8% | 2022 |
| 33 | St. Louis, MO | -8% | 2023 |
| 34 | San Francisco, CA | -8% | 2022 |
| 35 | Oklahoma City, OK | -8% | 2023 |
| 36 | Miami, FL | -8% | 2023 |
| 37 | Long Beach, CA | -8% | 2023 |
A reminder of the special issues condos face.
Some people buy condos as a home, to live in an urban center or along the shore, to enjoy the big views, nice amenities, or central location. They value the worry-free living; not having to mess with maintenance, repairs, and yardwork; having staff at a desk by the front door; or not having to climb stairs.
Others buy condos as rental properties or as short-term vacation rentals. Or they buy them as vacation homes. Others, especially nonresident foreign investors, buy condos to park some cash in the US and watch the price spiral higher from a distance. It’s these investors that make condos particularly speculative.
Some of the special issues:
- Over the long term, land appreciates, most buildings depreciate to zero and are eventually torn down. The land that big condo buildings sit on can be very valuable, but each condo owner only owns a tiny slice of it. The rest of their investment is in the building. A single-family house may sit on less valuable land, but the homeowner owns all of it.
- Prices that exploded over the past few years ended up being way too high, once the mania settled down.
- Hefty special assessments – or the fear of them – for long-neglected major repairs dog some older condo buildings. This is a particular issue in Florida, but elsewhere too.
- Big increases in HOA fees at many properties, partly driven by spiking insurance costs in natural disaster zones, add substantially to the monthly costs of condos.
- If a condo building is on Fannie Mae’s Blacklist, financing a unit in that building gets very difficult, and sales may be limited to cash buyers who know that.
- The Free Money has ended, and mortgage rates are roughly back to a normal range. Buyers of single-family homes face the same issue.
- Foreign-based owners who’ve had it with the US have become sellers, adding supply, and interest from foreign buyers to purchase a home in the US has waned, removing demand.
- Investors in condos as rental properties are facing stiff competition from a wave of newly completed higher-end apartment buildings that developers are trying to find tenants for.
And in case you missed it: Oh Dear, Prices of Single-Family Homes Fell by 11% to 26% in 15 Bigger Cities Already
Enjoy reading WOLF STREET and want to support it? You can donate. I appreciate it immensely. Click on the mug to find out how:


Beautiful charts. Morbidly curious to see the SF trend.
Condo fees and special assessments are so out of hand, it’s hard to argue that an apartment is not a better deal. Going to be a long time for a buyer now to count on appreciation.
If you buy an old house, you’ll face massive repair & maintenance costs over the next 10 years, unless you want to renovate the house, and then the costs are 5x massive. Housing is expensive. People just forgot because the Fed’s QE and the resulting price explosion, which is now over, distracted from the operating and maintenance costs of a house.
I own old homes. I am retired, and have learned to take care of them. Older homes use lots of wood and old machines. Unlike new homes which require special tools and materials to repair, old ones are easy to repair. You will find you can live in older homes much more cheaply than new ones, and they are beautiful. You will want to show them off just like old cars, which, by the way, are a lot easier and cheaper to repair than new ones. In my opinion the condo concept with hoa and extra charges, are just a modern way to depart you from you hard earned money, rather like new cars and homes.
My experience with period homes is that the lack of insulation drives utility costs higher than modern construction. That and lath & plaster repair is more of an art than science.
Agree totally:
Was late to the party when WE purchased the ONLY house close enough to my beloved’s parents in ’15, and, as it became obvious, the only one not part of the vast conspiracy between the banks and the hedge funds, etc., to prevent actual ”price discovery” from allowing folx to buy at reasonable prices, AS was the case for the previous crashes going back into the 1880s, AT least…
This is totally due to the manipulations from the FED in bed with the oligarchy.
While it is simplistic to say, ” Get rid of the Fed.” It should be very clear to any investor that the FRB does everything and ONLY those things to protect the banks and the oligarchy.
Any other thinking is due to the massive and continuing propaganda put out by the MSM, at this point entirely owned by the oligarchy…
Hedge accordingly.
correct. we are just wrapping up restoring and renovating the 16th old house, this one built in 1858. been doing it for decades as a hobby. lived in a bunch of them, rented a bunch out. way easier to work on old stuff. the floor joists are about a foot wide. i could park a mac truck on it. i’ve owned and lived in modern places. most are junk and loud with thin walls………i even learned how to cut slate and drill holes for slate roofs when i was a young man in early 20s. those roofs will last a few lifetimes. the material cost when restoring old buildings are much less expensive. the original stuff was made to last for centuries.
Harrold, here in Spain there is a huge push to upgrade windows, roof, floor and exterior wall insulation, etc. This is mostly a thing being done to spartment buildings, town/rowhouses and detached duplexes, and it can significantly to massively increase energy efficiency.
Is something like that doable with N. American period houses?
Thanks
Credited response.
But, single family owners have control over this and condo owners cede control to a board of amateurs or a for profit management company directed by a board of amateurs. In both cases, interests conflict and the individual has no leverage because they agreed to pernicious operating documents without reading those documents.
“to a board of amateurs or a for profit management company directed by a board of amateurs”
How dare you slander the Board of Pines of Mar Gables/Del Boca Vista!
Sue!
Impeach!
Cancel the Senior Swingers Key Party at The Villages!
(Active Retirement indeed)
And where the hell is my Space Pen?!
SFH are managed by amateurs too.
This. A house is a perpetual money sink, and counting on inflation to float the returns rarely overcomes the perpetual nagging and serious repairs, let alone full renovation. But you need a roof, and the van down by the river needs a new transmission.
Paint, $60 a gallon, even lighting, switches, and changing a sink, they all lead to cost cascades.
Being alive means working and the opposite is also true. You can do it yourself or pay people to do your work for you, or not do anything at all and reap the decline in self and assets. I do know this, my once upon a time crap shack on the river I paid $110K for has been renovated by me and is now worth over 1 mil. I might have put $150K materials in it over the years including a new standing seam metal roof. Insulation? Come on, easy peasy. I think it took me 1/2 a day to get to R28 in the attic. Walls redone with R 20. We can heat it with a candle. I’m a carpenter so all this is second nature, but it isn’t rocket science. And if you’re all thumbs you can hire a contractor and do the end of day cleanup to save a few bucks. Some guys might even let you work with them, but I have only seen this once and that was after he did the cleanup for a few months. They then offered him a full time job as an apprentice.
Condos are great for some, but not for all. HOA (Strata Councils) would be a nightmare imho. But then some folks are willing to pay for the chores and maintenance being done for them. They will have their reasons for this choice.
As for trailers, beware. If they are old your insurance company may cancel coverage at any time. If you live in a T park you will then have to move it out, as parks require insurance. Mortgage? You will also need homeowners insurance to keep your financing. New trailers are really modular housing and are up to today’s building and electrical codes. They are a good buy if you have a place to put it. But older trailers are on borrowed time. If anyone plans to buy an older trailer go see an insurance agent for a quote before buying. Liability is the big issue.
Owning a SFH has significant maintenance burdens (I know from personal experience) but the costs are more controllable (one can delay a project, perform the work themselves, opt for basic vs. fancy upgrade, etc.). One has no say in condo fees, assessments. They are paid monthly, with no option to put them off, adjust, etc. I suspect that condo fee inflation has exceeded SFH maintenance inflation significantly. Any data to confirm/refute this idea?
Yeah houses are money pits. Not as bad as cars, boats, or RVs, as RE can appreciate, but you pay more to hold and preserve compared to other asset classes.
Why I never got the become a landlord pitch of investing. I already got a job, thanks, and with me all the margin is going to the repair guy.
@Wolf – You said “People just forgot because the Fed’s QE and the resulting price explosion, which is now over, distracted from the operating and maintenance costs of a house.”
What do you mean by got distracted? How were they distracted?
Wolf – please – just asking a small favor.
Next time you write an article about condos, please substitute the term ‘*hit boxes’ in the title in place of the word ‘condos’. Thank you!
I’ve never equated condos as a depreciating asset, like a mobile home. When it comes to high rise beach condos, I would guess you are correct. Thanks for the insight Wolf. As I approach retirement, I thought I might consider buying a second home condo. I think I’ll stick to VRBO and Airbnb weekly rentals to enjoy someone else’s depreciating asset with an ocean view. And have the endless options of a new place/town/country at the click of an app.
Brutal drops. Below 2006 levels in some places? That’s rough — but maybe a chance for first-time buyers.
Look at the charts. Most are still above Housing Bubble 1.0. And these are the worst drops.
Good. Hopefully the trend continues.
Those of us who follow Wolf and other housing analysts know this, but the vast majority of the public is clueless. The mainstream media and business media still gaslights us and pushes the “rising median home price” narrative. That keeps sellers in a delusional state and they refuse to lower their asking prices unless they are faced with a distress sale.
Will the price declines continue to be like watching paint dry?
Like watching paint dry right up to before the stock market crash.
@Wolf if you buy an old house you have the option of doing the work yourself and can save a lot of money. With a condo the board typically hires the most expensive firm with the best reputation (and best insurance) so they are covered. They also spend way more on preventative maintenance than a typical homeowner or apartment owner spends. @Mike H. The people that need to sell are selling property. There have always been people that are “delusional” and overprice homes and condos, we just have more than average at this point in the cycle. P.S. Did anyone else think of the Millennium Condo Tower in SF that has sunk 18 inches on one side when looking at Wolf’s SF Condo graph with the angled lines?
If your kitchen is on the high end, you do a little exercise every time you get a beer from the fridge.
The kind of work you can’t do yourself in a condo is the kind of work the vast majority of people can’t do safely.
FANNIE MAE TURMOIL…
10 Execs Depart…
Florida condos look like death. Tons of delayed maintenance collapsing on the owners (heh) and you eat a ton of long term climate change risk (aka insurance & flood risk, plus property tax risk for local gov mitigation costs)
insurance alone means most condos won’t pencil out going forward. Even without that Americans are too poor to afford something like oceans views and the foreigners have left or are leaving the market. That is a large part of these charts.
So Condos are probably not going to be growth market again. They could make excellent subsidized housing which if it’s not being discussed, prob will be at some point in these cities.
No one is building single-family houses in big-city urban cores. They don’t make sense there. Urban cores are for multifamily (condos and apartments). Much of the new-builds are very fancy and nice, both condos and rentals. Condos in the center can cost more than a much bigger house in the suburbs. Mid-tier condos in San Francisco cost $1 million. Fancy ones go into the multi-millions. If you want a new single-family house, go further out, into suburbs, exurbs, or rural areas. Thankfully, there is something for everyone, which is what makes America.
@Wolf – Something for everyone in America….. Is it something that they want or need, or something that they get? Big difference. I am ok with condos and townhomes if they have large shared spaces for the kids to play. Its a nice alternative to sfh with backyard. Most of the builders dont have any open spaces or just a space the size of a king bed. Many of my friends with kids agree. So no, in my market (and likely most), there is not everything for everyone.
You need to listen to the Rolling Stones song, “You can’t always get what you want.” One of my most favorite songs ever though I didn’t fully appreciate the lyrics when the song first came out and I was just a kid.
Video (music & lyrics):
https://www.youtube.com/watch?v=krxU5Y9lCS8
Hey Wolf,
Great info on housing as usual. Would you mind including Contra Costa County, CA in your future SFH market reporting?
So you skipped over stuff, including Contra Costa County? Bad, bad, bad boy! It even got special treatment: it’s included in a list right at the top under the third paragraph because it’s one of the six red-liners where prices fell below their Housing Bubble 1 highs 🤣
So much hate on Condos here. I like having a great location downtown minutes from work. I don’t mind paying the HOA fee. It pretty much covers everything. Plus property taxes and insurance are cheap. All I do is keep the inside of my place clean which is easy because it is small. The upkeep and carrying costs of single family homes is substantial.
I live in SFH and will love to move into a Condo!!
I 100% agree. I don’t understand the individuals here that make very harsh blanket statements about condos. All I can go off of is my investment property in N. San Diego. Made over $400K in equity on a condo that I purchased in 2009. With HOA and the remaining principal, my payment on that property is $1500 less than it currently rents at ($18K positive cash flow annually). Everyone should do what works best for them.
Well tells you something about the demographics of the population who regularly comment on the site. Outside of here they are forwarding chain emails about evil Hillary.