
In another 5 bigger cities, price fell by 10%. But San Francisco powered off the list after AI mania started running the housing market.
By Wolf Richter for WOLF STREET.
Local housing markets rarely march in lockstep. Here we’re tracking bigger markets where prices of mid-tier single-family homes have fallen substantially from their respective peaks in prior years; in other words, where the affordability crisis has gotten less bad. For July, we raised the cut-off to -11% from -10% to keep the list tidy. A year ago, when we started this sporadic series, the cut-off was 8%, and it was a tidy list with just 10 markets on it, and the declines topped out at 22%.
Prices of mid-tier single-family homes have dropped by 11% to 26% seasonally adjusted in these 15 bigger cities and counties through July, from their respective peaks, mostly in mid-2022, but two of them in 2024.
| City or County | From peak | Year of peak | ||
| 1 | Austin | TX | -26% | 2022 |
| 2 | Oakland | CA | -24% | 2022 |
| 3 | New Orleans | LA | -20% | 2022 |
| 4 | Lee County (Cape Coral, Fort Myers) | FL | -18% | 2022 |
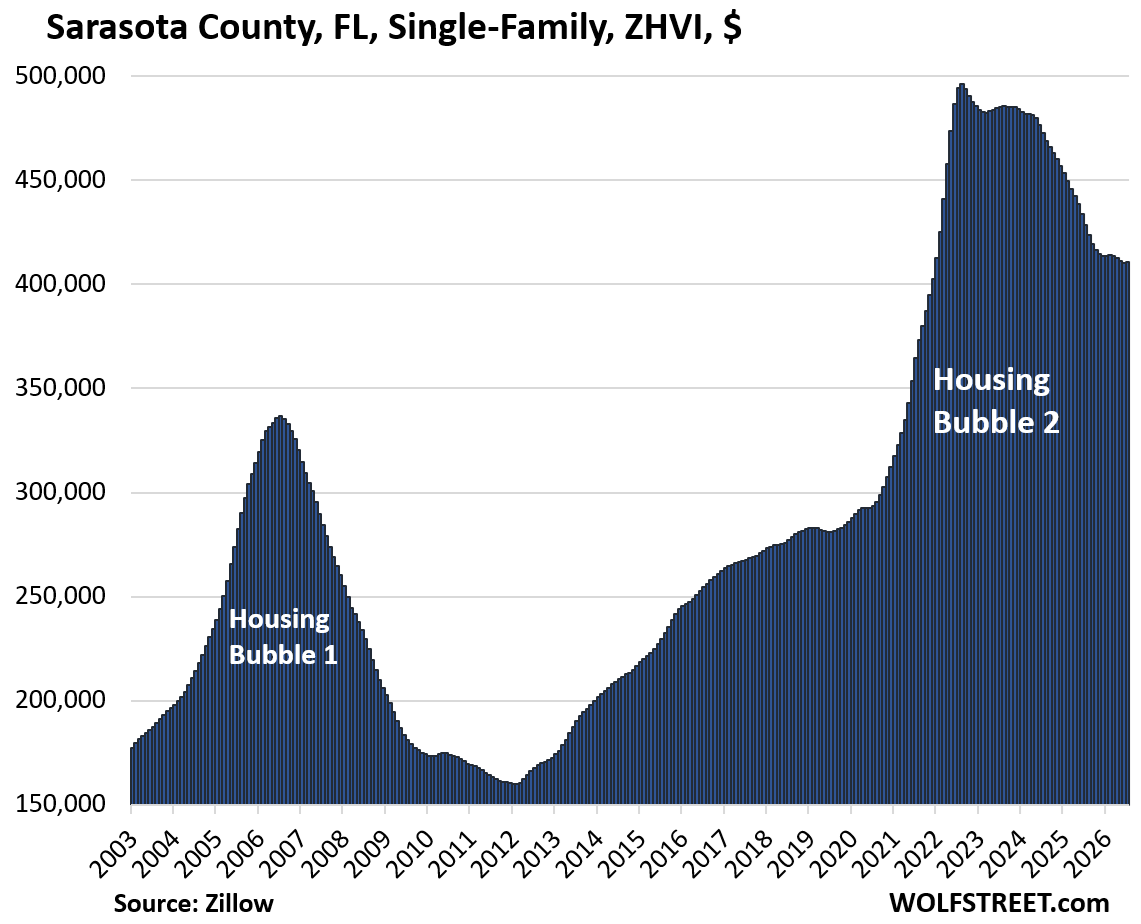
| 5 | Sarasota County | FL | -17% | 2022 |
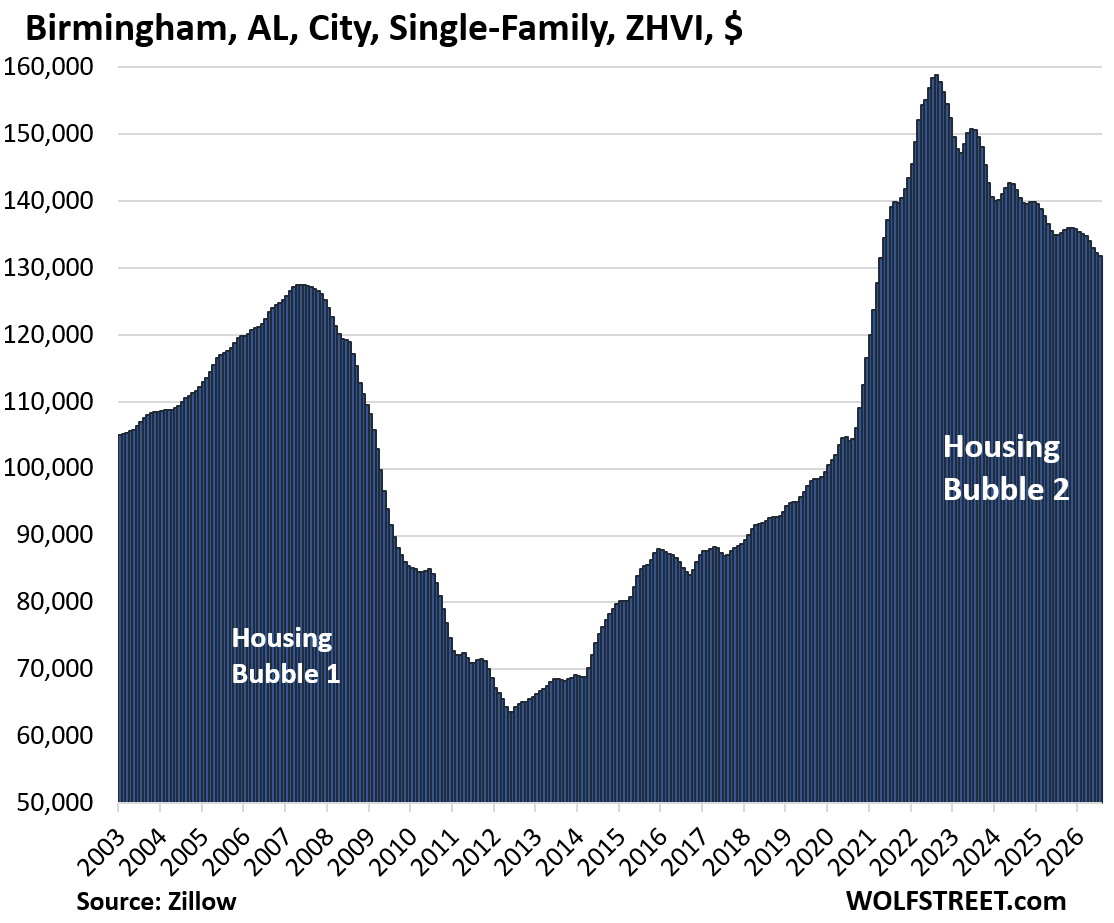
| 6 | Birmingham | AL | -17% | 2022 |
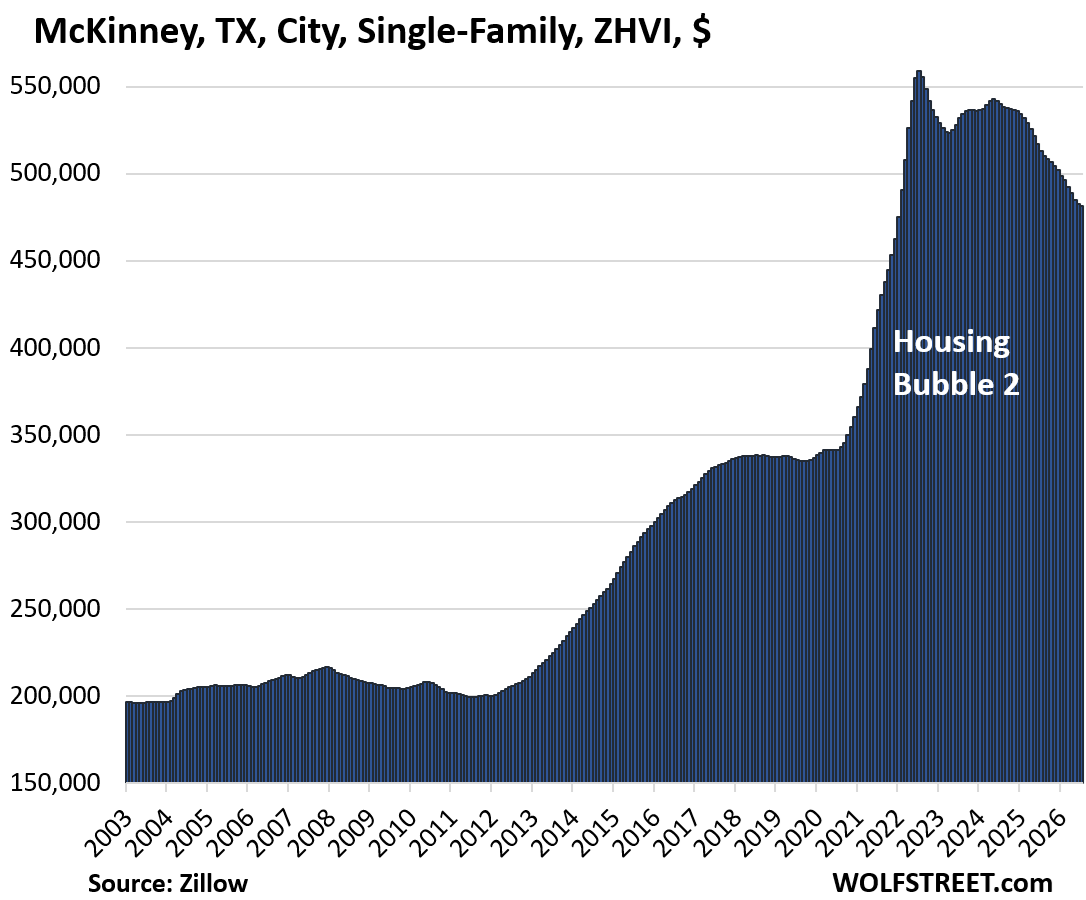
| 7 | McKinney | TX | -14% | 2022 |
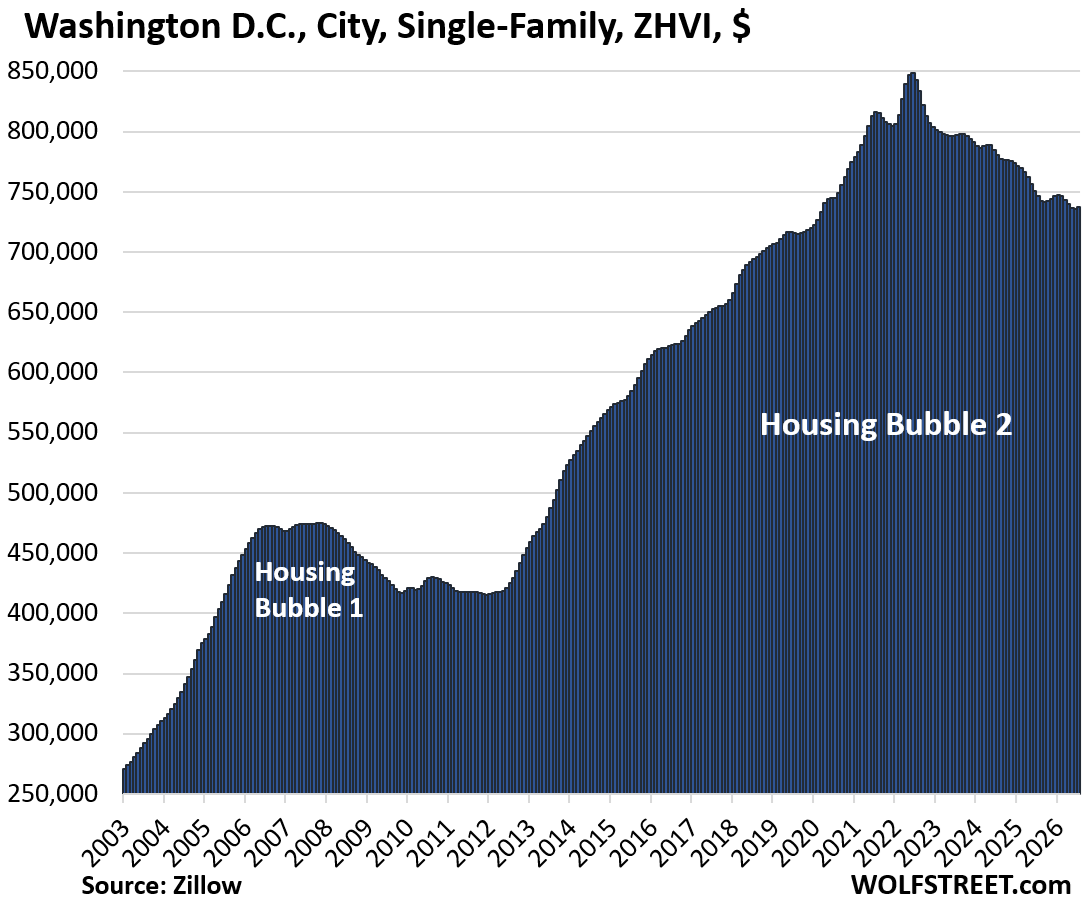
| 8 | Washington | DC | -13% | 2022 |
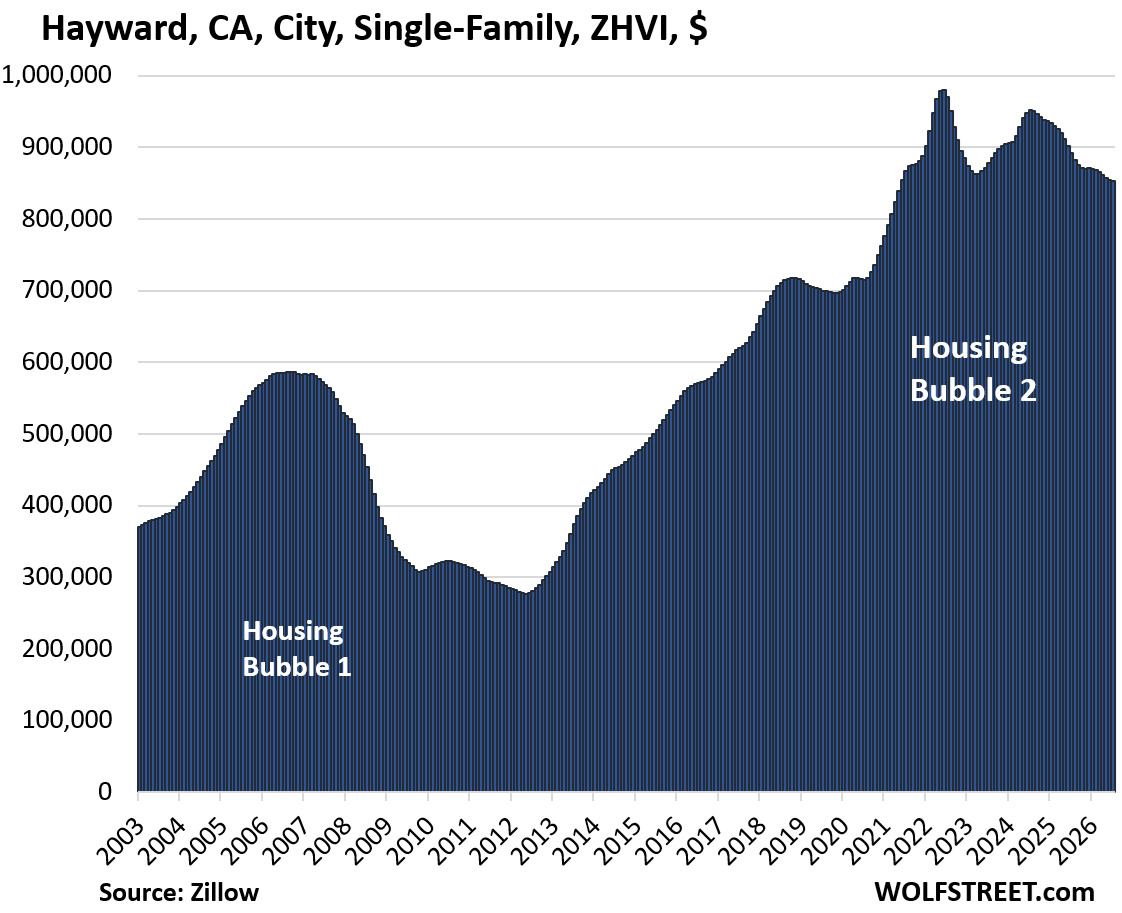
| 9 | Hayward | CA | -13% | 2022 |
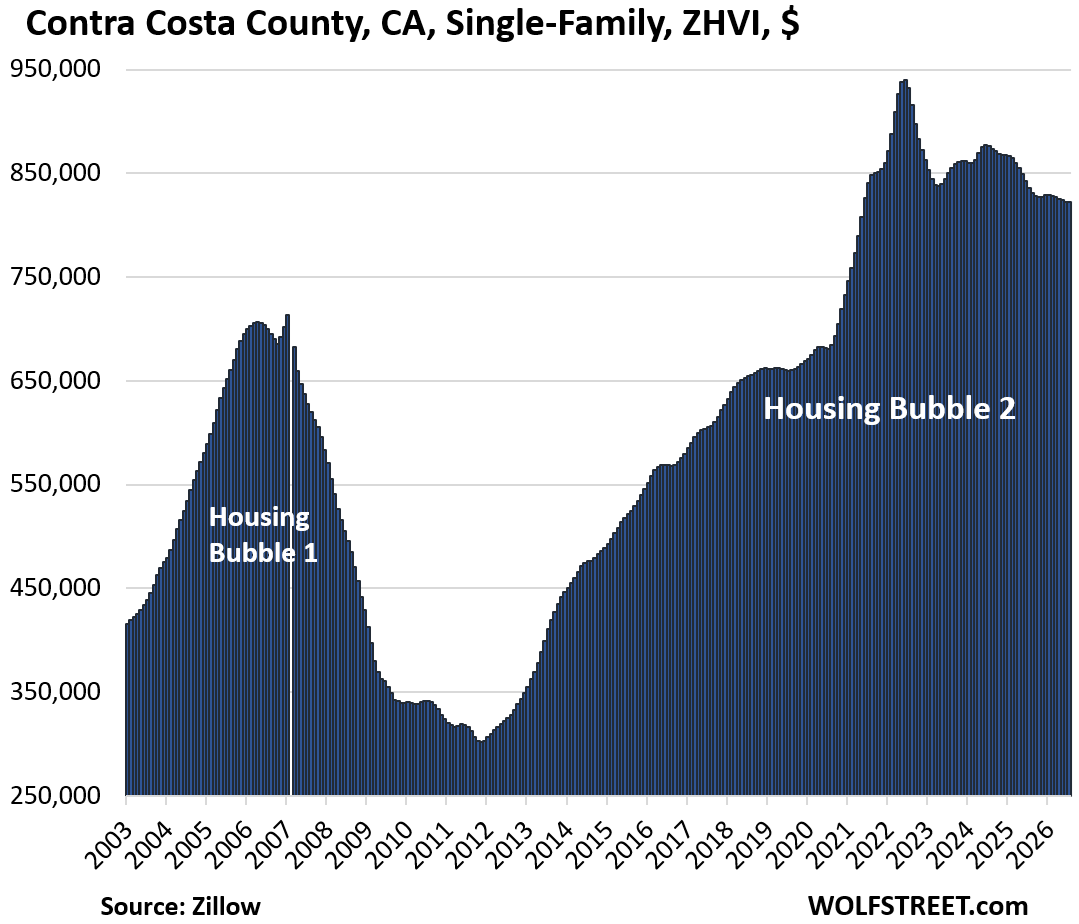
| 10 | Contra Costa County (East Bay) | CA | -12% | 2022 |
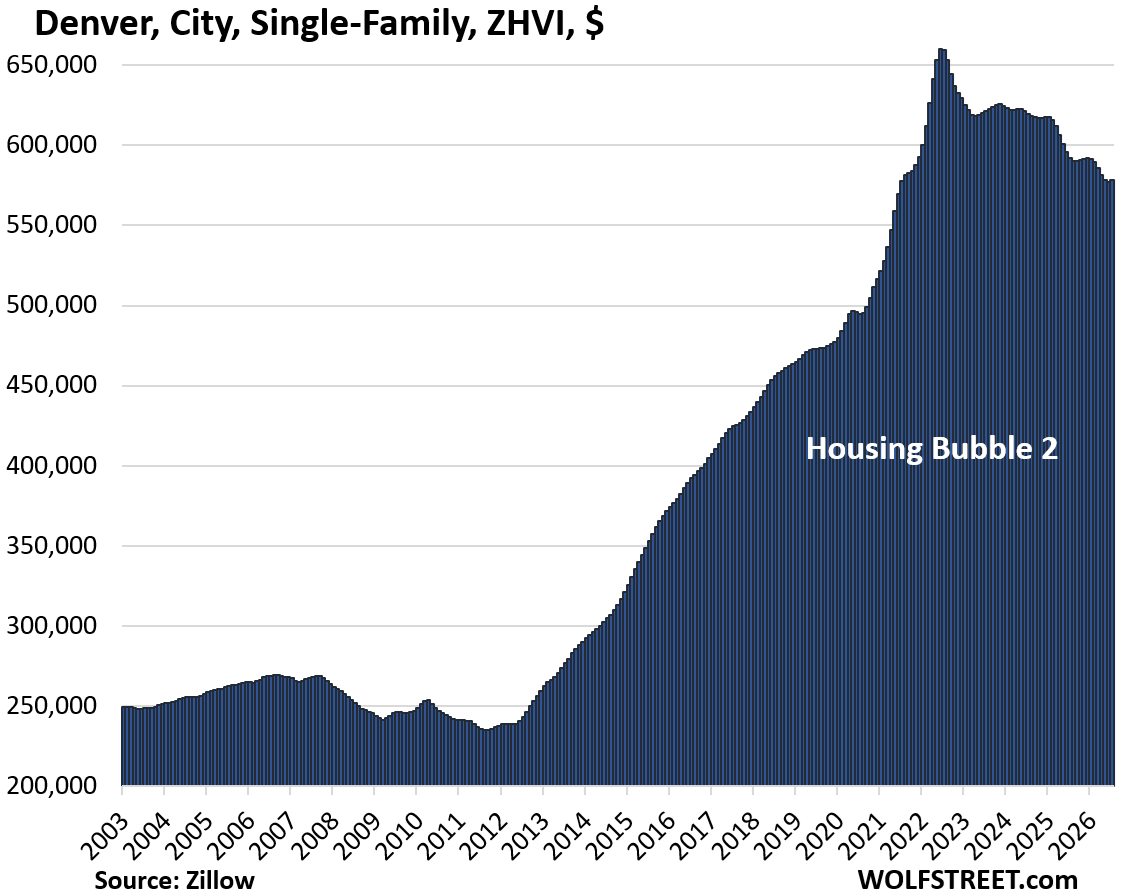
| 11 | Denver | CO | -12% | 2022 |
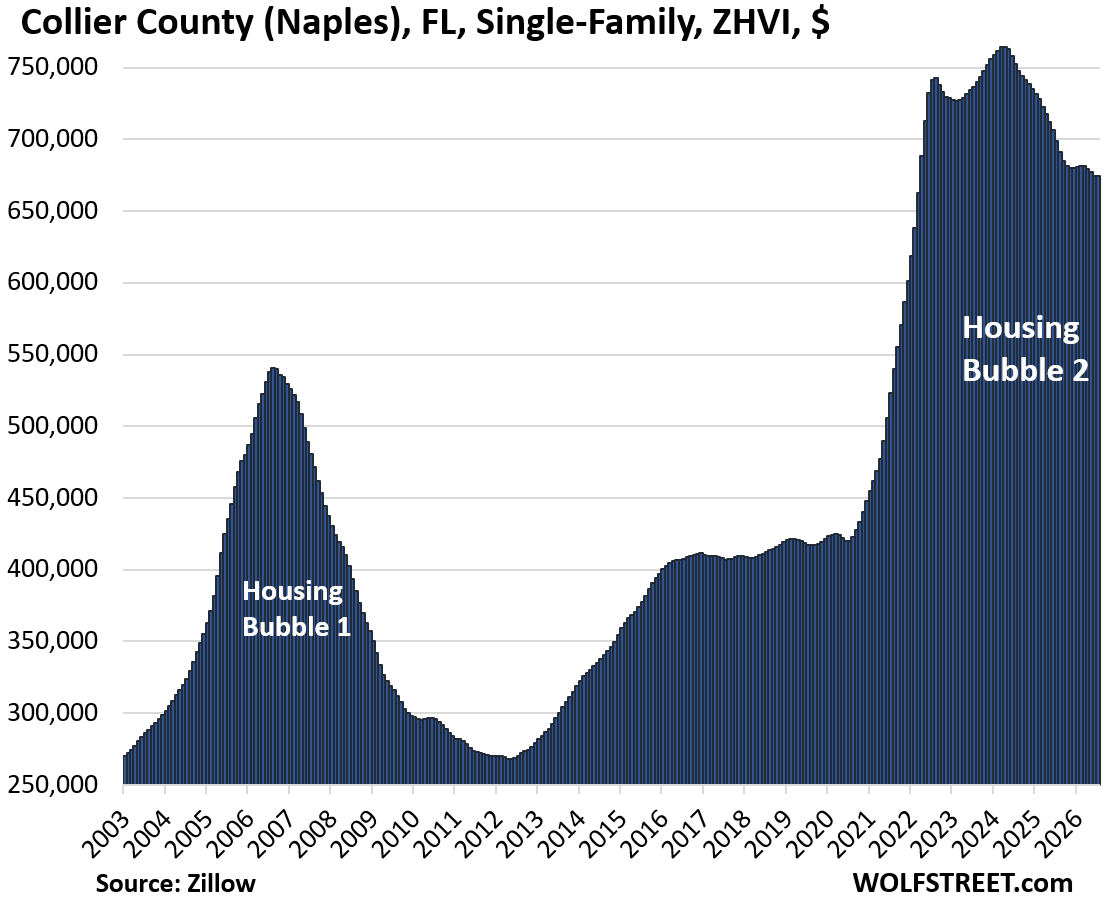
| 12 | Collier County (Naples) | FL | -12% | 2024 |
| 13 | Phoenix | AZ | -11% | 2022 |
| 14 | Aurora | CO | -11% | 2024 |
| 15 | Fort Worth | TX | -11% | 2022 |
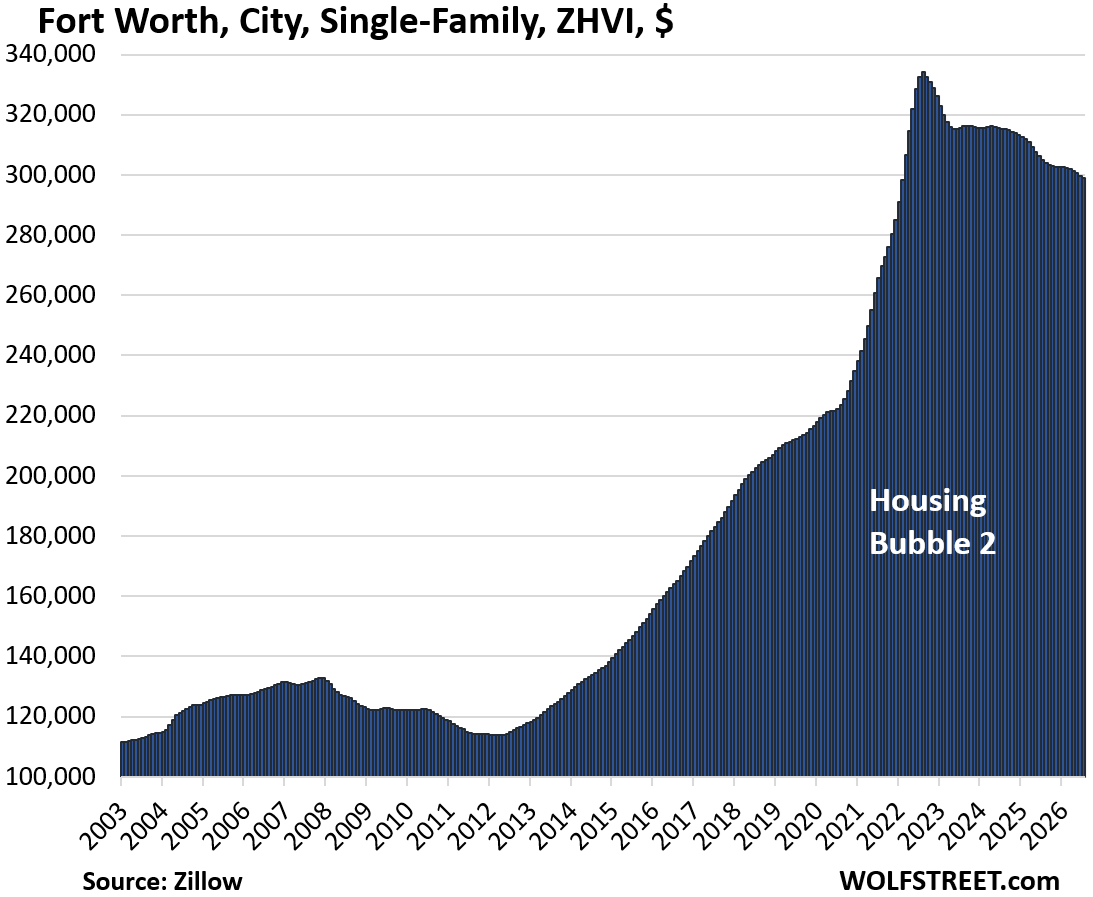
The enormous Dallas-Fort Worth area has two cities on this list: McKinney (-14%) and Fort Worth (-11%). The bigger cities in the rest of the area didn’t make the list, including Frisco (-10%), Garland (-9%), Plano (-9%), Arlington (-7%), and the city of Dallas (-7%). The area has for years attracted lots of businesses and people, and has been targeted by homebuilders, and lots of new developments have sprung up as part of “The Texas Miracle.” These new homes are competing with existing homes, and homebuilders have to sell these homes, which is getting tougher, and they’re buying down mortgage rates, and they’re offering lower price points, and they’re throwing incentives at buyers. And the market of existing homes feels that.
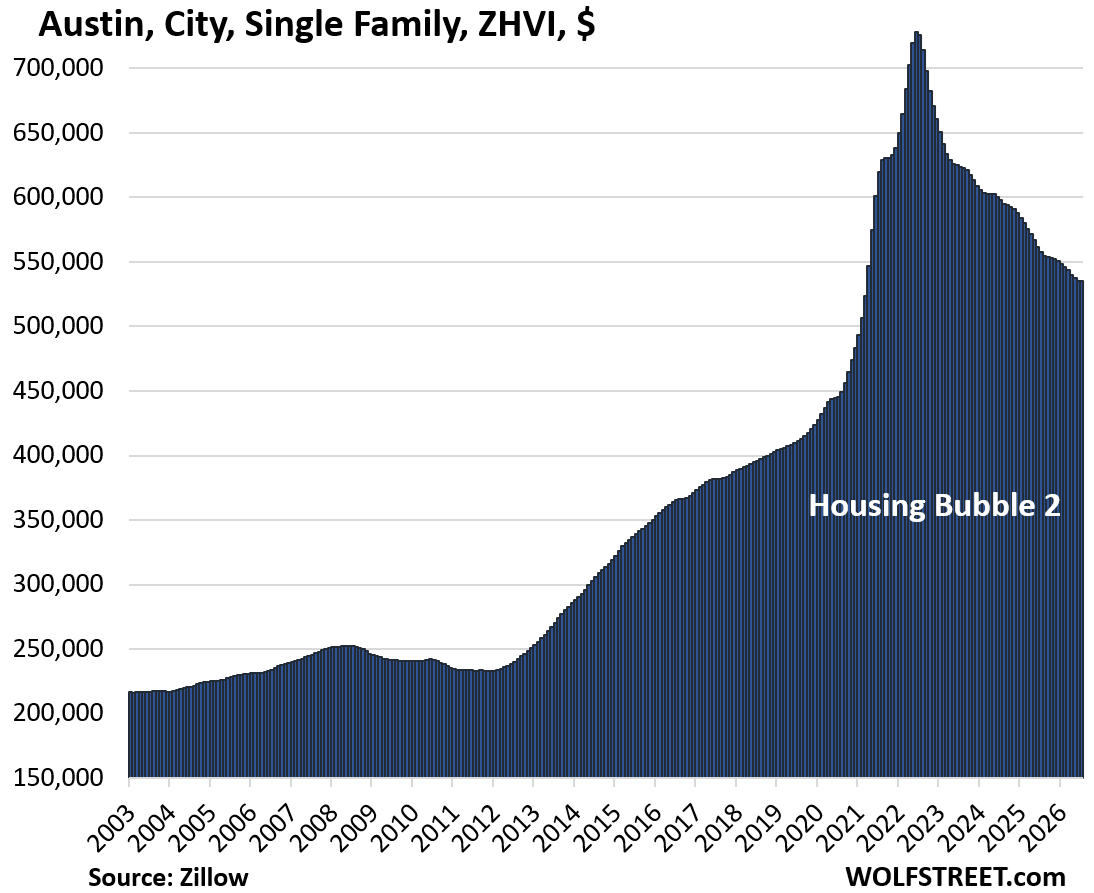
In other parts of Texas, Austin tops the list (-26%); San Antonio (-10%) barely missed the raised cut-off; but Houston (-5%) and Corpus Christi (-3%) were still at a safe distance.
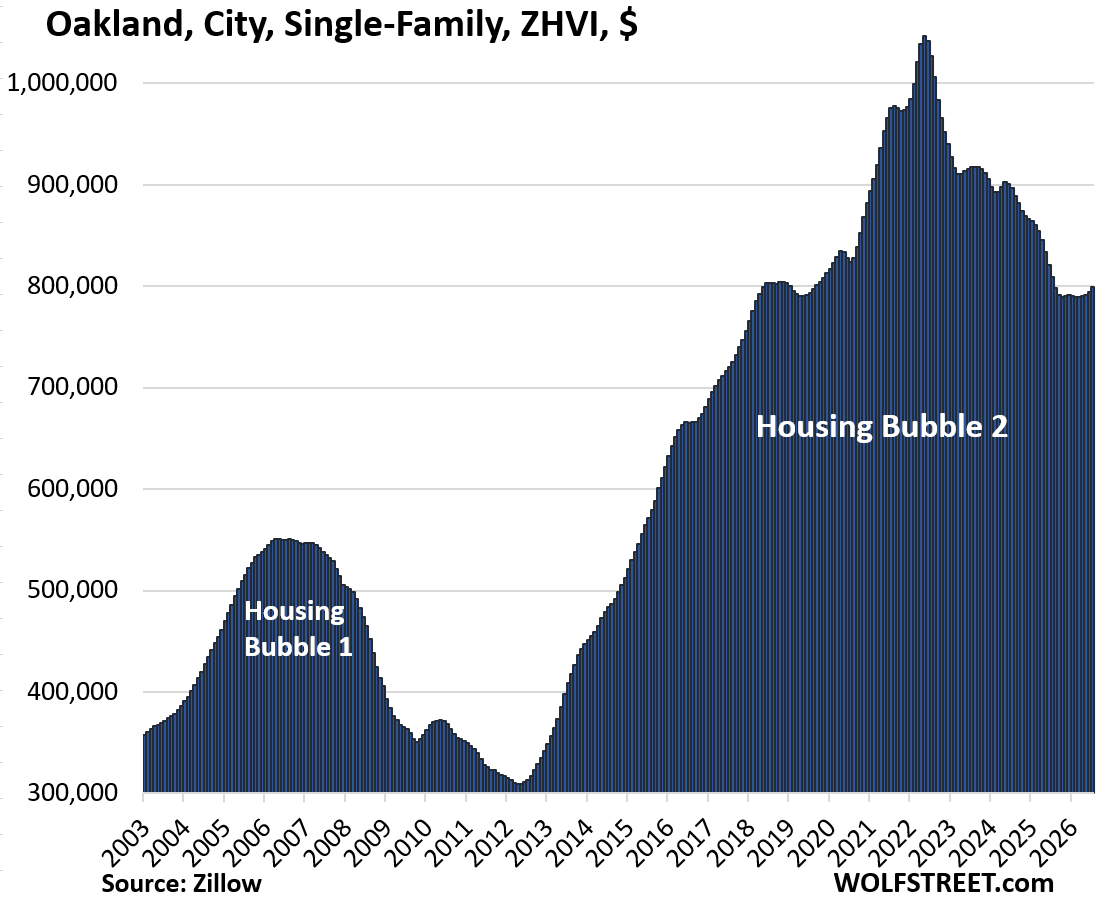
California has three markets on the list: Oakland (-24%); Hayward (-13%) on the eastern shore of the San Francisco Bay; and Contra Costa County (-12%) in the East Bay, comprising Concord, Antioch, Pittsburg, Walnut Creek, Richmond, San Ramon, and many other smaller cities.
But San Francisco, in forth position in July last year with a decline of 15%, came off the list this year (-6%) as money from AI companies, such as Anthropic, was getting thrown around left and right, piling up knee-deep in the streets, and the market started going haywire.
Among the cities in California that were still at a safe distance from the cut-off: Sacramento (-9%), Stockton (-8%), San Jose (-6%), San Diego (-4%), and Lose Angeles (-4%).
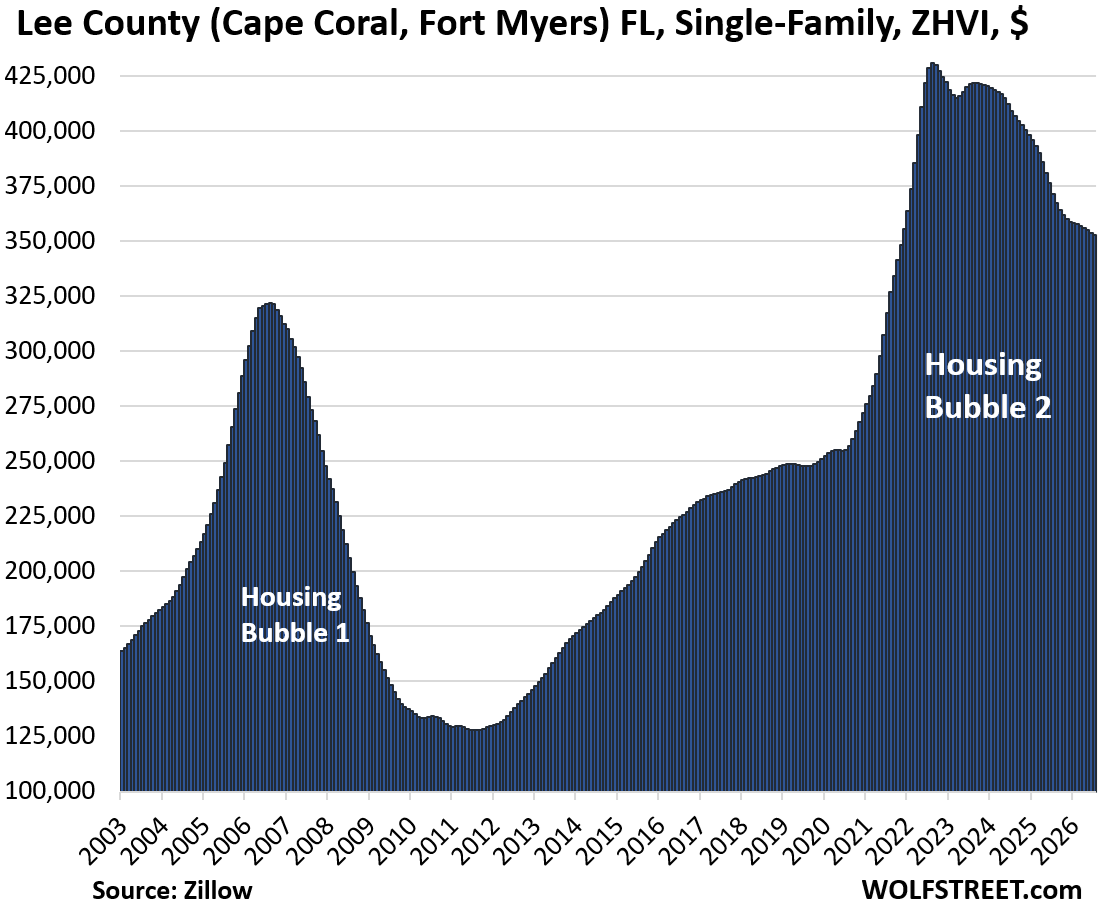
Florida has three counties on this list. The cities in these counties – many of them well-known cities – are too small to make the list, but the counties are big enough. The single-family market in Florida isn’t nearly as weak as the condo market, where the bottom has fallen out in a bunch of markets.
Didn’t make the 11% cutoff:
There are many other bigger cities where mid-tier single-family home prices have declined from their respective peaks in prior years, but by less than 11%. Here is a sample:
| City or County | From peak | Year of peak | ||
| 1 | San Antonio | TX | -10% | 2022 |
| 2 | St. Petersburg | FL | -10% | 2024 |
| 3 | Glendale | AZ | -10% | 2022 |
| 4 | Chandler | AZ | -10% | 2022 |
| 5 | Frisco | TX | -10% | 2022 |
| 6 | Portland | OR | -9% | 2022 |
| 7 | Garland | TX | -9% | 2024 |
| 8 | Plano | TX | -9% | 2024 |
| 9 | Mesa | AZ | -9% | 2022 |
| 10 | Seattle | WA | -9% | 2022 |
| 11 | Memphis | TN | -9% | 2022 |
| 12 | Sacramento | CA | -9% | 2022 |
| 13 | Colorado Springs | CO | -9% | 2022 |
| 14 | Gilbert | AZ | -8% | 2022 |
| 15 | Stockton | CA | -8% | 2022 |
| 16 | Arlington | TX | -7% | 2022 |
| 17 | Dallas | TX | -7% | 2024 |
| 18 | Katy | TX | -6% | 2022 |
| 19 | Port Saint Lucie | FL | -6% | 2022 |
| 20 | Fremont | CA | -6% | 2025 |
| 21 | Atlanta | GA | -6% | 2022 |
| 22 | Tampa | FL | -6% | 2024 |
| 23 | Boise | ID | -6% | 2022 |
| 24 | San Jose | CA | -6% | 2025 |
| 25 | San Francisco | CA | -6% | 2022 |
| 26 | Lakeland | FL | -5% | 2024 |
| 27 | Houston | TX | -5% | 2024 |
| 28 | Spokane | WA | -5% | 2022 |
| 29 | Salt Lake City | UT | -5% | 2022 |
| 30 | Orlando | FL | -5% | 2024 |
| 31 | Jacksonville | FL | -5% | 2024 |
| 32 | Tucson | AZ | -5% | 2024 |
| 33 | Durham | NC | -5% | 2024 |
| 34 | Las Vegas | NV | -4% | 2025 |
| 35 | San Diego | CA | -4% | 2024 |
| 36 | Boston | MA | -4% | 2025 |
| 37 | Raleigh | NC | -4% | 2022 |
| 38 | Henderson | NV | -4% | 2022 |
| 39 | Nashville | TN | -4% | 2023 |
| 40 | Los Angeles | CA | -4% | 2024 |
Methodology and data: These prices are seasonally adjusted three-month averages of single-family mid-tier homes in “cities” or “counties.” All data here are from the Zillow Home Value Index (ZHVI), which is based on millions of data points in Zillow’s “Database of All Homes,” including from public records (tax data), MLS, brokerages, local Realtor Associations, real-estate agents, and households across the US. It includes pricing data for off-market deals and for-sale-by-owner deals. These are not median prices.
The 15 bigger cities with price declines of 11% to 26%:
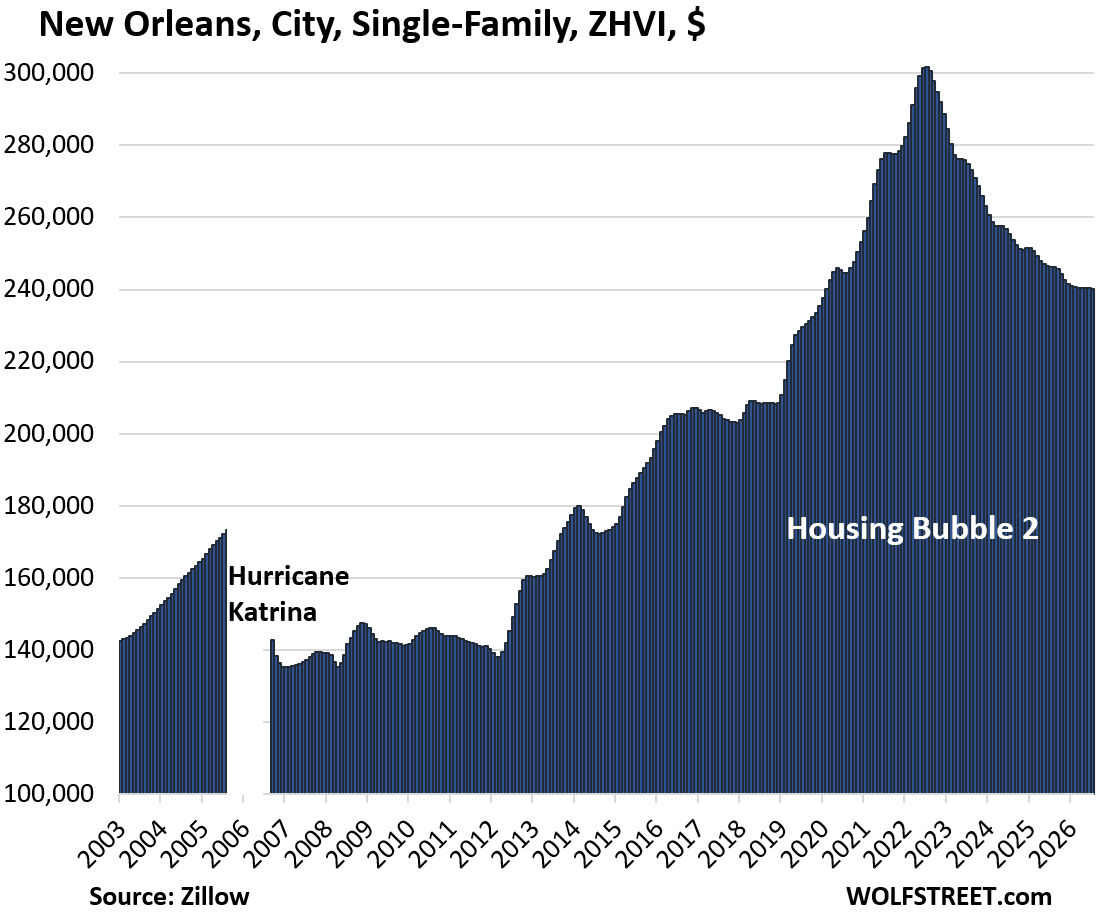
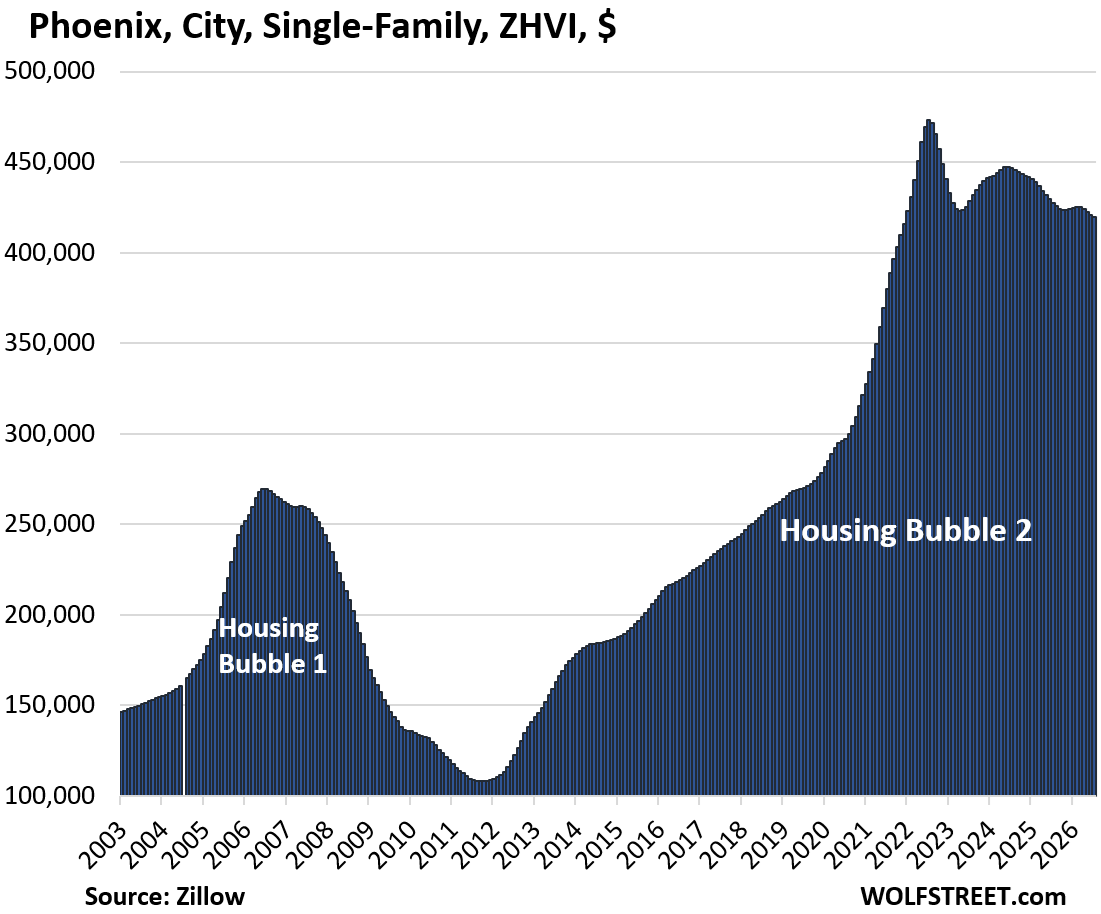
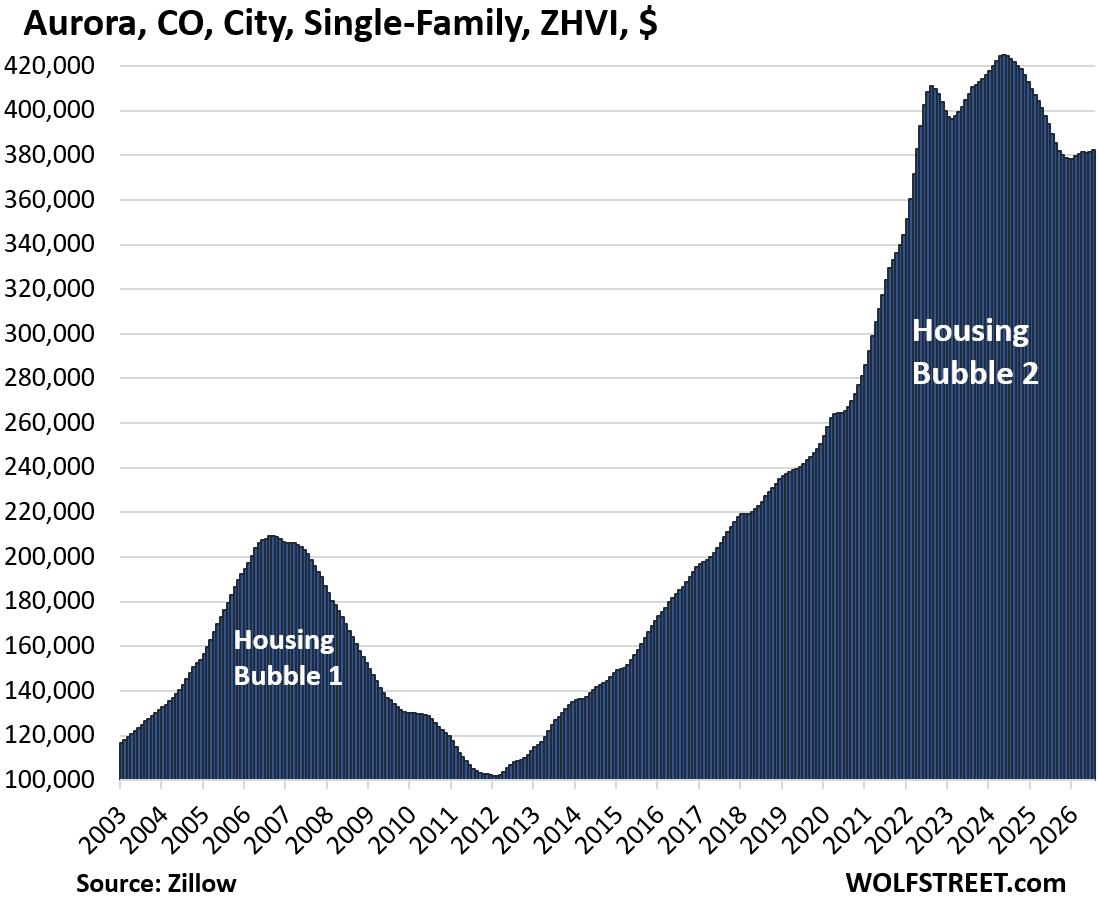
The metrics in each table from left to right: price decline from the peak, month-over-month change (MoM), year-over-year change (YoY), and the remaining increase since January 2000.
| Austin, City, Single-Family Home Prices | |||
| From Jun 2022 peak | MoM | YoY | Since 2000 |
| -26% | -0.1% | -4.0% | 157% |
| Oakland, City, Single-Family Home Prices | |||
| From May 2022 peak | MoM | YoY | Since 2000 |
| -24% | 0.6% | -1.2% | 280% |
| New Orleans, City, Single-Family Home Prices | |||
| From Jun 2022 peak | MoM | YoY | Since 2007 |
| -20% | -0.1% | -2.5% | 103% |
| Lee County (Cape Coral, Fort Myers), FL, Single-Family Home Prices | |||
| From Aug 2022 peak | MoM | YoY | Since 2000 |
| -18% | -0.6% | -6.3% | 181% |
| Sarasota County, FL, Single-Family Home Prices | |||
| From Aug 2022 peak | MoM | YoY | Since 2000 |
| -17% | -0.2% | -5.3% | 209% |
| Birmingham, AL, City, Single-Family Home Prices | |||
| From Jul 2022 peak | MoM | YoY | Since 2002 |
| -17% | -0.3% | -2.3% | 32% |
| McKinney, TX, City, Single-Family Home Prices | |||
| From Aug 2022 peak | MoM | YoY | Since 2000 |
| -14% | -0.2% | -6.1% | 150% |
| Washington D.C., Single-Family Home Prices | |||
| From Jun 2022 peak | MoM | YoY | Since 2000 |
| -13% | 0.2% | -1.2% | 269% |
| Hayward, CA, City, Single-Family Home Prices | |||
| From Aug 2022 peak | MoM | YoY | Since 2000 |
| -13% | -0.1% | -4% | 264% |
| Contra Costa County, CA, Single-Family Home Prices | |||
| From Jun 2022 peak | MoM | YoY | Since 2000 |
| -12% | -0.1% | -2.3% | 190% |
| Denver, City, Single-Family Home Prices | |||
| From Jun 2022 peak | MoM | YoY | Since 2000 |
| -12% | 0.1% | -2.4% | 206% |
| Collier County (Naples), FL, Single-Family Home Prices | |||
| From Mar 2024 peak | MoM | YoY | Since 2000 |
| -12% | -0.3% | -4.5% | 238% |
| Phoenix, City, Single-Family Home Prices | |||
| From Jul 2022 peak | MoM | YoY | Since 2000 |
| -11% | -0.2% | -1.8% | 244% |
| Aurora, CO, City, Single-Family Home Prices | |||
| From May 2024 peak | MoM | YoY | Since 2000 |
| -11% | -0.1% | -2.9% | 188% |
| Fort Worth, City, Single-Family Home Prices | |||
| From Aug 2022 peak | MoM | YoY | Since 2000 |
| -11% | -0.2% | -2.0% | 186% |
And in case you missed it: Pending Home Sales Drop to 2nd Lowest on Record, Plunge to Record Low in the West, to Near-Record Low in the South
Enjoy reading WOLF STREET and want to support it? You can donate. I appreciate it immensely. Click on the mug to find out how:


Bout time…
The bottom is not within sight…
Except Northern NV,its booming and homes are crazy priced and selling. Bulding like mad these developers don’t stop and Wshoe County is money hungry.
Condo: -15% from peak
Single family: -3% from 2022 peak:
The graphs showing the price declines are evidence of a decline in price. Do you have any statistics on the amount of homes and condos that are now sold from the peaks that you mentioned. I’m curious and I’d like to know if Price declines have spurred sales or not.
I’m trying to figure out if things would have been worse if it weren’t for the Price declines.
“Do you have any statistics on the amount of homes and condos that are now sold from the peaks that you mentioned.”
Nationally (and I know this isn’t especially helpful) sales transactions are off about 33% (from 6 million to 4 million per year) from peak 2020-2022 Goofy Bubble 2.
Absent the price declines, that 33% transaction volume collapse would almost certainly have been worse. Much worse. And still may be much worse.
The cessation of Fed ZIRP strangulation of rates (from 3% mtgs to 6%+ mtgs) almost certainly accounts for that reduction in the number of sales transactions.
(Just as Fed ZIRP strangulation from 2001 – 2022 almost certainly accounted for Goofy Bubble 1 and Goofy Bubble 2 in the first place and their related follow-on cancers).
Bottom line, aggressive Fed manipulation of interest rates for 20 years (along with being asleep/dead at the switch for follow-on course corrections) has led to almost unparalled price/volume volatility in the housing market.
(The Fed’s excuse for all of this would amount to – “If we didn’t aggressively intervene – and then go play pocket pool – China’s thorough kicking of America’s *ss would have been much more readily apparent much more quickly – giving Congress the sads, as they would had to…do something.”
Agree w/ OutWest… the bottom is nowhere in sight. These graphs are astonishing when you think about it. And I am old enough to remember the economics discussions after the last housing bubble and crash and the ensuing GFC. At that time, fairly robust arguments were made that called upon the FED to proactively eliminate asset bubbles when they arise. Oh well… I guess nobody was serious.
Aside from the last 25 years, has there ever been another time when the US economy was just unable to function without being in some kind of bubble?
Thanks WR
Slowly but surely prices are falling down and I don’t see the bottom in the near future
Its a multi year process
First condos then sfr
First few cities then more and more cities
I see some of the once hot real estate cities there
Cheaper money was available everywhere hence prices will fall everywhere as well
If we have a bust in the AI stock bubble, I wonder what these charts will look like in the ensuing years.
Interesting about San Francisco. A unique market. Amazing how many times that city’s economic epitaph has been written, only to have it come roaring back. No wonder their official symbol is the phoenix rising from the ashes.
By the way Wolf – hats off to your prescience. You said long ago the decrease in housing prices would be a long-term process. And so it is, much as I wish otherwise. Despite these initial decreases, prices are still far too high.
“A unique market”
And an absurd outlier too – along lines of NYC/Manhattan.
As internet tech gets deeper and deeper, fewer and fewer people/corps are going to be willing to enter the (already pretty idiotic) SF/Manhattan RE ThunderDomes.
Once the employment/salary/revenue/taxation/cost of living economics get ugly enough.
Witness Detroit, Cleveland, etc and etc.
That which cannot go on…stops.
San Francisco has the best weather so housing will always be premium.
San Francisco probably suffers from Prop 13 more than any other city. If you’ve owned the property for a long time, why would you ever sell with rents where they are? You’d be a fool. The question is, will prop 13 be around forever?
Rich Dad Poor Dad was a fairy tale.
Suckers who bought houses, pffft.
That’s why I live in cardboard boxes under the overpass.
Some of this is adjustment from crazy upward growth and some of this is city regulations taxes and policies like Austin where the surrounding areas are doing much better or Dallas and of course keep in mind that some areas build way more houses than other like the Austin San Antonio area has built more houses for the last 5 years or so then all of California …
“Austin where the surrounding areas are doing much better”
No, this is the entire metropolitan area of Austin–Round Rock–San Marcos, all five counties of it, single-family and condos combined, all combined -24% from peak. Some of the
Nothing goes to heck in a straight line.
Won’t it take years for the broader housing market to adjust to the increase in mortgage interest rates and property taxes based on the elevated values courtesy of the low mortgage rate era?
Are some other countries experiencing similar issues?
“Won’t it take years”
How long did it take during Goofy Bubble 1? (2002…2007, then 2008 hit…)
That said, I am a bit surprised that we’ve only seen a 33% collapse in sales post 2022 unZIRP.
Most of American economic growth post 2002 has been a ZIRP fuelled illusion/delusion…so having median home prices sitting at $400k in 2026 (vs. $150k in 2002) is likely not…stable.
Yes. This is likely to look a lot more like the 1990s stagnation than the housing bubble. House prices were completely flat from 1990- 1997, which actually meant a 15% decline after adjusting for inflation. Then, incomes were rising and mortgage rates were slightly dropping, so overall mortgage payments as a percent of income dropped by ~30%.
We should expect something similar here, probably 7-10 years of slight declines, so until about 2030.
San Diego doesn’t tell the whole story. While home prices aren’t far from the top, the type of home is much better for the money.
At the peak of the craziness there were 1970s built SFHs that were going for $300K over asking. Now, the same price will get you a fully gutted and remodeled home in the same neighborhood. So prices are down much more than the initial numbers tell you.
It is a step in the right direction but it is still way way more than pre-covid. However, I think with a few more years of modest declines and inflation things will eventually return to the mean.
My friend in San Diego sold his home for 1.8 million in 2022, rented similar home for $6k/month and now thinking about similar home but more upgrades for $1.5 million.
The math is not working for him as instead of buying at 1.5million, he can rent the same home for $6k/month.
operation twist announced this am by Bessent might juice up things a smidge. glad i sold all my properties in 2022 and 2023. i’ll wait to buy again. have surfed 3 waves in my adult life starting in 80s savings and loan implosion………..
Bessent is swapping old cheap debt for expensive new debt — that’s all he’d doing, and Yellen started it.
https://wolfstreet.com/2026/08/19/bessent-doubles-yellens-hocus-pocus-treasury-buybacks-swapping-old-cheap-debt-at-a-discount-for-new-expensive-debt/
Have no fear, rates will drop and everyone will be able to afford a house. We will all be starving millionaires in our McMasions. Scott Bessent has just announced that the treasury will double the amount of bonds it will be buying back! QE “lite” is here, a big thank you from my commodity and energy portfolio!
LOL!
Interesting times.
Bessent is swapping old cheap debt for expensive new debt — that’s all he’d doing, and Yellen started it.
https://wolfstreet.com/2026/08/19/bessent-doubles-yellens-hocus-pocus-treasury-buybacks-swapping-old-cheap-debt-at-a-discount-for-new-expensive-debt/
If there’s a flood of inventory, I can see house prices falling below replacement costs, but not for long.
And Trump is trying to bring down lumber prices by eliminating National Forest System restrictions on logging, etc.
But the S&P Cotality Case-Shiller U.S. National Home Price Index (CSUSHPINSA) is still hitting new highs.
Here in the Coachella Valley (Palm Springs – Palm Desert area), the price of affordable SFRs started to soften in the spring. However, now that we are only 2 months away from the start of next tourist season, new listings are popping up with optimistic pricing.
There are thousands of short term rentals in this market, the question now becomes what happens if the rental market continues to soften. Will the hedge funds, private investors and Canadians finally have had enough and will they put their properties up for sale in numbers. Post 2008, there was a half price sale that lasted roughly from 2009 to 2012. There were entire neighborhoods in which every other house had a for sale sign in the yard.
Regarding commercial real estate, we are still seeing an abundance of caution from most lenders across most CRE sectors within small-balance commercial real estate ($1,000,000 to $20,000,000).
I purchased my 2,400 sq ft home on Cape Cod at age 36 for 200K using a10% 15 year fixed rate mortgage, and I paid it off in 12 years. Like many people in my neighborhood, these price swings are irrelevant assuming that the property is inherited tax free by a family member.
Yep. Post-divorce I purchased a home in an adjoining (better) neighborhood for 170K with a 15 year fixed at 2.9% Rates where low and the ex had to buy me out of the old home, so I had lots of cash. Paid it off in 5 years. It really was silly how many times I was approached to refinance in 2019, you’d think these idiot/criminal financiers would do some homework on the existing mortgage terms before wasting their time.
A drop in a massive bucket.
When I look at those ‘mountain’ type graphs that show Housing Bubble 1 and Housing Bubble 2, i can clearly see that the price corrections are just a small fraction of what they need to be. We are still in the midst of the biggest financial bubble of all times. One for the history books!
Austin being down 26% from its peak is striking, especially compared with markets that have barely moved. It really shows how differently individual housing markets are behaving depending on local supply and demand.
Does the Washington DC data include surrounding counties? We have three big million-ish person counties surrounding DC: Montgomery and Prince George’s in Maryland and Fairfax in VA.
This is the District of Columbia.
It’s not enough. The cost of EVERYTHING is so great, house prices will have to correct in a very big way to unlock the market.
Hopefully this continues for a decade.
I’m seeing a LOT of properties in the San Antonio market offered for sale by big institutional investors (hedge funds) being listed by brokers out of Dallas who specialize in these types of listings. The only problem is they pay less than typical commissions so local agents won’t even show these properties unless specifically requested to do so and they have really terrible & slow communication. I saw one agent leave a comment about how they didn’t hear back from the broker for 3 months on a full price offer! So on these properties DOM is going up and prices are going down.
Folks, if you look at these charts, the drops from 2022 peak is nothing, except for maybe Austin and a couple others. Even after these drops, prices are still 2 and 3x what they were in 2011-2012