
Stuck in the mud at the bottom for a 4th year, after the 2020-2022 home-price explosion.
By Wolf Richter for WOLF STREET.
Pending sales of existing homes dropped another 2.3% in July from June, seasonally adjusted, to the second-lowest on record, a position shared with July 2024. The record low in the data occurred in January this year.
Compared to the already stuck-in-the-mud levels in July a year ago, sales dropped by 2.2%, according to data from the National Association of Realtors today, whose “pending sales” data only goes back to July 2010 (its “closed sales” data goes back to the 1980s). Sales declined in all regions, but plunged in the West to record lows and fell sharply in the South and Northeast.
Compared to July 2021, pending sales have collapsed by 36%, compared to 2020 by 41%, and compared to the Julys in 2018 and 2019 by 33%. Compared to July 2010 during the big bad Housing Bust, sales are down by 9%.
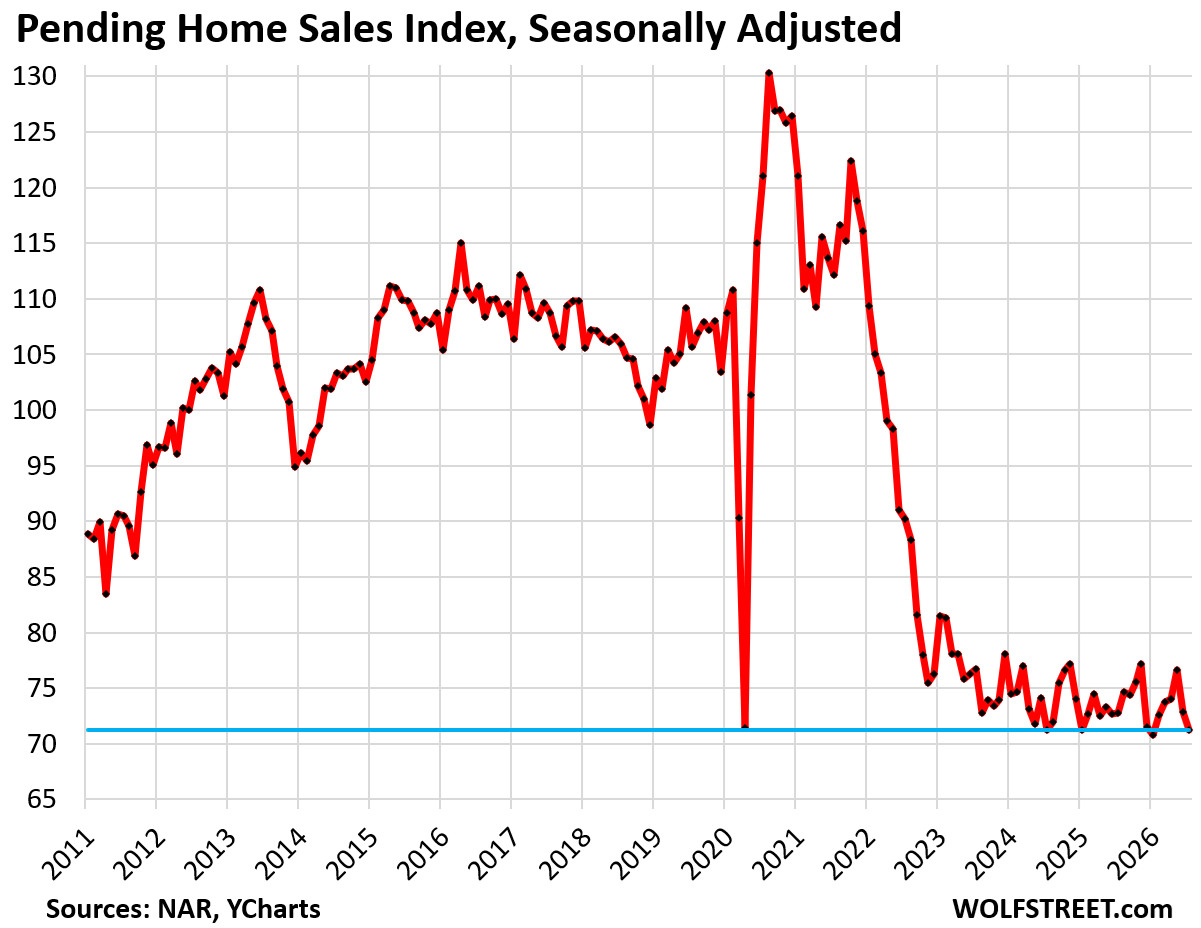
The housing market is now in the process of completing the fourth year that sales have remained mostly below the lows of the Housing Bust, stuck deeply in the mud at the bottom, after the home-price explosion from mid-2020 through mid-2022, and now amid the highest supply of existing single-family homes in 10 years.
The NAR’s metric of pending home sales tracks contracts that were signed in July but that haven’t closed yet and could still get canceled for whatever reason. The rate of cancellations has been running high.
Pending home sales are a preview of what is coming in terms of closed home sales.
Pending home sales by region.
A map of the four Census Regions is posted at the top of the comments below.
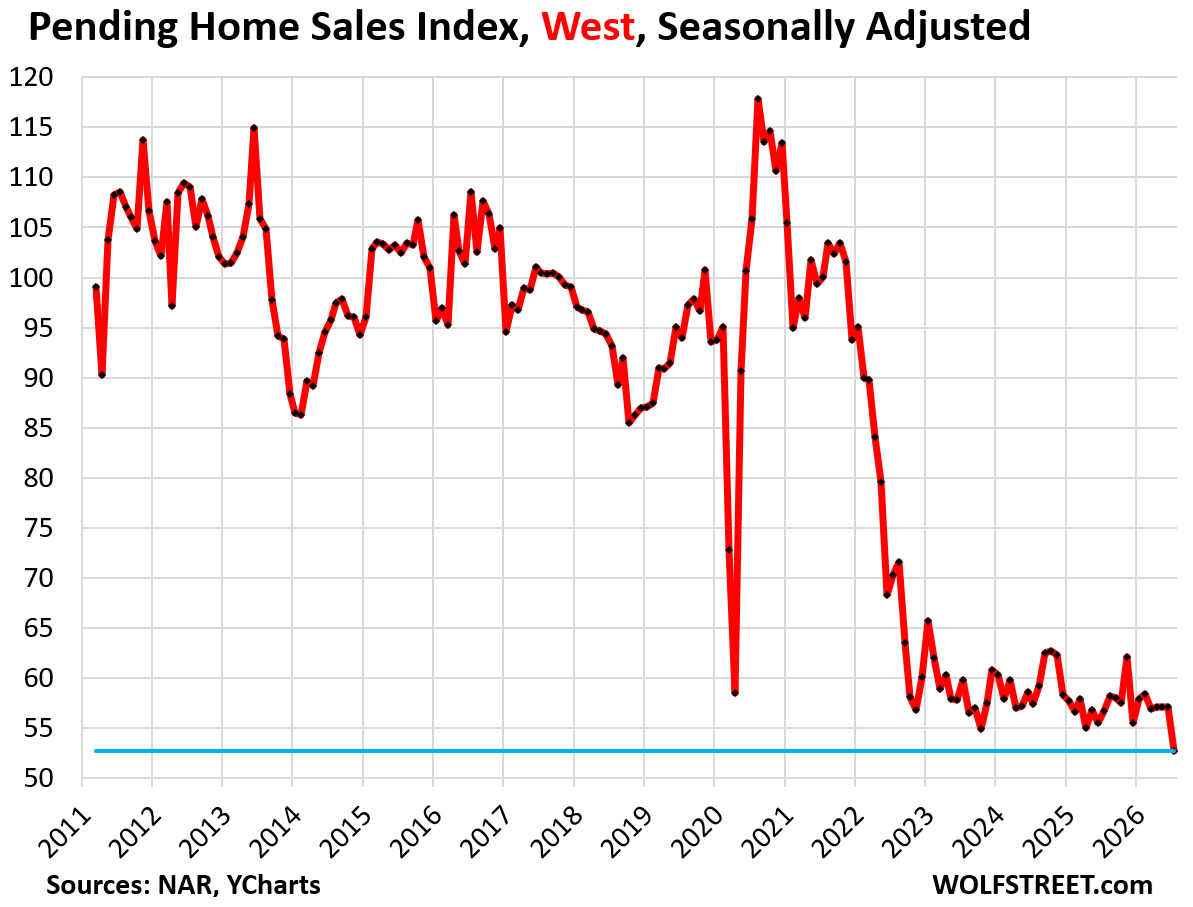
In the West, pending sales plunged by 7.7% in July from June, seasonally adjusted, to a new record low in the data.
Compared to July in prior years:
- 2025: -7.1% (year-over-year)
- 2024: -8.2%
- 2023: -11.9%
- 2022: -25.0%
- 2021: -47.4%
- 2019: -43.9%.
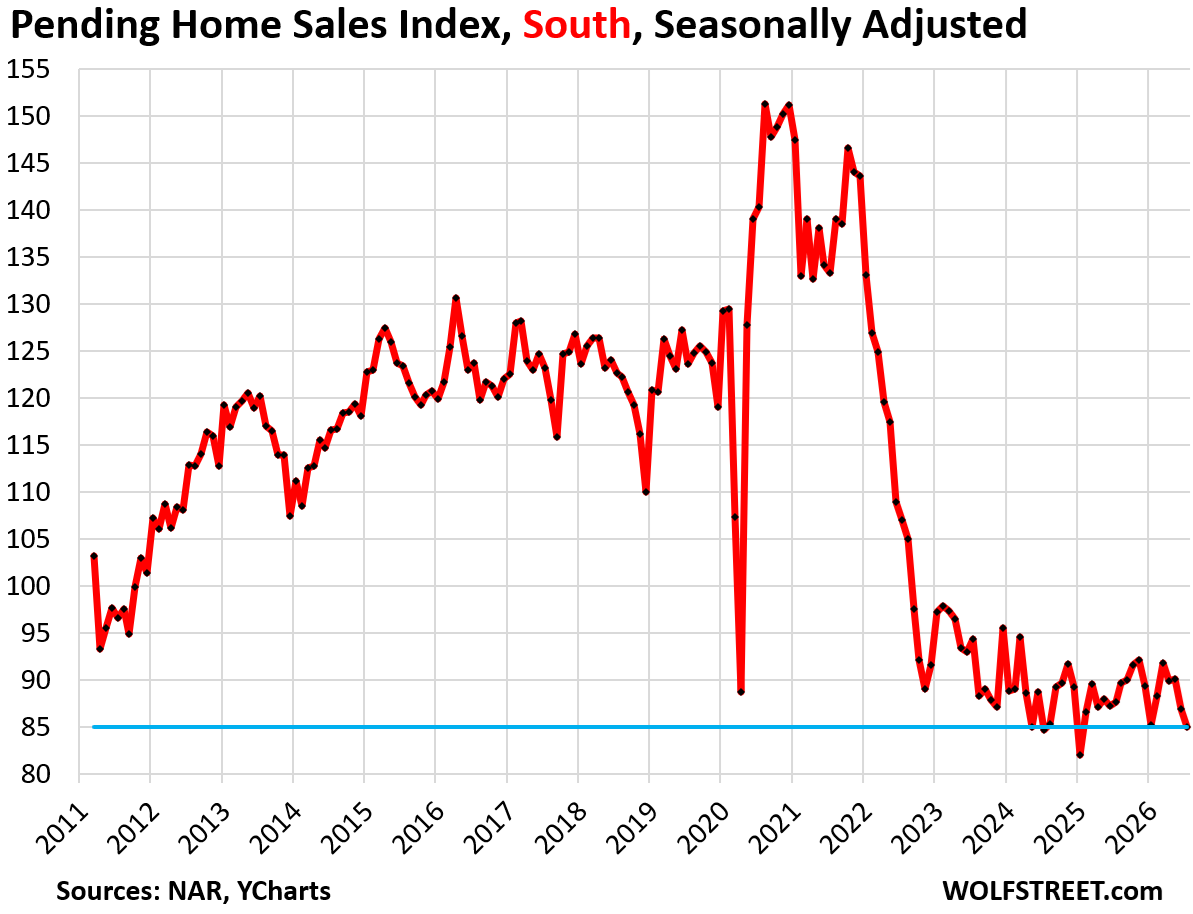
In the South, pending sales dropped by 2.2% month-to-month, seasonally adjusted, with only three other months being as low or lower.
Compared to July in prior years:
- 2025: -3.0% (year-over-year)
- 2024: +0.5% (second-lowest month on record).
- 2023: -9.9%
- 2022: -20.6%
- 2021: -36.2%
- 2019: -32.2%.
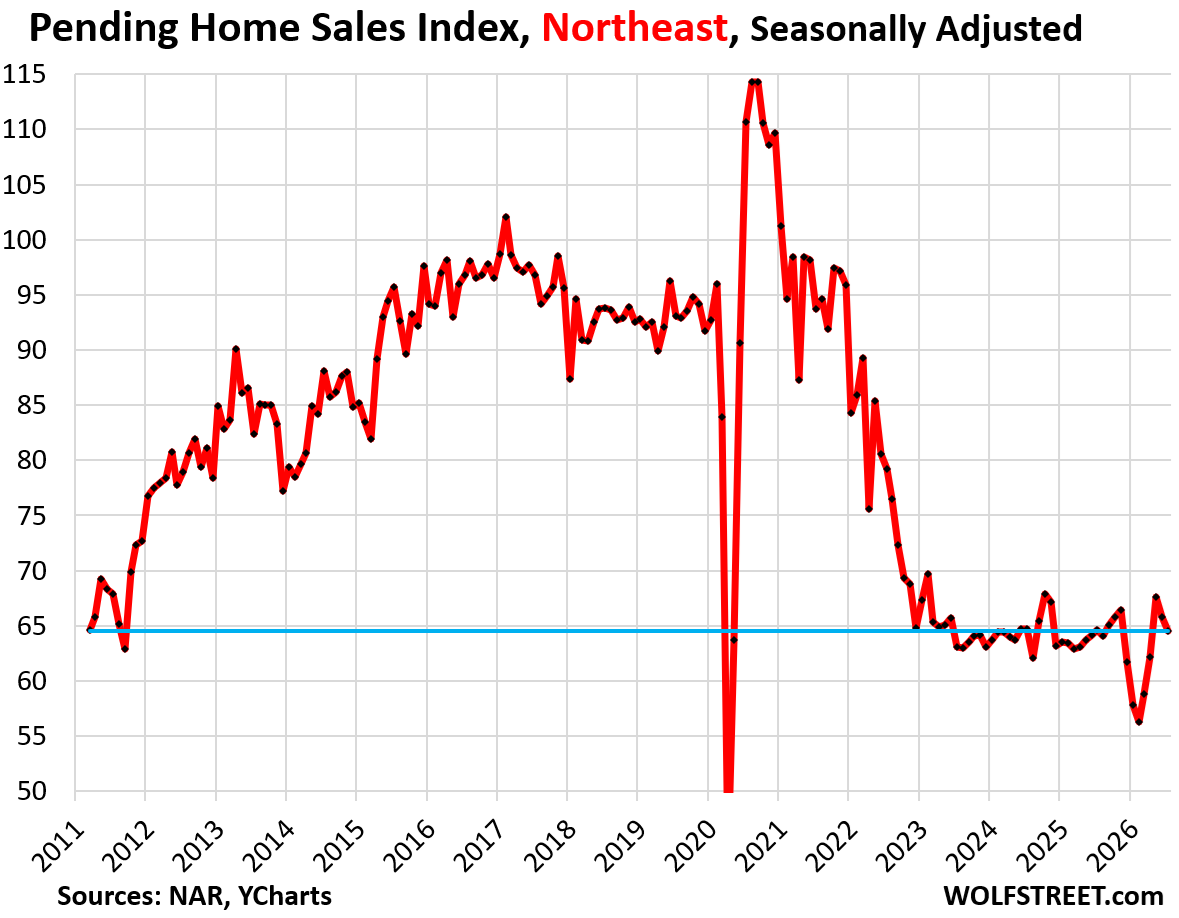
In the Northeast, pending sales fell by 2.0% month-to-month, seasonally adjusted.
Compared to July in prior years:
- 2025: -0.2% (year-over-year)
- 2024: -0.3%
- 2023: +2.2%
- 2022: -18.6%
- 2021: -31.2%
- 2019: -30.7%.
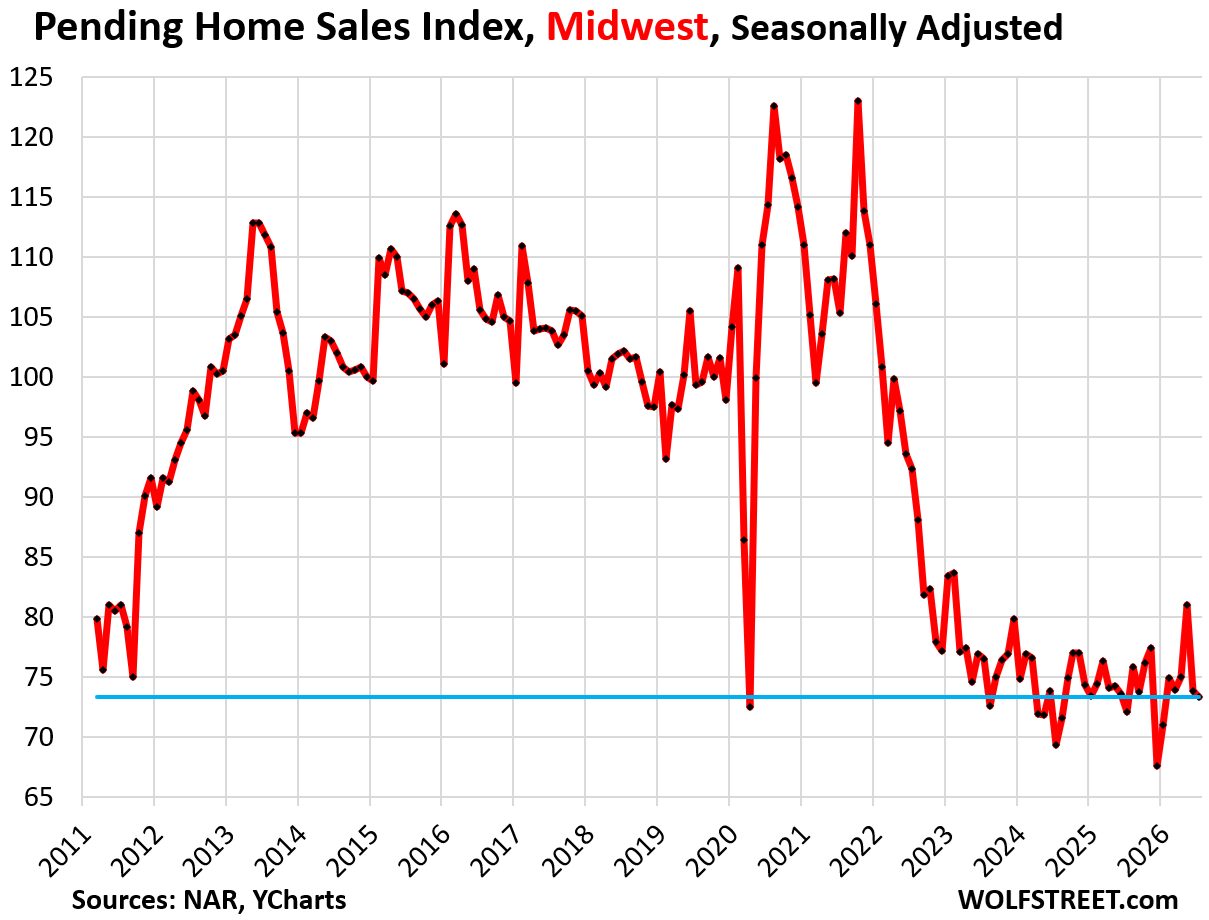
In the Midwest, pending sales declined by 0.7% month-to-month, after the 8.9% plunge in the prior month, seasonally adjusted.
Compared to July in prior years:
- 2025: +1.7% (year-over-year)
- 2024: +5.8%
- 2023: -4.2%
- 2022: -20.6%
- 2021: -30.4%
- 2019: -26.2%.
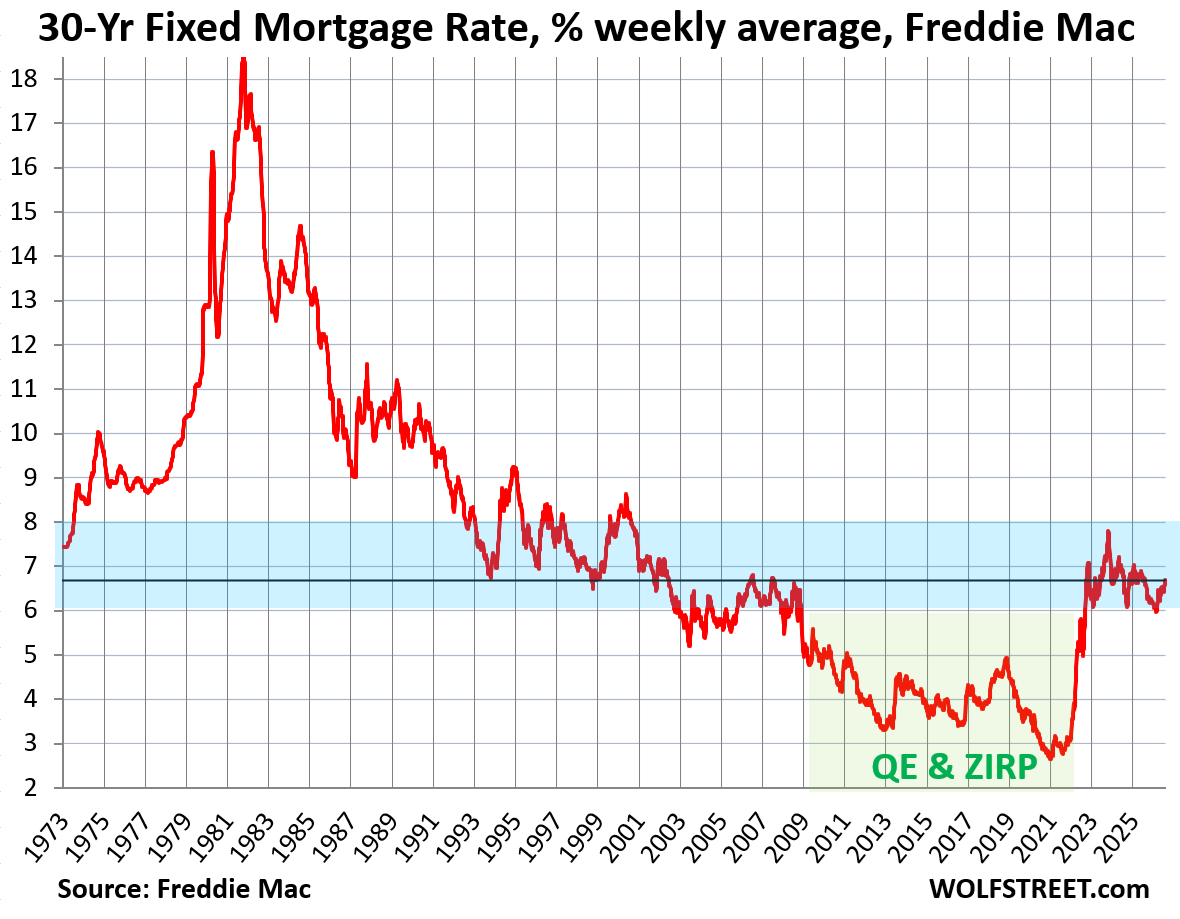
Mortgage rates in July were in the 6.4% to 6.7% range, according to Freddie Mac’s average weekly mortgage rate data. Mortgage rates have been in this range since September 2022.
In the decades before 2009, before the Fed’s QE and zero-interest-rate policy began to distort the markets, mortgage rates were about as high or much higher than today. These are fairly normal mortgage rates in a historical context. They’re not too high. What’s too high is inflation. The housing market – buyers, sellers, and the entire industry in between – needs to get used to those rates.
These mortgage rates are only high in the context of the QE-era when the Fed “printed” trillions of dollars to purchase trillions of dollars of Treasury securities and MBS in order to repress interest rates and mortgage rates, and thereby inflate asset prices and home prices, eventually triggering the worst consumer-price inflation in 40 years and the worst home-price explosion on record. As a result, home prices have overshot what the market can bear, have inflated homeowners’ insurance premiums and other carrying costs that sap consumer spending elsewhere, and have become a liability for the housing market and for the economy.
In case you missed it: Sales of Existing Single-Family Homes Sink Deeper into Mud, Supply Jumps to 10-Year High, Condo Supply at 14-Year High
Enjoy reading WOLF STREET and want to support it? You can donate. I appreciate it immensely. Click on the mug to find out how:


The four Census Regions of the US:
Most people think a house is a great investment whereas it can actually be a money pit. Buy at inflated prices with a 6.5% 30 year mortgage=A ton of interest that is no longer the tax write-off it used to be. Add in property taxes/home insurance/HOA fees/maintenance and renovations over those 30 years and you have a whole lot of expenditures.
Do some math people.
I agree—timing is everything. People who bought homes in my neighborhood over the past decade have seen their values nearly double. They may give back some of that appreciation in today’s softening market, but I doubt prices will decline enough to erase most of those gains.
My wife and I returned to land two years ago after living on a sailboat for several years, and we’ve deliberately chosen to rent rather than buy. We recently ran the numbers again, and at today’s prices, renting is considerably cheaper for us.
It’s not just the purchase price. You have to include property taxes, insurance, HOA and amenity fees, maintenance, repairs, and eventually things like a new roof or HVAC system. And for a cash buyer, there’s another expense that’s easy to overlook: **the opportunity cost of the money tied up in the house.** That cash could otherwise be earning interest or invested elsewhere.
A home can certainly be a good investment, but buying a home and making a good investment are not necessarily the same thing. **Price, timing, financing, and the alternatives available for your money all matter.**
Realtors are hanging out at intersections now. It has gotten bad!
😆
/s
EHS/PHS – U.S. existing/used/resale housing market has reached equilibrium with buyers, price and rates. Yes, it’s frozen. Existing sellers aren’t reducing price much, so the Mexican standoff continues. Used house sales is the largest part of the market vs. new.
NHS – Builders are more pragmatic and are cutting via incentives and actual price cuts, but also reaching a price point where it’s difficult to attract buyers.
EHS/PHS: Most used house sellers aren’t feeling pressure to sell yet, since their stonk portfolios are still good, but a stonk market crash would change that pretty quick. Think AI bubble.
NHS: Builders will need to keep cutting at the expense of profit margins. New house build quality is generally poor. Also, they’re ugly with open floor plan and gray/dark color schemes. I wouldn’t buy new.
Then: Pandemic rates at 2-3% drove prices to the moon (i.e. 30-50% increases).
Now: Mortgage rates are 6.75%, but prices are only starting to adjust lower. Don’t forget all the higher carrying costs now due to the accumulated inflation.
Overall: Mean reversion will happen, but housing is an illiquid asset and takes years to return to the long-term trend. This is another way of saying that real estate – all asset classes – are cyclical. We’ll get there when we get there, but don’t hold your breath (read years). Oh, and don’t forget demographics. Boomers are aging out. HH formation is low and still declining. Who will buy?
Without a recession (job losses) demographics will eventually bring more homes on the market, but high job areas will remain popular, housing prices largely stable, the first signs of price drops will be rural areas, vacation homes. Unless, the Democrats come into office and open the immigration floodgates, which will delay housing price drops.
If we look at participation rate in the job market is pretty low at 61.4%. Peak Covid times, it was 60.5%. Great Recession was 66%. So, I don’t think we will see a recession in jobs to cause a bubble burst. I believe costs will cause the bubble to burst.
The participation rate you cite is dragged down by the massive wave of boomer retirements. I discuss this participation rate every month on the first Friday of the month, including most recently on Friday Aug 7:
https://wolfstreet.com/2026/08/07/private-sector-gains-30000-jobs-local-governments-shed-57000-jobs-supply-of-labor-continues-to-shrink/
Quoted from my article:
The prime-age labor force participation rate ticked up to 83.4% in July, after the drop in June (blue in the chart below). The three-month average, which irons out some of the squiggles, declined to 83.5%. This range has been the highest in over 20 years.
The prime-age labor force consists of people between 25 and 54 years old. It eliminates the issue of the retiring boomers. When people retire and stop looking for a job, they’re no longer “participating” in the labor force but remain in the population until they die. It’s the surge of boomer retirements over the past 15 years that has pushed down the overall labor force participation rate .
Rural areas don’t really boom, so there’s not much bust potential.
Looks like nobody will want to buy.
^^^This — without forced selling or fear…markets just gonna stand still.
Unfortunately what it would take to bring housing prices down would be pretty bad for a lot of people.
Don’t forget the IRA(Inflation Reduction Act)of $1.3 Trillion by the Biden Administration. Go figure…
If supply is at its highest levels in a decade and demand is on the floor, why aren’t home prices moving? I’m at the point where I’m thinking of buying my first home but I’m just not interested in buying at these prices when I can rent for $1.5-2k less per month over property tax, insurance, and maintenance. Market does not appear to be doing its job here but unsure where to assign blame other than locked in QE rates and misguided programs like Stay NJ that artificially deflate property taxes for the wealthiest generation and force the burden onto working families.
“why aren’t home prices moving?”
Home prices ARE moving, but not in lockstep in every market. For example, here are former highfliers Austin (-27%) and Oakland (-25%). I wish people would read my articles so I don’t constantly have to re-post this stuff in the comments. From the article I published yesterday:
https://wolfstreet.com/2026/08/17/prices-of-mid-tier-homes-in-33-big-expensive-cities-in-america-july-2026-update/
They’re moving in a few markets, but in most it’s not enough to make a difference. 40% run up, followed by 5% drop doesn’t help many people.
A lot have seemed to flatten out. I feel like Denver has been in the 10-12% range for a couple years now. It needs to be down at least 25% to be reasonable relative to wage growth
Published a little while ago, right up your alley, in terms of Denver:
Oh Dear, Prices of Single-Family Homes Fell by 11% to 26% in 15 Bigger Cities Already
Because most people don’t have to move and the subprime borrowers don’t exist anymore, so very few existing homeowners need to sell. So they can all just wait.
Yeah but Wolf, despite the market stagnation and contagion, prices are still double or more the bust lows, even in Austin and Oakland. These are likely all the 2.75% mortgages from Covid, where people simply aren’t selling.
Now add 15 years of wage increases through 2026 + the price declines, since 2022, so you see it’s gotten a lot better.
It’s always funny when people think housing prices should collapse by 80% overnight so that THEY can buy a cheap house, and if prices take years to come down it’s nothing. Renting has been cheaper in both cities than buying an equivalent home, and people who did, didn’t lose money on the house when prices declined. But at some point, that’s going to balance out.
Personally I’ve received a record number of those realtor we want to sell your property type mailers at my primary home.
Just wondering what will be the final item that bursts the dam in housing besides just slow time.
Going to a fun show to see over the incoming years.
Likely one of two things –
1. The ai stock bubble bursting and snowballing through the economy because of leverage
2. Ai replacing a large enough % of white collar workers
And yet house prices (even at current level below the peak in miat markets), grew by much faster rates than inflation over the last 30 or 40 years. They might still have another 20 percent to drop.
Well, maybe this is the give back for the next decade. If inflation is now 3-4% and houses stay flat at best, that’s a 33-45% drop in house “values” relative to everything else.
People seem to think that there will be a 20-50% crash in house prices then they’ll swoop in and buy that mansion at the end of the street for a song. Instead what’s going to happen is what Wolf showed here. A sad, sparse market grinding on and on. People will only buy or sell if they HAVE to, and the sellers know they probably won’t see any appreciation for a long time, and the buyers know that this is the best offer they are going to get for a long time. This is when everyone feels sick after the deal.
yep
This is correct. And inflation adjusted house price is not the metric to follow, it’s monthly payment as a fraction of income (I.e. affordability index).
This is actually a very likely scenario
California should be in a separate region all by itself as it is by far the largest housing market by any standards in the US and nothing like the much smaller surrounding markets in the Western Region.
@BigFatUglyBubble when you say “Most used house sellers aren’t feeling pressure to sell yet, since their stonk portfolios are still good, but a stonk market crash would change that pretty quick. Think AI bubble.”
I agree that we have an AI “bubble” but few people will be forced to sell their homes if the stock market crashes. Google says: “The wealthiest top 10% of American households own roughly 87.4% of all U.S. corporate equities and mutual fund shares.”
Only a tiny number of the top 10% will have “pressure to sell” and even a smaller number of working class guys who have been maxing out their 410Ks and buying into S&P index funds for the past decade will have “pressure” to sell even if every AI stock went to $0.
I don’t know how big a factor overall the “buy, borrow, die” crowd is. In the high end market I left last year virtually all 1M+ houses sold for cash. Many of these are second homes or vacation rentals. I doubt anyone is cashing out their equities and paying capital gains to raise those funds, as long as the S&P is appreciating faster than the borrowing cost and their cost basis is stepped up for their estate this is an attractive proposition. A significant increase in borrowing cost or a reversal in the stock market might change that.
AI-
I can’t verify your numbers, and I don’t have a supporting chart, so I’ll just leave this comment, and say that it’s reasonable to expect that house and stock prices are correlated.
The Fed has targeted “the (paper) wealth effect” for both rising house and stock prices esp. since the 2008-09 GFC. The response to the COVID-19 pandemic was a continuation of this on steroids. The wealth effect is just another way of saying blowing asset bubbles, but asset bubbles always burst. It cuts both ways when prices decline on the way down. This is artificial, temporary “wealth.”
W R discusses this in the housing market in his comment, above, and in his longer posts, e.g. “The Most Splendid Housing Bubbles in America”.
washingtonpost.com > Opinions
What the Fed did and why: supporting the recovery and sustaining price stability
By Ben S. Bernanke
Thursday, November 4, 2010
“Easier financial conditions will promote economic growth. For example, lower mortgage rates will make housing more affordable and allow more homeowners to refinance. Lower corporate bond rates will encourage investment. And higher stock prices will boost consumer wealth and help increase confidence, which can also spur spending. Increased spending will lead to higher incomes and profits that, in a virtuous circle, will further support economic expansion.”
Should we consider pending sales levels 2013-2023 to be “high”, with current sales returning to a more “normal” level?
In the same way we should consider 2013-2023 mortgage rates “low,” with current rates returning to a more “normal” level?
These pending sales here are an indicator of what closed sales will look like. The two are similar, with the difference being canceled sales, which fall out of the closed sales figures.
These pending sales figures here include single-family, condo, and co-op and only go back to 2010. The closed sales figures for single-family (chart below) go back to 1989, but do not include condos and co-ops, so they’re a little lower. It shows what periods were “high” what periods were “low” and what is “normal” (maybe there is no normal, just boom and bust?).
Also note that since the beginning of this chart in 1989, the number of US households has grown by 45%, from 92.8 million in 1989 to 134.8 million in 2025. So logically, transactions should be up by 45% since 1989. But they’re up by only 23%.
“Also note that since the beginning of this chart in 1989, the number of US households has grown by 45%, from 92.8 million in 1989 to 134.8 million in 2025. So logically, transactions should be up by 45% since 1989. But they’re up by only 23%.”
I would also add that a lot of houses have been built since 1989.
We have significantly more people and more physical houses.
I’d love to see a metric for home sales that factors in both total population and total number of houses that existed at each data point.
That seems like it would give a better visualization the housing market over time.
If the housing stock grows in parallel with households, it doesn’t matter which you use for your comparison.
If you want to look at the total US housing stock, and the growth since 2002, and at vacant housing units, you can do it right here:
https://wolfstreet.com/2026/07/28/growth-of-the-vacant-housing-stock-in-the-us/
🏡💰💥PENDING HOME SALES COLLAPSE 🏹Down 30% From Peak Housing Market Deep Freeze 🥶Real Estate Agents Working Walmart Delivery 💥💰🏦
MW: Mortgage rates could move even higher — dealing a fresh blow to home buyers
I think the masses are starting to learn that 6.5% may become the new lower end of the normal for many many years to come.
Won’t be shocked to see in the next 10 – 15 years the range to always be between 6% and 8%. Like it should have been all along.
I have been for a few years on “buyers strike”,lately seen some lands considered possibly doable but am now on “stupid realtors strike”,can’t get back in any timely fashion and cannot answer a few basic questions that will make or break a deal,do not want to waste my time or theirs.
Out of ten recent inquiries over last 5 months or so only 2 out of 10 could do their job in a reasonable fashion and,the anwers they gave me killed the deal(i.e. the ability to build a large workshop-non commercial).
I will just rent.
Skip the RE agent and talk directly to the local planning dept. Or, be brave and just build without a permit. :-) No law against building a garage as long as set backs are observed. What you do in your garage is your business as far as most people are concerned.
Paul,while I would if I made a offer first double check/make a contingency feel tis the realtors job to have basic info. or look it up,am spending probably a minimum of a half a million,feel that is a nice percentage to realtor to actually function.
“Or, be brave and just build without a permit.”
Plane surveillance makes that a poor choice these days. Counties are all over that. They want the tax revenue and the power and control.
I’ve considered getting my realtors license just so I can see properties without a realtor….
I’ve heard it’s not a ton of work.
Wolf do you think part of the cause for the sales decline could be life style change?
1. Remote workers mean you can keep the same house and switch jobs without moving.
2. Boomers aging in their homes
3. Lower family formation and 1/3 of adults under 30 living with parents
This is a huge drop in sales despite a good economy. So there would have to be a bunch of factors coming together, including your #1. But other factors too.
Your #2 has been bandied about endlessly, but it’s nonsense. Older people have ALWAYS aged in their home. That was standard. Back in the day, there wasn’t even a choice, other than move in with the kids. I have no idea why young people today think that boomers need to somehow vacate their homes to make room for young people. Where does this nonsense come from? They’ll have to be patient until the boomers die. We had to do that too.
And there are lots of new and newer houses to buy, for sale, now, with mortgage-rate buydowns. Why do they even want the old boomer stuff? A lot of that old stuff will get bulldozed some day and replaced with something new.
Your #3 is similarly bandied-about nonsense. Boomers were the generation that left the parental home asap, lived in squalid conditions, but free from parents. We rebelled against everything, including our parents. So we bailed out early. And I mean TEENS. Get the hell outa there. Every one of my friends lived away from home in some squalid hole by the time they were 21, me included. It was a miserable shitty life, but it was our life. We met girls by staring into the whites of their eyes, not by swiping, and sex was there to be had. Young people today don’t like “squalid holes,” and “staring into the whites of their eyes,” and so they rather stay at home, where they have everything and can swipe in peace.
Here is the timeline from PEW. It shows that the percentage is now back to where it was BEFORE the boomers. Boomers and GenX formed the big trough, and millennials – spoiled rotten by their boomer parents – weren’t tough enough to do it
I can relate. On my own at 20, good times for all splitting rent over 6/7 people and working construction/ chasing girls. Ultimately, back to school and white collar job with GE for $12,000 a year (less than my old roofing job). Fortunately, it was worth it in the long run.
I was 18. Had no idea it was a squalid hole.
Looking back…..
When I was a teen, my room in my parents’ lovely house was a squalid hole…
Luxury realtor here. The super high end is still running, there is simply more money out there than ultra premium real estate available. Everything else is on sale, depending on the seller’s timeline, with fewer and fewer sellers that are getting squeezed and need to sell – a majority of those are already out of the game. Here in San Diego there are hundreds of flippers flipping 2-10+ houses at a time with fewer opportunities but they’re still buying so older homes are slowly being recycled into more expensive homes so that bottom line is a moving target. Everyone is unhappy but super interesting to see it all play out.
I got into real estate right after high school, my first job in 2009 was negotiating short sales. My boss bought most of the houses himself, flipped a good amount of them and kept like 40 houses – and he’s just a regular guy. At the same time there was an attorney in our building who would frequently ask if we had anyone who could spend $50M or more – the banks were selling off packs of 200-300 houses at a time for cents on the dollar. The first time SFR home back then was 100k give or take which sold for quite a bit lower if you had the 50M. Those same houses are 900k give or take today. I don’t see very many of those people selling today, they would get hit with crazy gains and where else are you going to invest? So I don’t see a whole lot of homes going into circulation.
“the banks were selling off packs of 200-300 houses at a time for cents on the dollar. ”
And yet we the tax payers bailed em out…..,sigh.
Did the taxpayers actually bail out the banks or did we make a profit when all funds paid to the banks were repaid with interest plus warrants?
And yet there are a lot of homes in circulation….many more than pre-covid in many major markets.
The issue is people letting them sit versus cutting prices.
Also my understanding was about 2 years ago the big funds started being net sellers of single family homes they’d bought up during 2008 down turn.
So what you’re saying doesn’t really align with the numbers, other than there’s not much forced selling right now
But inventory in general is rising all over. It’s not like that inventory is falling down.
On the subject of US home sales, this recent article on the mismatch between much of the housing stock with the demographic of buyers is rather interesting:
https://greathousingreversal.substack.com/p/florida-may-be-showing-us-the-great