
Mortgage rates at 6.69% are not high. Inflation is high.
By Wolf Richter for WOLF STREET.
Sales of existing single-family homes fell by 1.9% in July from June, seasonally adjusted, the second month in a row of declines, to an annual rate of 3.69 million sales, sinking deeper into the mud at the bottom that sales have been in for four years, according to data by the National Association of Realtors today.
Compared to July in prior years:
- 2025: +0.8% (year-over-year)
- 2024: +2.5%
- 2023: +1.9%
- 2022: -15.4%
- 2021: -30.6%
- 2019: -23.3%
- 2015: -24.1%
- 2009: -5.1% (Housing Bust)
- 1996: -3.7%
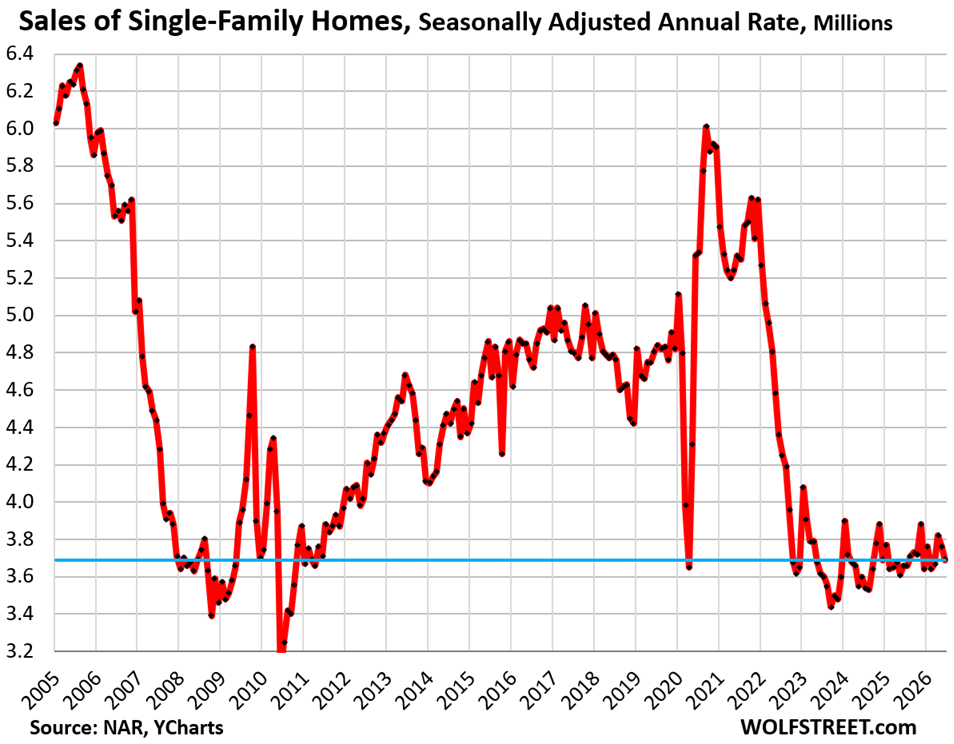
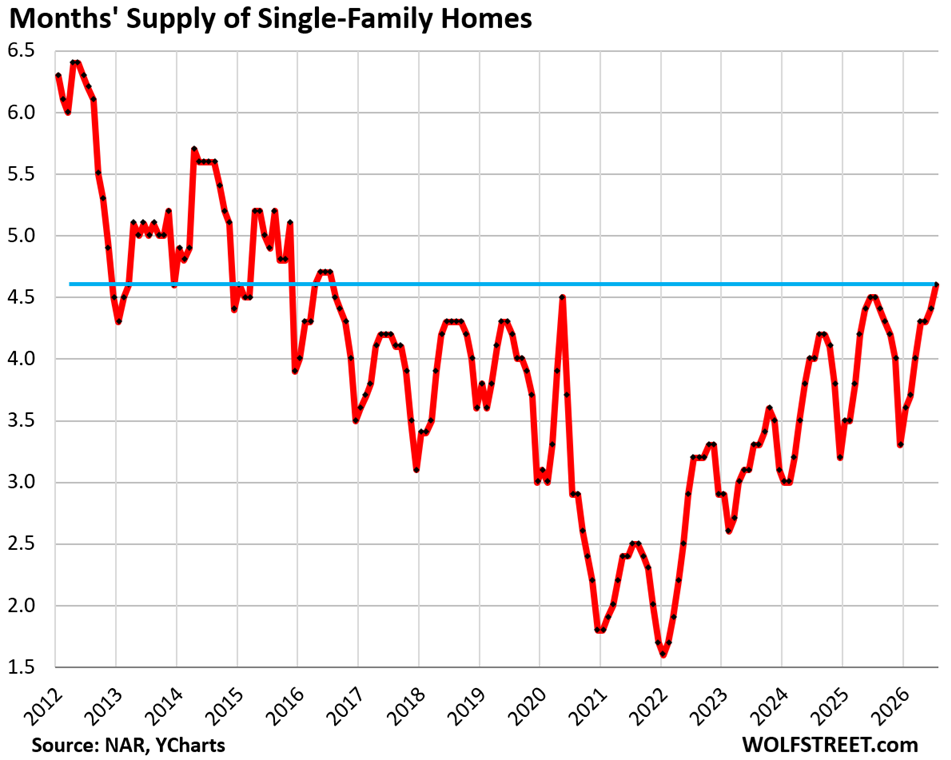
Supply of single-family homes rose to 4.6 months in July, the highest since the summer of 2016.
Supply is a function of inventory and sales – how much inventory there was at month-end in relationship to sales during the month. Sales sank deeper into the mud at the bottom, while inventories rose to 1.4 million single-family homes for sale.
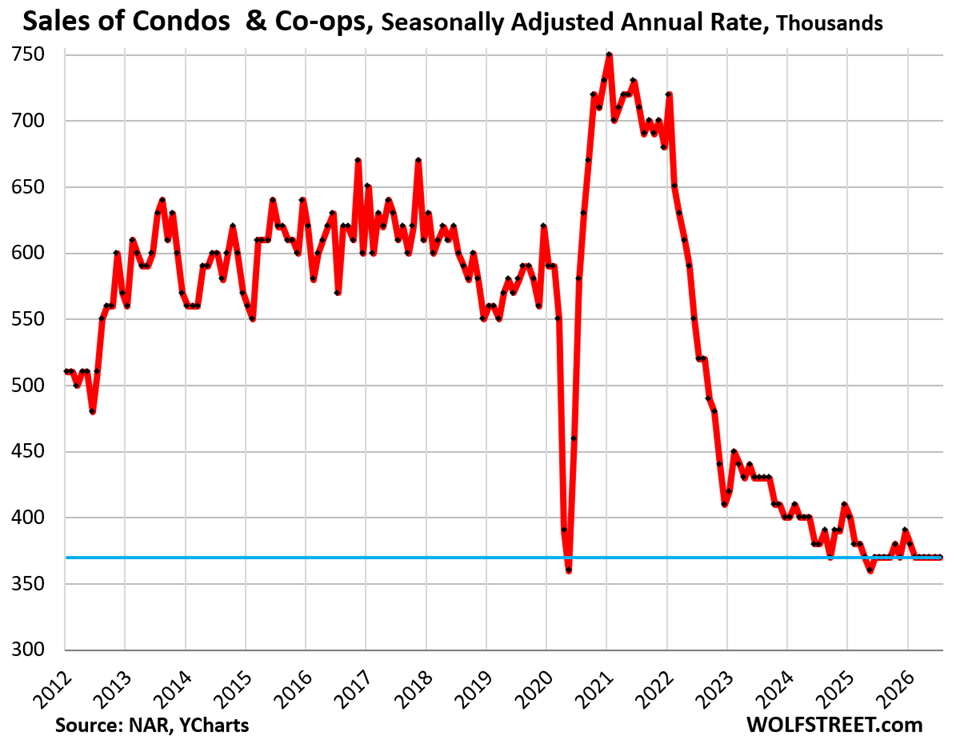
Sales of condos and co-ops were unchanged (seasonally adjusted and rounded to the nearest 10,000) in July, at an annual rate of 370,000, just above the record low in the data that go back only to late 2011.
The seasonally adjusted annual rate compared to July in prior years:
- 2025: 0% (year-over-year)
- 2021: -47.9%
- 2019: -36.2%
- 2012: -27.5% (first June in the data series)
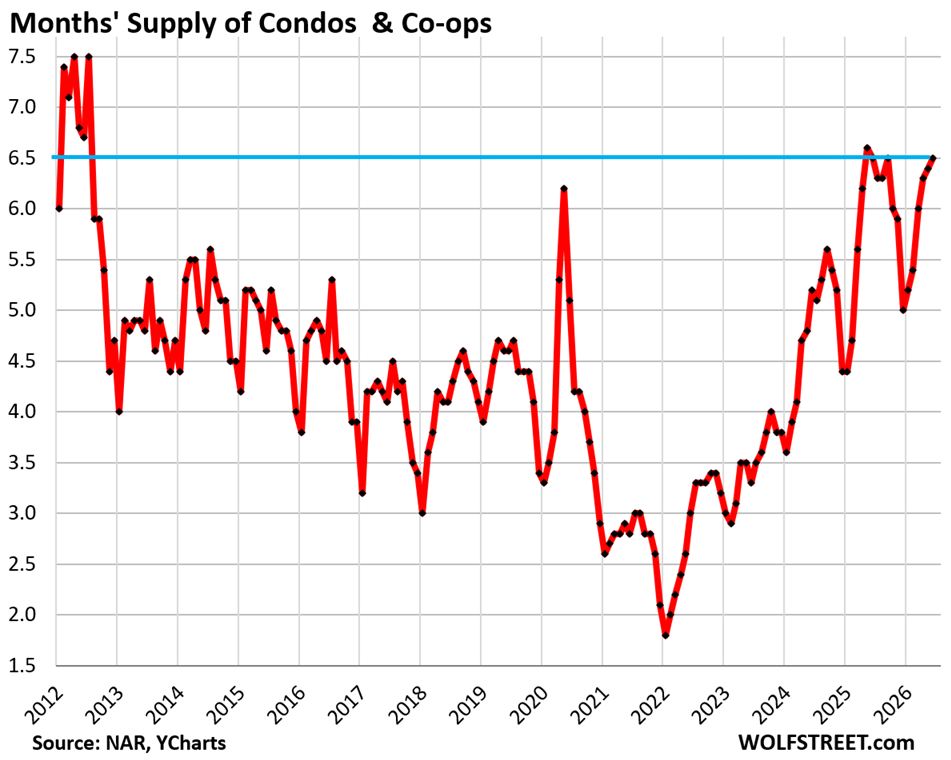
Supply of condos rose to 6.6 months, along with May, June, and September 2025, the highest since 2012.
Sales by region.
Sales of existing homes (single-family, condos, and co-ops combined) fell month-to-month in the South (-3.1%), the second month in a row of declines, and the Midwest (-2.0%), also the second month in a row of declines, seasonally adjusted. Sales were unchanged in the West and rose in the Northeast (+2.0%).
Compared to the same month in 2019, sales were down: in the West (-37%), Northeast (-27%), Midwest (-24%), and South (-19%). A map of the four regions is below the article at the top of the comments.

In the South, the seasonally adjusted annual rate of sales fell 3.1% in July from June, the second month in a row of declines, to 1,860,000 homes.
Compared to July in prior years:
- 2025: 0% (year-over-year)
- 2024: +2.8%
- 2023: 0%
- 2022: -14.3%
- 2019: -19.1%
- 2018: -17.3%
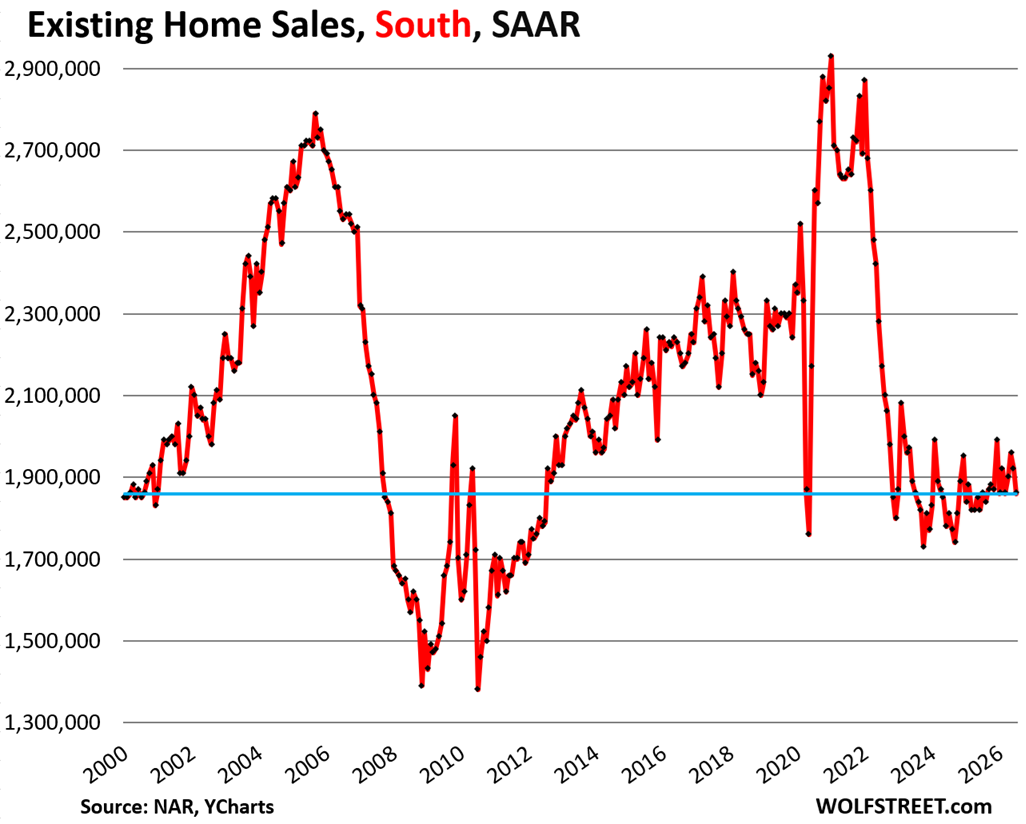
In the West, the seasonally adjusted annual rate of sales was unchanged in July at 730,000 homes.
Compared to July in prior years:
- 2025: +1.4% (year-over-year)
- 2024: -2.7%
- 2023: -1.4%
- 2022: -17.0%
- 2019: -36.5%
- 2018: -38.7%
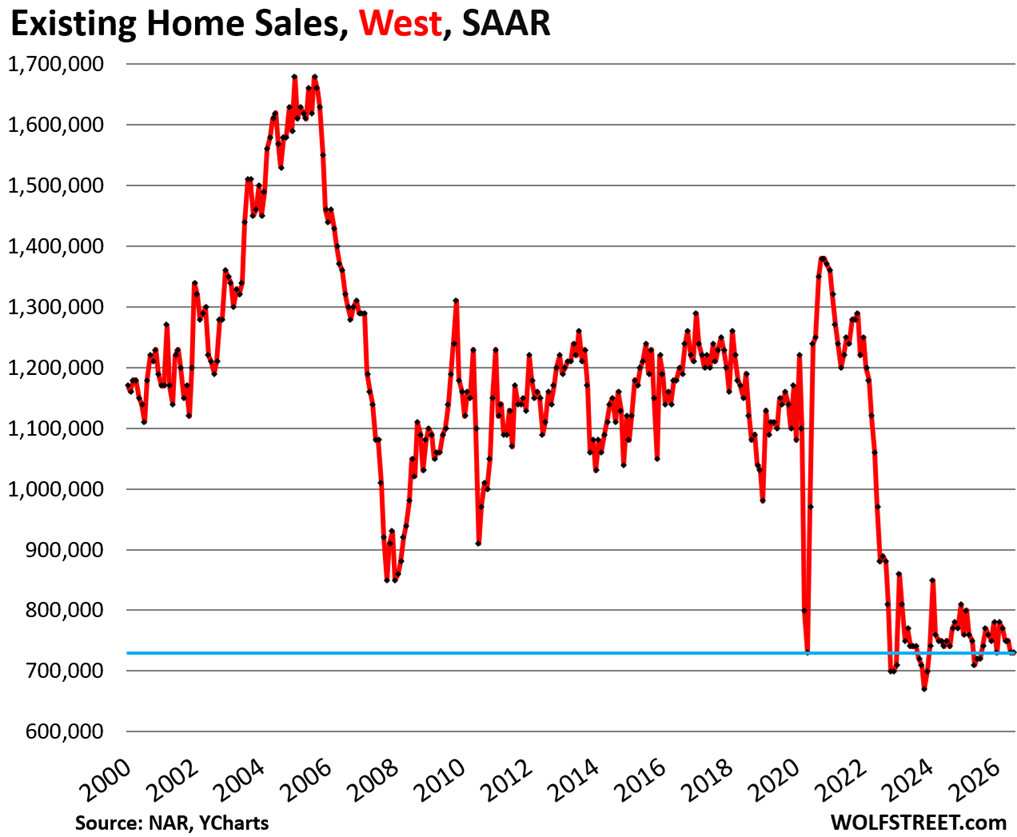
In the Midwest, the seasonally adjusted annual rate of sales fell 2.0% in July, to 970,000 homes.
Compared to July in prior years:
- 2025: +2.1% (year-over-year)
- 2024: +4.3%
- 2023: 0%
- 2022: -19.2%
- 2019: -23.6%
- 2018: -23.6%
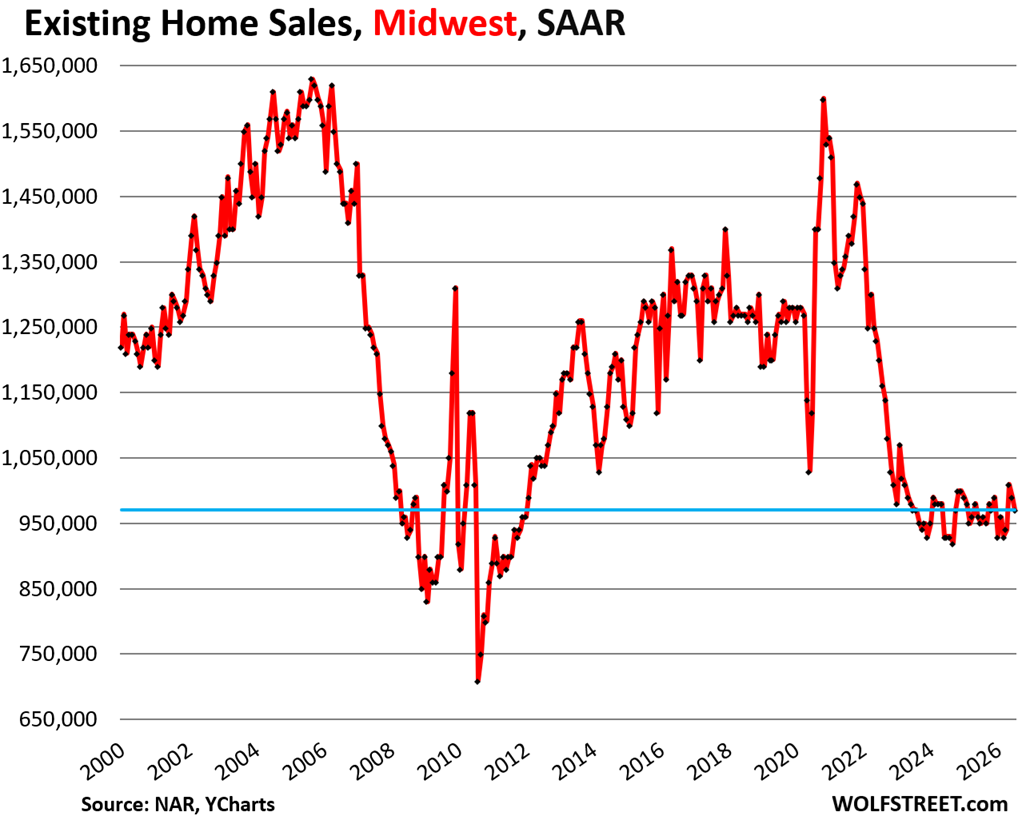
In the Northeast, the seasonally adjusted annual rate of sales rose by 2.0%, to 500,000 homes.
Compared to July in prior years:
- 2025: 0% (year-over-year)
- 2024: +2.0%
- 2023: +4.2%
- 2022: -20.6%
- 2019: -26.5%
- 2018: -27.5%
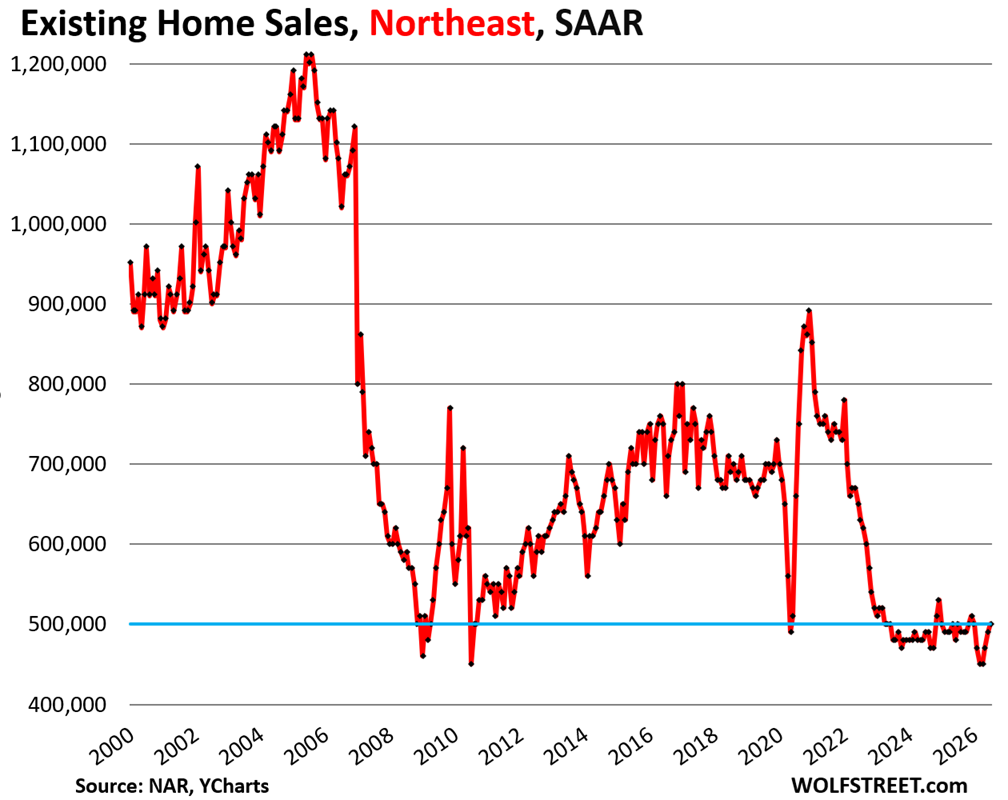
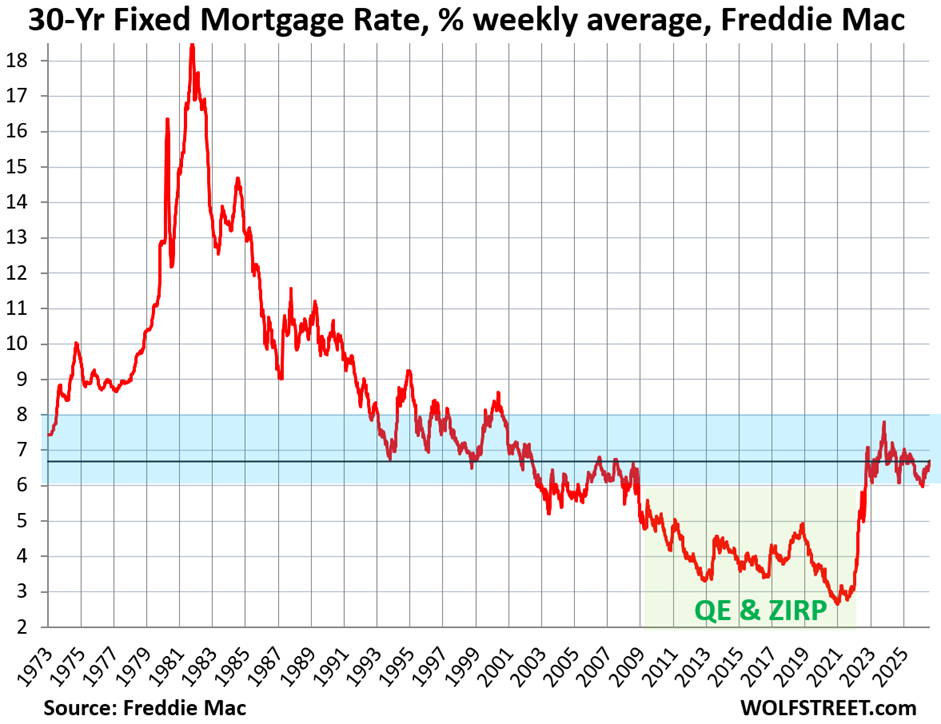
Mortgage rates are not high; inflation is high.
The average 30-year fixed mortgage rate rose to 6.69%, according to Freddie Mac’s weekly measure last Wednesday.
Mortgage rates track the 10-year Treasury yield (4.69% at the moment), but are higher, and the spread between them varies. Inflation has been running hot, amid fears that it’s not going back into the bottle, which is one of the reasons the 10-year Treasury yield is at 4.69%.
Current mortgage rates are at the lower end of the spectrum before the Fed’s QE started in 2009, which involved purchases of trillions of dollars of mortgage-backed securities to suppress mortgage rates and inflate home prices.
Mega-QE during the pandemic triggered the below-3% mortgage rates while inflation was spiking in direction of 9%, resulting in mortgage rates that were deeply negative in “real” terms (adjusted for inflation). That and FOMO by homebuyers trying to take advantage of those mortgage rates were the main culprits in the explosion of home prices from mid-2020 to mid-2022. The Fed’s money-printing strategy ended up creating the current “affordability crisis” and lots of inflation.
We’ve been saying this for years: The housing market – buyers, sellers, and everyone in between – needs to get used to these mortgage rates.
National price, local price, inflation & wage increases.
The national median price of single-family homes inched up year-over-year by 1.9% in July, not seasonally adjusted. Month-to-month, it declined to $440,300.
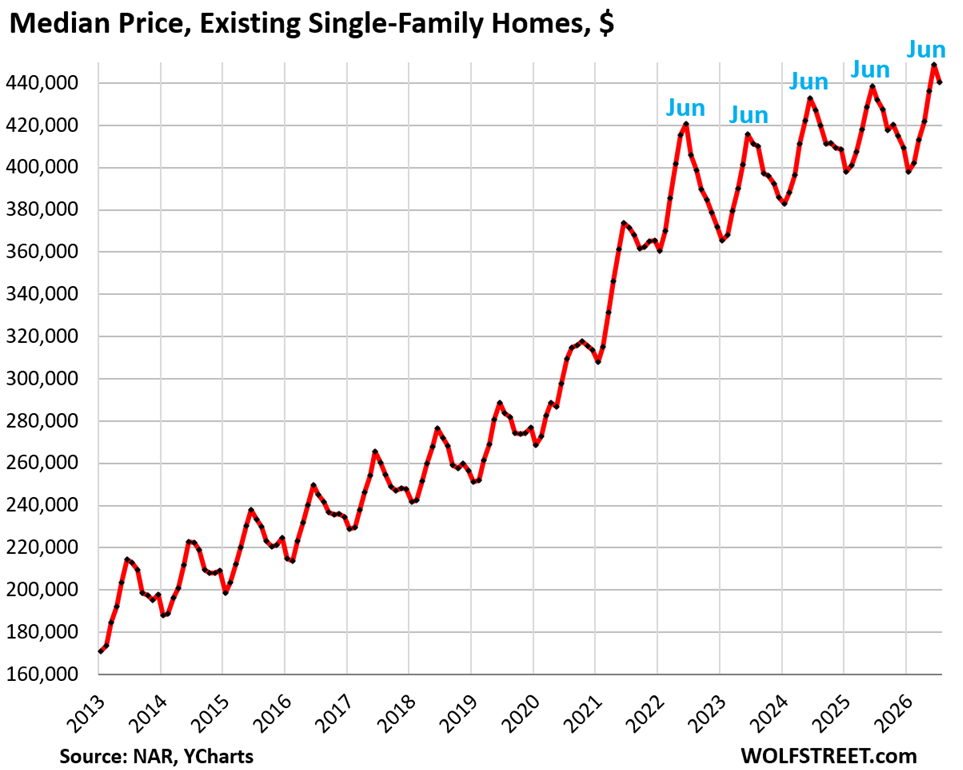
Since late 2022, broad inflation and national wage increases have outrun the increases of the national median price of single-family homes, thereby easing very slowly, over many years, the affordability crisis that was caused by the 40% explosion of the national median price in the two years through mid-2022 that had come on top of already high prices.
The price explosion ended in June 2022. Over the four years since then:
- National median price of single-family homes: +4.6% through July.
- Consumer Price Index (CPI): +13.2% through June.
- Average hourly earnings: +16.9% through July.
But the national median price is irrelevant for people buying or selling a home. To them, what matters are local prices, so…
Single-family home prices have dropped by 10% to 26% in 15 bigger markets, including:
- Austin, TX: -26%
- Oakland, CA: -25%
- New Orleans, LA: -20%
- Sarasota County, FL: -17%
In some other bigger cities, prices of single-family homes have continued to rise to new highs; the biggest year-over-year gains in those cities were in:
- New York City: +4.1%
- Chicago: +4.4%
- Milwaukee: +3.6%.
The national median price of condos and co-ops rose year-over-year by 2.2%.
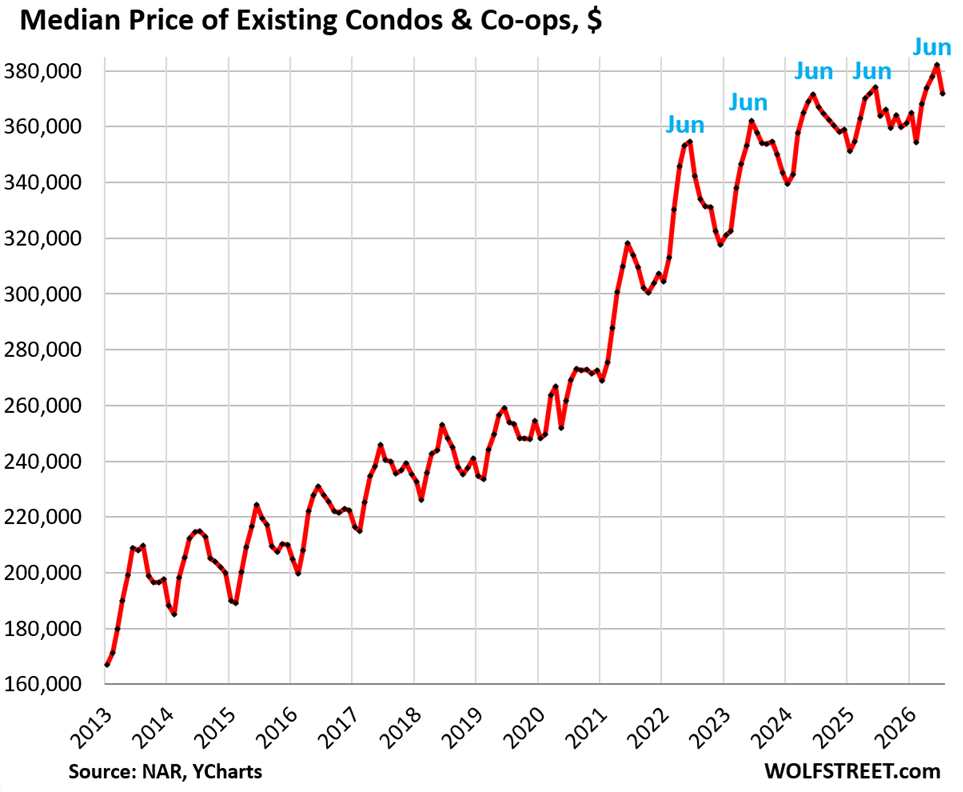
On a local basis, condo prices have plunged by 15% to 33% in 30 bigger markets from their highs, with several markets dropping below their highs in 2006. From peak:
- Cape Coral, FL: -33%
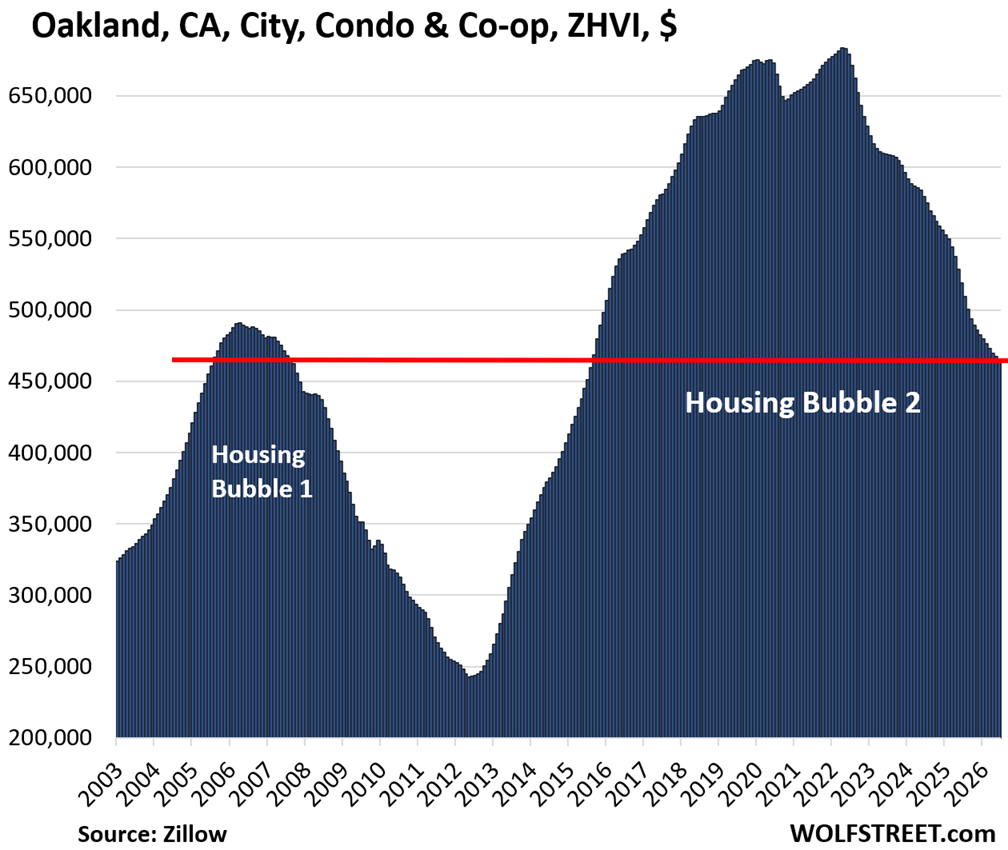
- Oakland, CA: -32%
- Petersburg, Fl: -29%
- Austin, TX: -28%
- Fort Myers, FL: -27%
- Sarasota County, FL: -24%
- Garland, TX: -21%
- Tampa, FL: -21%.
Here is Oakland, for example. The national median condo price really doesn’t matter to condo buyers and sellers anywhere (all 30 charts are here):
In case you missed it: Another Hit to Demand in the Housing Market: Purchases by Foreign Buyers Have Plunged by 76% from Peak.
Enjoy reading WOLF STREET and want to support it? You can donate. I appreciate it immensely. Click on the mug to find out how:


Here is a map of the four Census regions of the US:
Spot on, Wolf, with the condo situation. I sold mine in 2022 after 16 years of basically no appreciation—and it would be worth even less today.
Friends don’t let friends buy condos.
It depends on location. My wife and I sold our condo that we owned for 13 years for more than double the purchase price. The area is southeast Pennsylvania. Florida? You might have a problem.
The running joke is that the difference between a condo an an STD is that you can get rid of the STD
Out of curiosity, where was this that you experienced “basically” no appreciation after 16 years? I am not a huge fan of condos and HOAs but I must say that my experience was far different than this living in SoCal. I have experienced a greater than $400K appreciation since buying an investment condo in 2009 (so basically your same timeframe).
According to News 3 Las Vegas, local realtors reported 7,442 single-family homes listed for sale without any offers last month – up a staggering 4.1 percent from a year prior. For condos and townhomes, there were 2,719 listed without offers, up 3.7 percent. Its probably worse than they are saying.
4.1% is only staggering to gullible people who don’t know that it’s a small number, 1 /25.
So for every 25 houses that had trouble selling last year, there’s one more today.
In 2007 in Vegas those numbers weren’t going up by one in 25, they were doubling.
Anyway, a “staggering” (but actually quite modest) Price reduction will solve that “staggering” housing glut.
If the supply has jumped to a ten year high, prices should fall to at least a ten year low. But there is the ‘M’ factor. Manipulation
There is I*, Inflation. Vanishing money purchase power.
and yet the price increased 2%
our area – nicely done, fixed homes are selling in 29 days
junk is sitting – they pull and re-list at lower price, but still sits
a 7% rate heading into winter could “freeze” sales. At bare minimum send a chill….
Unfortunately what buyers are now confronting is the explosion in certain costs relating to home ownership, that is property taxes, electricity and insurance in high growth states like CA, TX and FL for example.
If they already own a home there can be a considerable increase in costs to just trade for a house of equal value if they have over 65 homestead exemptions freezing the value of the home they own. Taxes could possibly triple.
As for property insurance, in TX underwriting and investment profits have gone sky high for insurers yet our governor ignores the 74% increase in insurance rates that has accrued.
Time for state governments to stop the insurance companies from jacking rates, reduce sales taxes that have been severely inflated due to price inflation and stop
Spending tax dollars to attract data centers that add little to permanent employment.
What also is driven up is the cost of electricity. TX now has on its books data centers that could consume 5 times, yes 5 times the present amount of current peak Kwh capacity.
Yet where will the new generators come from and whose Kwh rates will increase? Two guesses.
Or it could just be that housing is too expensive.
1. House is a place to live.
2. Families are the basic functional unit of society.
3. There is no family formation. Men + women. There is no need for homes.
4. All of the purchases of homes and increase in prices were driven by second homes, investors, flippers, speculators and foreign buyers.
5. Marriage rates in USA, (all developed nations) going down. There is no need for homes. You need rental apartments. If a man or women dont have a child, why buy a home?
6. Who really recovered from 2008 housing crises? noone.
7. Either Engels is gone or blocked.
You must be the life of the party
1. Micheal(sp) taken leave at least once before, later return from edge. Dropping enumerated pearls. Wistful inscrutability.
2. 42% of spatial MDF rotating on per extenuated SBF declining per max leveraged autism spectrum –> up 15% annualized spread +/- STP.
3. Geopolitical maelstrom deferring benignant comeuppance pending oil relapse aforethought (anticipatory coalesce).
4. Internet search party needs gathering. Scour remote ends of database. Unblock? Wolf only know. TBC…
Engels certainly is gone – along with his friends Marx – Karl Marx!
Oakland’s condo prices may look reasonable again, but the HOA fees sure don’t. Property insurance, HOA fees, and taxes are the “hidden” part of the affordability conversation in housing.
💯 on that. It would be interesting to see how the real cost of a condo in Oakland has changed in the last decade as taxes insurance and HOAs have changed.
But incomes have surged too.
Rode around suburban/rural areas the other week for about 250 miles. Whole lotta property and homes for sale. Made a bunch of notes to check realtorcom to see what they were listing for and who’s selling.
Largely dreamers owned by non-corporate/llc entities. Covid boom prices in a somewhat depressed area. Good luck, they’re gonna need it. Of course the same old song and dance, dreamers don’t sell unless forced to.
What alarms me is the rental market. Rents in apartment and single family loaded up into rocket ships and shot to $1700+ leaving behind the wage anchor of $800 to $1200 max. Im driving past once full apartment buildings now a ghost town. New builds are only filling 20% of their units.
What happens when algorithmic data condenses to very little volume? Not a macro or historic real estate correction…you get what a bitcoin crash looks like in slow motion. Analyzing 08 wont save us from something new, nor do we need foreclosures or sales, you just need an algorithm to decide how to get the pot stirred. All you need is volume collapse and tgen the debt freezes.
Democrats “never waste a crisis” Dumped cash into the economy via their NGOS and welfare systems—Closing the country via the CCP method cut supply during the covid democrat created virus—Thier FED held interest rates supper low inflaming INFLATION in PRICES of everything 30 to 50 % in just two years. Inviting in Illegals added more demand in all areas too. The democrat parasited just never go away
Imagine that. We are two years into absolute control of the federal government (legislative, executive, and judiciary) by the GOP/Republicans and they are STILL “blaming Obama.” It doesn’t work. You guys own it. Everything was supposed to be fixed “on day one” or soon thereafter yet inflation is back over 4% because of war and tarrifs. *Golfclap*
Now that we’ve done the whole “2 can play that game” stuff, let’s talk about what’s really going on with the American economy: US dollars are just worth less and less with each year in terms of purchasing power (the definition of inflation) yet wages haven’t adjusted to the same extent that prices have. Both parties spend like drunken sailors (sorry to disparage drunken sailors by comparing them the the Democrat and Republican parties) and neither care about the national debt anymore (if they ever did.) As long as it’s a blank check from the left on social programs and a blank check from the right on tax cuts for the wealthy; and blank checks from both on military spending; none of this will change.
The absolutely bonkers solution would be to have currency that is actually based on something. Could be gold, or silver, or a basket of commodities. I don’t really care what, but this whole “print enough money and we can give our supporters whatever they want” has to stop eventually. . .right?
Both parties work for Wall St. Regardless of who is nominally in power, the rich get richer…
You’re forgetting the “deep state”.
You can already live on a Gold standard without any help.
Put everything except your credit card and checking account into a brokerage account and buy one of the gold ETFs like PHYS, IAU or GLD.
Only sell your gold when you need to pay for something in dollars, or you want to invest in something you expect to outperform gold.
Just beware of the dollar taxes on capital gains on gold sales. If you’re earning dollars, spend those first before selling any gold. Use any spare dollars to buy more gold. Save as much as you can spare in tax-advantaged retirement accounts like IRA or 401(k), any gold you own there doesn’t get taxed on sale.
Track your net worth measured in ounces of gold instead of dollars.
If everyone did this, the world would likely be a better place.
What’s the bottom Wolf?
In terms of sales, it’s hard to believe that they will drop a lot further. But they could.
This market needs much lower PRICES, and sales will take off. The price explosion from June 2020 to June 2022 killed this market. Just basic economics.
I’m glad to see that you are aligned with the idea prices need to fall. Yes, buyers need to get used to these interest rates as they are not historically high. But that matter little when home prices are such that no matter raging demand, if you can’t afford what you want, demand means nothing.
There are buyers out there who don’t care about rates or price. They just want to buy but they can’t just afford at these monthly payments.
ON top of this, renting is much cheaper. A point in case: IN my hood, one can purchase a home for ~410K/month or rent for ~$5K/month.
The math is pretty simple..
Could we be in for simply years of stagnation of prices after initial price drops? Although there are people moving out of low interest mortgages due to life, there are still a significant number holding onto their homes but would like to move. And surprisingly in my area there are new homes selling for 1.8 to 2.2 million. However, the builders are concentrating and putting more new infills on the market at the same time they I have seen in 20 years. Perhaps they are all rats running for the driest deck on a sinking ship?
Ben if you look at the long term price charts for various metros from 2000-2026, you see that some did bubble-and-bust while others did stagnation.
Hard to know which will happen in any specific area – but if you have a lot of new construction or if population is declining, stagnation is less likely.
I agree! Supply is up, interest rates are high and existing home sales are down= pricing needs to come down and adjust things.
@wolf – why do you believe that its unlikely home sales could fall much more ?
They’re already very low. There will always be some demand.
Other bubbles broke due to a loss of jobs, our market is still fairly strong, so no reason to sell. Most owners are boomers who don’t need to sell, own these homes outright and/or have lost cost mortgages. Why sell? A second home – there is still a housing shortage so just rent it out. If you sell it where do you put the money – an overinflated stock market (and these owners are likely already heavily invested in the market)? While the job market is strong, many employees are nervous, hanging on to their current job, so folks are not moving for job changes. So the bubble will hold until some market event forces sales.
Well, there’s two main reasons.
One: owning an empty house bleeds money like you wouldn’t believe. Upkeep, hoa, insurance, and if nothing else: a lot of time. And in return you get… a slightly less fast depreciating asset.
Two: as you mentioned there’s at some point going to be a correction. We are building a housing glut, our population growth has stagnated, and we are not going to see lower mortgages rates anytime soon. So, lower your price now and sell for 80% of what you hoped to get (hopefully still with a profit?). Or wait for the crash and sell for 50% of what you hoped to get… choices choices.
Boomers don’t have the kind of investment horizon anymore that allows to just ‘sit it out until prizes go higher again’. Better to sell and retire a little earlier, go on that holiday, or get that nice car you always wanted.
The continuing increase in supply after the 3 percent mtg /price increase has skewed these inventories and sales
As Wolf says high prices are reducing demand and increasing supply. No other explanation makes sense in my opinion.
This week 3 new homes on the market in NE Texas .
4000 sq ft 1/2 acre to 2 acres 2 with pools . All three are baby boomer moves with 1 a couple who upgraded for a craft space the other two are because 1 spouse died . Ages are 65 to 80 inventory is low 3 homes out of 200 in neighborhood
Prices are 850k to 1-2mm 20 year old homes move in ready
All regions look as though sales have hit a floor and been remarkably flat for 3-years. It would seem this trend will continue until wage gains eventually erode the excessive prices, or we a recession and forced selling drives prices down.
Real median household income has increased 500 dollars the last five years. They will be waiting a long time for incomes to increase.
Markets work. Markets create prices. Markets disseminate price information. Markets clear excess supply with lower prices. Markets slow new supply with lower prices. Granted real estate is local, local, local but still markets work in local real estate. Only one thing prevents markets from working. It is government intervention in a free market. Is it possible that government put too much cash into homeowners pockets? Is it possible government interference in lending rates raised existing home prices too high? Is it possible that government real estate taxes scaring off buyers.
When non market forces intervene, it takes longer to overcome them and get prices to a clearing level; but it will happen sometime.
Two recent laws relevant to condos:
(1) As of August 3, 2026 , the GSEs will no longer make condo loans based solely on the creditworthiness of the borrowers. Now, the GSEs require evaluation of the reserve levels and maintenance status/records of the condo associations. That is potentially a huge barrier to future condo purchases, as very few condo associations have their reserves anywhere near fully funded.
(2) Starting January 4, 2027, condominium and HOA projects reviewed under Fannie Mae’s “Full Review” process must generally allocate at least 15% (up from 10%) of their annual assessment income to replacement reserves.
Combined, these mean more special assesments and higher monthly HOA fees in the pipeline, making condos much less attractive as investments. Given (1) and (2) combined, expect the buyer pool to dramatically dry up — maybe even a lot of forced selling.
The Uniform Appraisal Dataset (UAD) 3.6 is the reason.
Does this apply to townhouses too, or just condos?
A condo is an ownership form. A condo owner owns their unit from the inside walls inward, and they own a percentage of the entire property, such as 0.5% of an entire condo tower, including 0.5% of the land, the 200-car garage, the pool, etc.
A townhouse is a type of building where one or two exterior walls touch another building. Most often, the owner owns 100% of the land and the building.
Thanks, I thought this might be the answer, but wasn’t sure, since I’ve only owned single family detached until now.
Just an addendum for people like myself who were not aware of this change – I think these new rules are for condominium associations that have more than 10 units.
“based solely on the creditworthiness of the borrowers. Now, the GSEs require evaluation of the reserve levels and maintenance status/records of the condo associations.”
In a normal economic universe, the financial health of the *collateral* always *does* factor into the “creditworthiness” of the borrowers.
A lender ain’t potentially foreclosing on “creditworthiness” – he might end up foreclosing on *collateral* – so *its* economic health matters a *lot* in a rational world.
It is only in gvt-based subsidy-demento-land that collateral health becomes irrelevant.
That’s how you end up with endless boom-bust cycles in US real estate.
When I bought my condo back in the late 1980s after a huge real estate bust in Oklahoma, there were no government-backed mortgages at all for condos because the risks were too high. You had to borrow from a bank and pay a higher interest rate. That’s the case today with condos in buildings that have been blacklisted by Fannie Mae due to said collateral risks. There are many thousands of properties on that blacklist.
@wolf – You say that we all need to get used to these high mortgage rates of 6% or so. How can we get used to it when others have sub 3% rates? How will we be able to compete with them if we ever need to rent our out 1st and only 6% rate home (due to job change etc)? Home prices have not dropped much in my big tech market. Lots of big tech couples here with mini rental empires whose tenants are mostly solid (unless earth mass layoffs and visa issues). Looks like those of us who cannot even get our 1st home need to be renters of such people for the next few years. People need to be motivated to give up their 3% mortgages on homes purchased post pandemic. Looks like it can only happen via mass layoffs.
Signed,
Citizen of Landlordistan (USA)
I had an 8% mortgage and got used to it. The problem is price. Don’t overpay.
Founder’s Tower, Wolf?
That is such a cool building. I was born in OKC in the early 1960s (St. Anthony’s Hospital-Now SSM Health.) I was delivered by pioneering OBGYN Dr. Billy McInally one of the 1st female OBGYN doctors in OK.
Resided OKC as a toddler, but left after my fathers job transfer. My mother still speaks fondly of our time living there. The monthly assessment on a 2 bed/3 bath condo in that building is nearly $1,800 a month. Cool building…but no thanks!
THAT’S BECAUSE NO ONE CAN AFFORD THE DOWN PAYMENT ON A 400 TO 500 THOUSAND DOLLAR HOME. WE HAVE WHOLE HOUSING DEVELOPEMENTS GOING UP AROUND COLORADO SPRINGS, SO CALLED APARTMENT HOME GOING FROM 300 TO 500 THOUSAND DOLLARS THE SIGNS ARE ALL RIGHT ALONG SIDE THE ROAD FOR ALL TO SEE. HOUSES OUT IN THE PLAINS STACKED ON TOP OF EACH OTHER PRICED FROM 400 TO 500,000 OR MORE. WHO IS BUYING THEM WHERE IS THE MONEY COMING FROM THE AVERAGE MORTGAGE FOR A 500,000 HOME IS AROUND 3500 TO 4000 A MONTH AND THAT DOESN’T INCLUDE THE ESCROW OF PROPERTY TAXES AND HOMEOWNERS INSURANCE. JUST SAYIN.
about 4 million people buy homes every year.