San Francisco & Portland came off the list. Fort Worth & Aurora (CO) come on the list.
By Wolf Richter for WOLF STREET.
The major national home price indices roughly agree with each other: For the past months, national home prices barely inched up year-over-year – by less than 1% in April. But this small uptick is composed of big moves up and down in different markets. And in specific markets there have been sharp declines – even with single-family home prices.
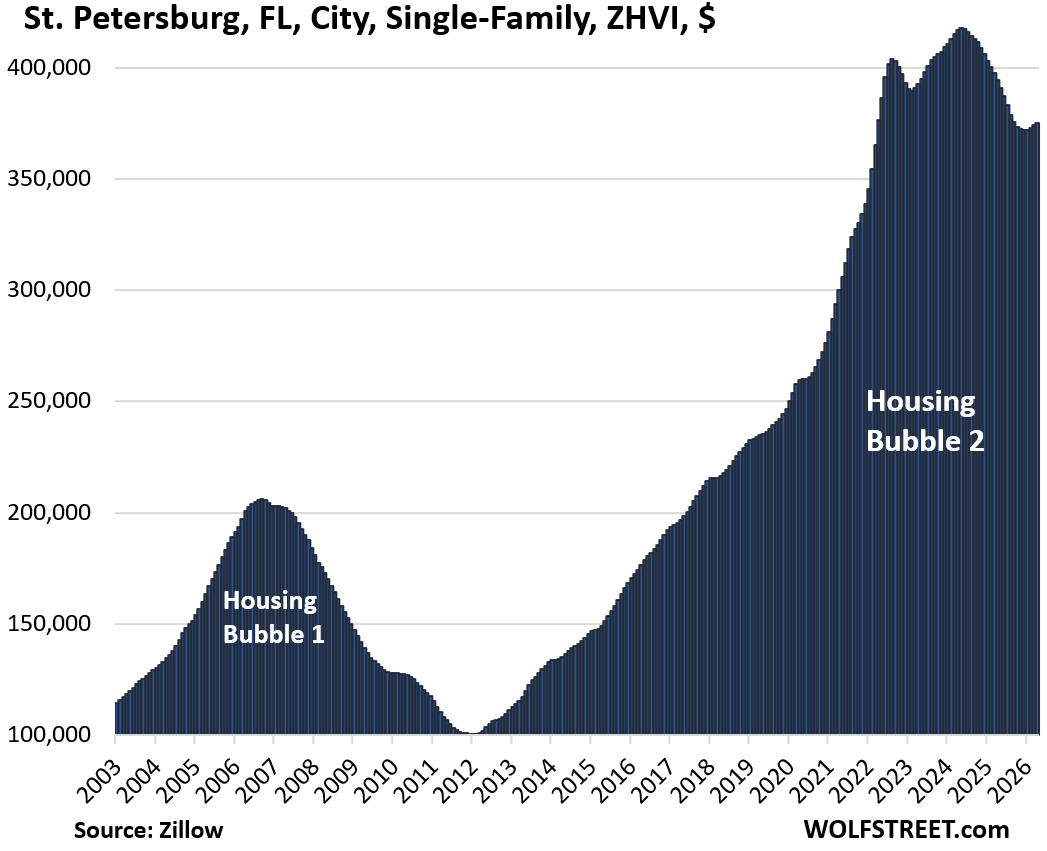
We noted earlier that mid-tier condo prices have dropped in 31 bigger cities by 12% to 31%, led by Oakland (-31%), St. Petersburg, FL (-28%), and Austin (-26%). Oakland’s condo prices are back where they’d been 20 years ago.
Single-family homes have not quite had such drama. Prices of mid-tier single-family homes in 15 bigger cities have dropped by 10% to 26% through April from their respective peaks, seasonally adjusted. In 12 of those cities, the peaks were in mid-2022; and in 3, the peaks were in 2024 (Phoenix, AZ; St. Petersburg, FL; and Naples/Collier County, FL).
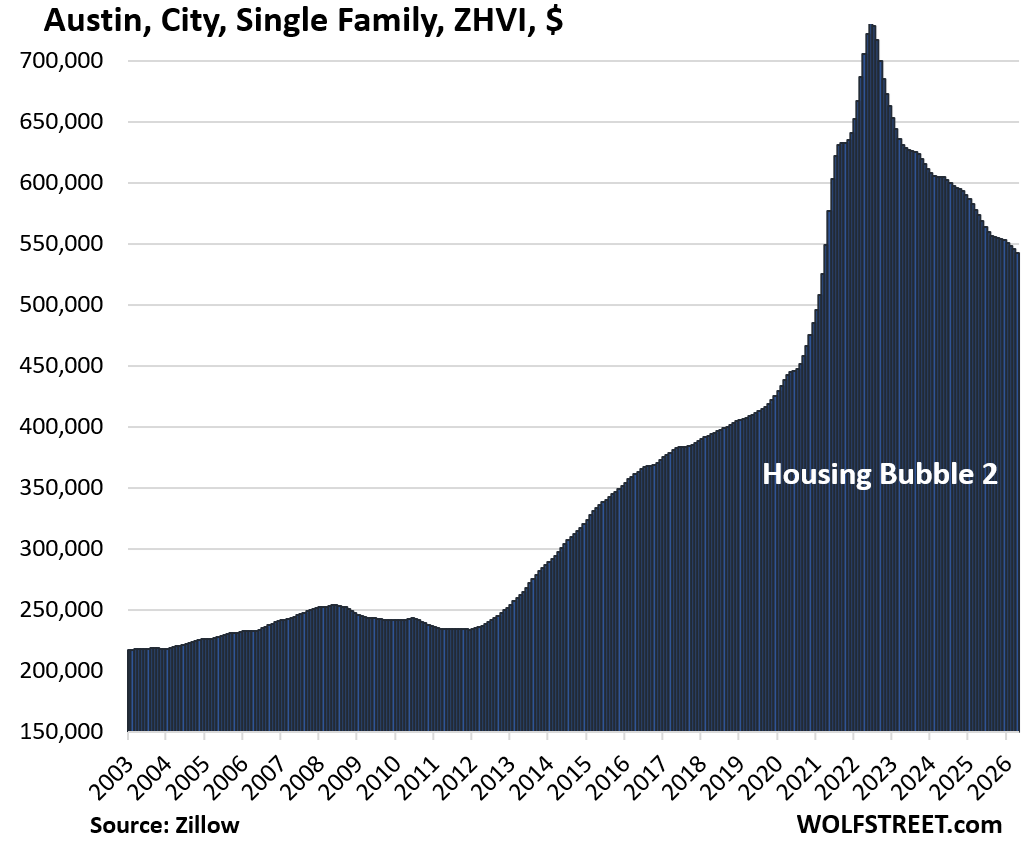
- Austin, TX: -26%
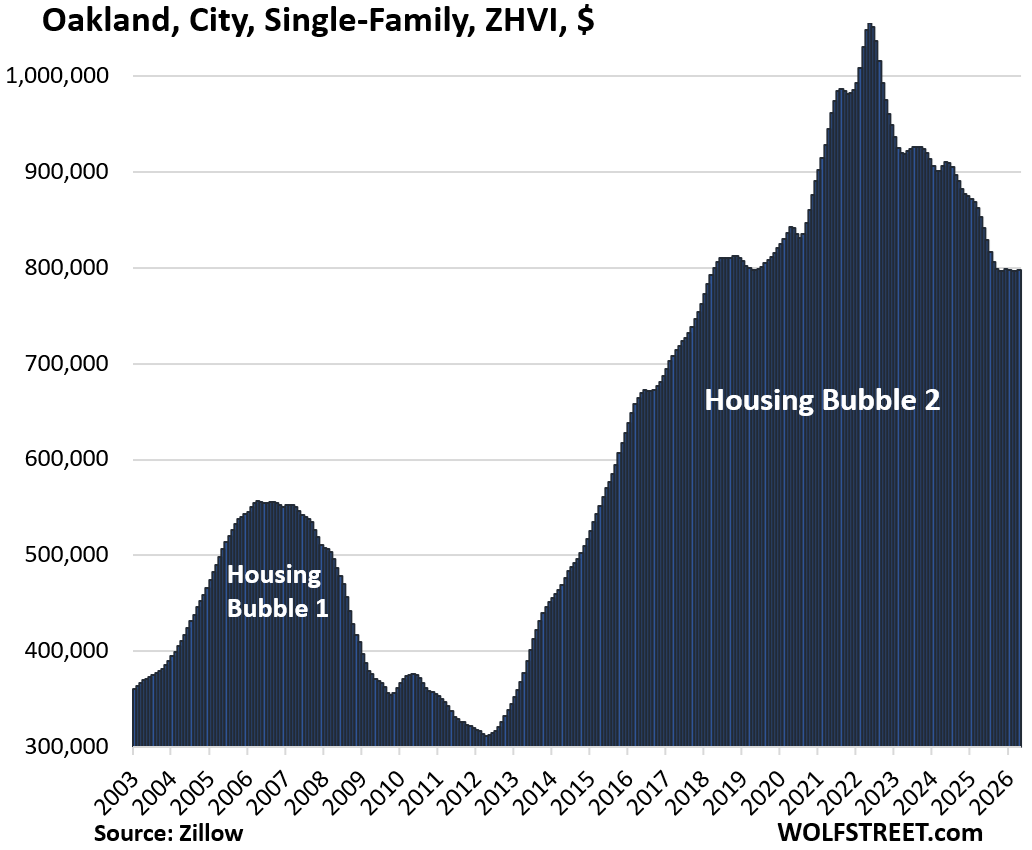
- Oakland, CA: -25%
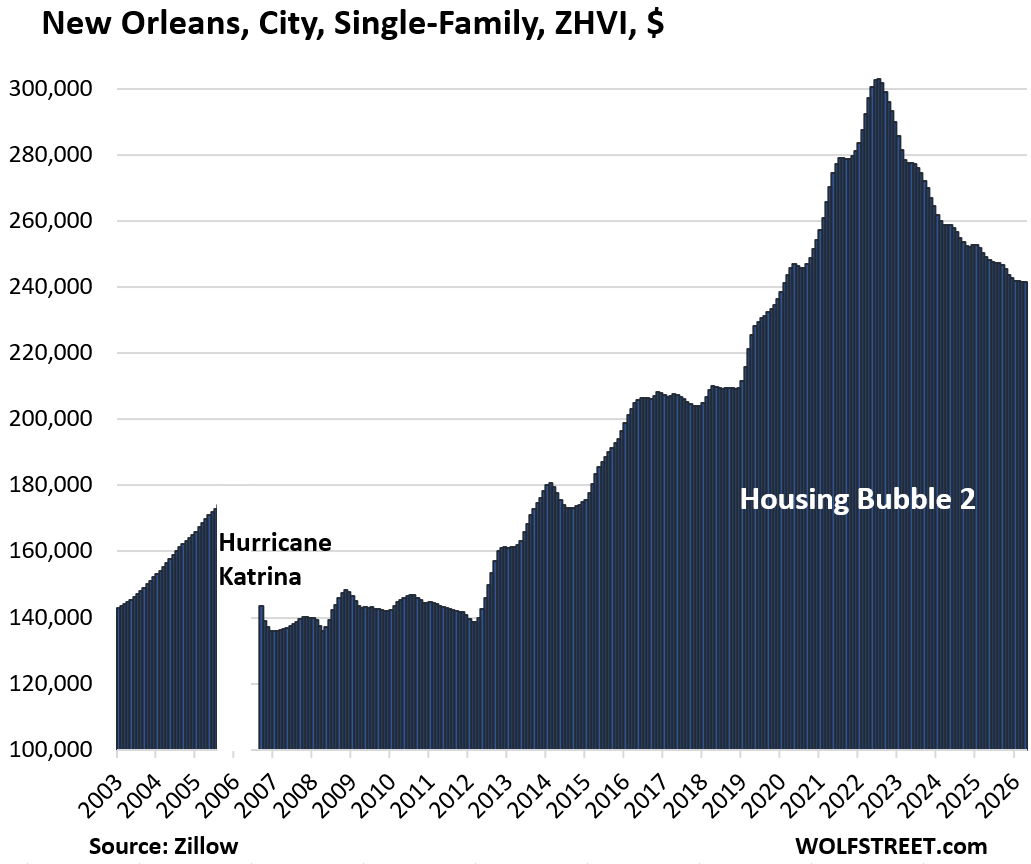
- New Orleans, LA: -20%
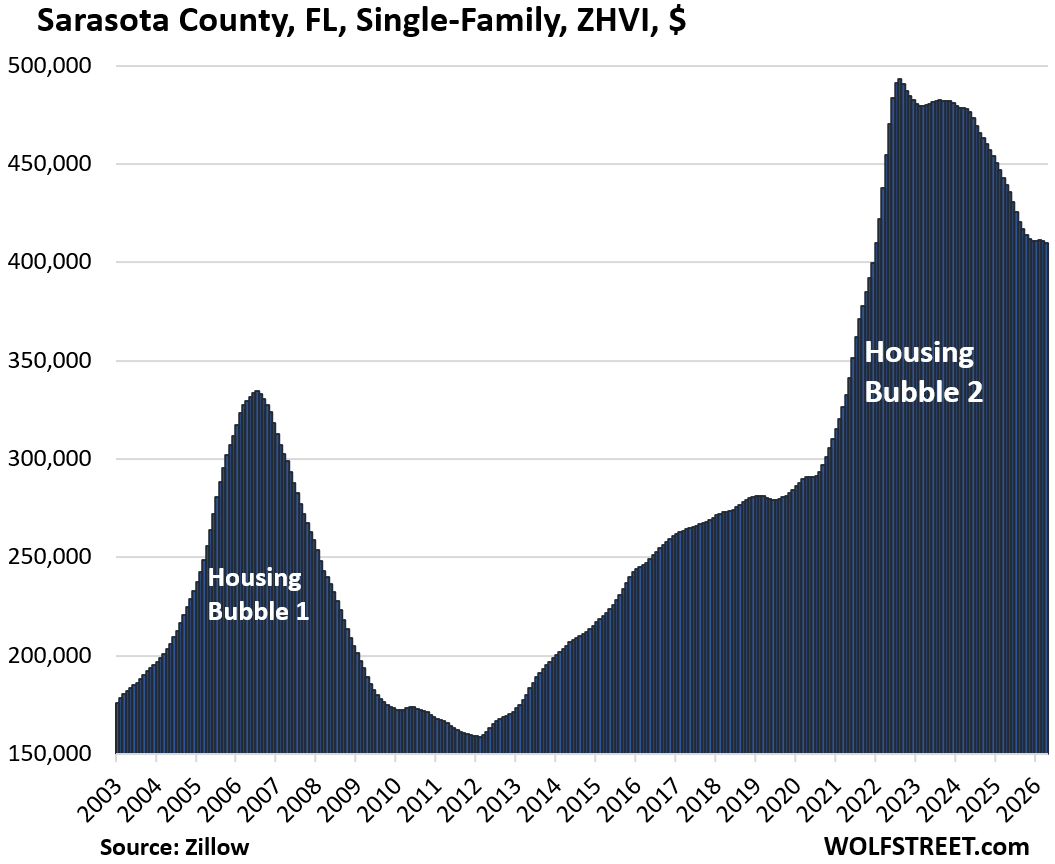
- Sarasota County, FL: -17%
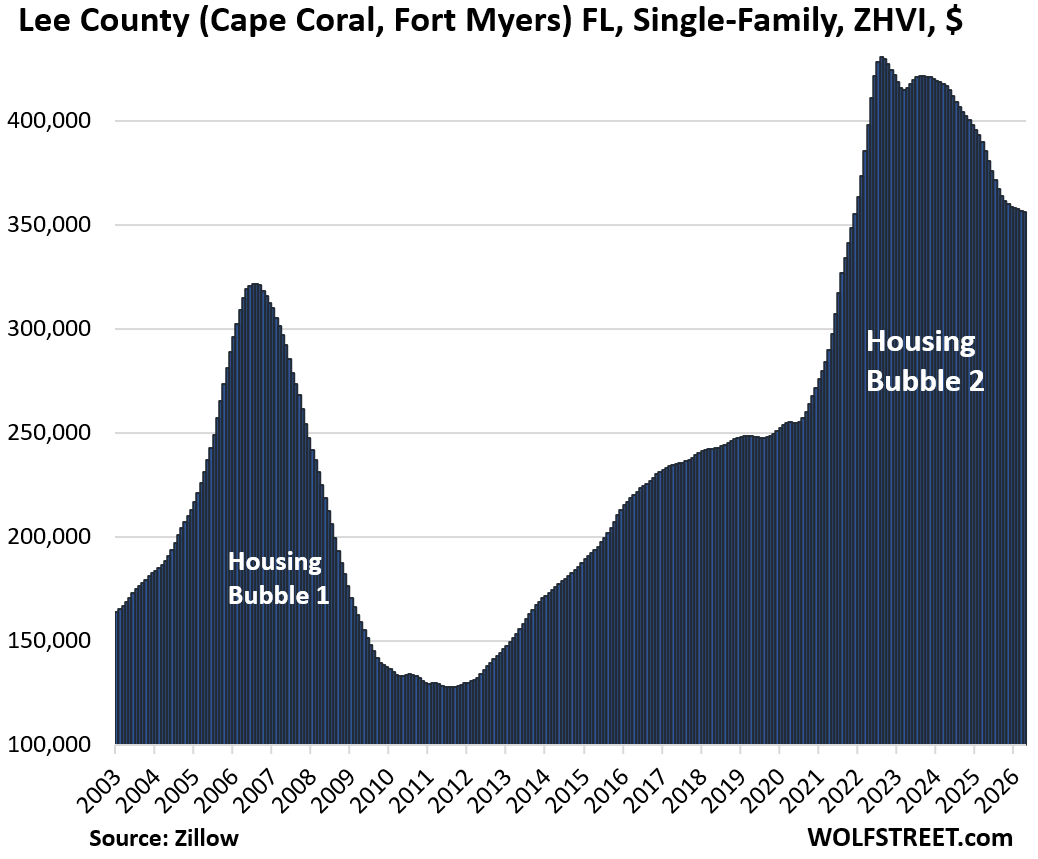
- Lee County (Cape Coral, Fort Myers), FL: -16%
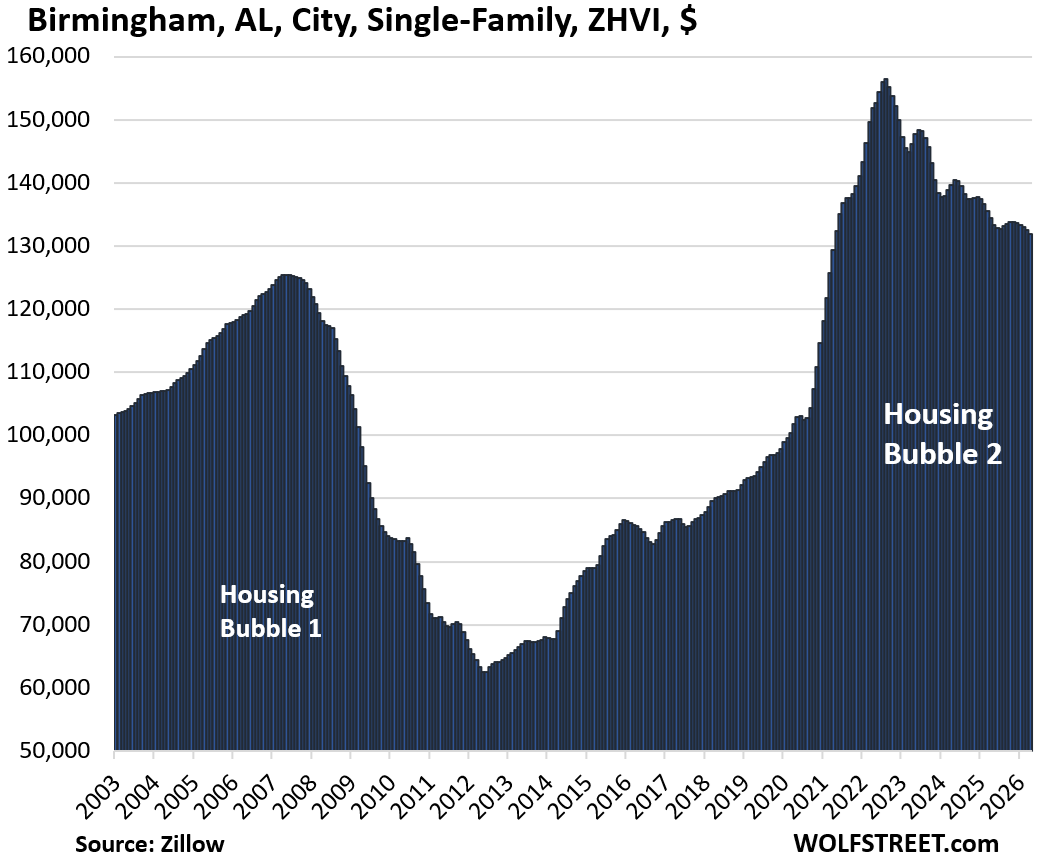
- Birmingham, AL: -14%
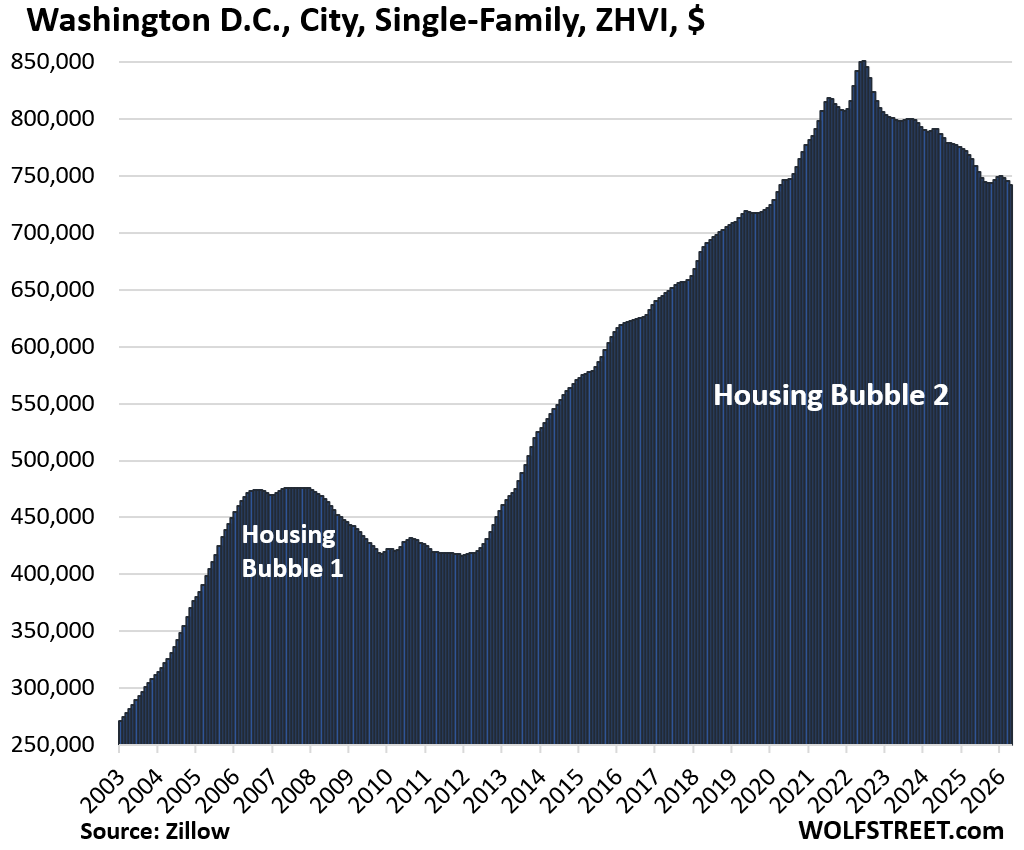
- Washington, DC: -13%
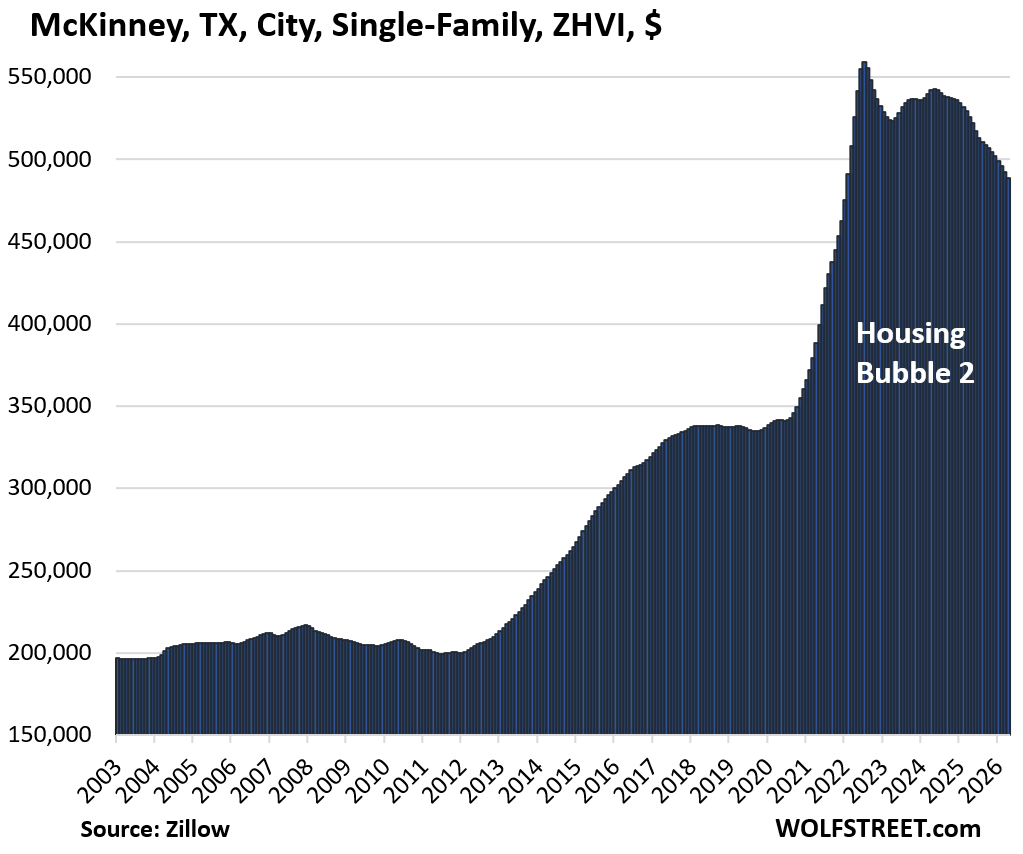
- McKinney, TX -13%
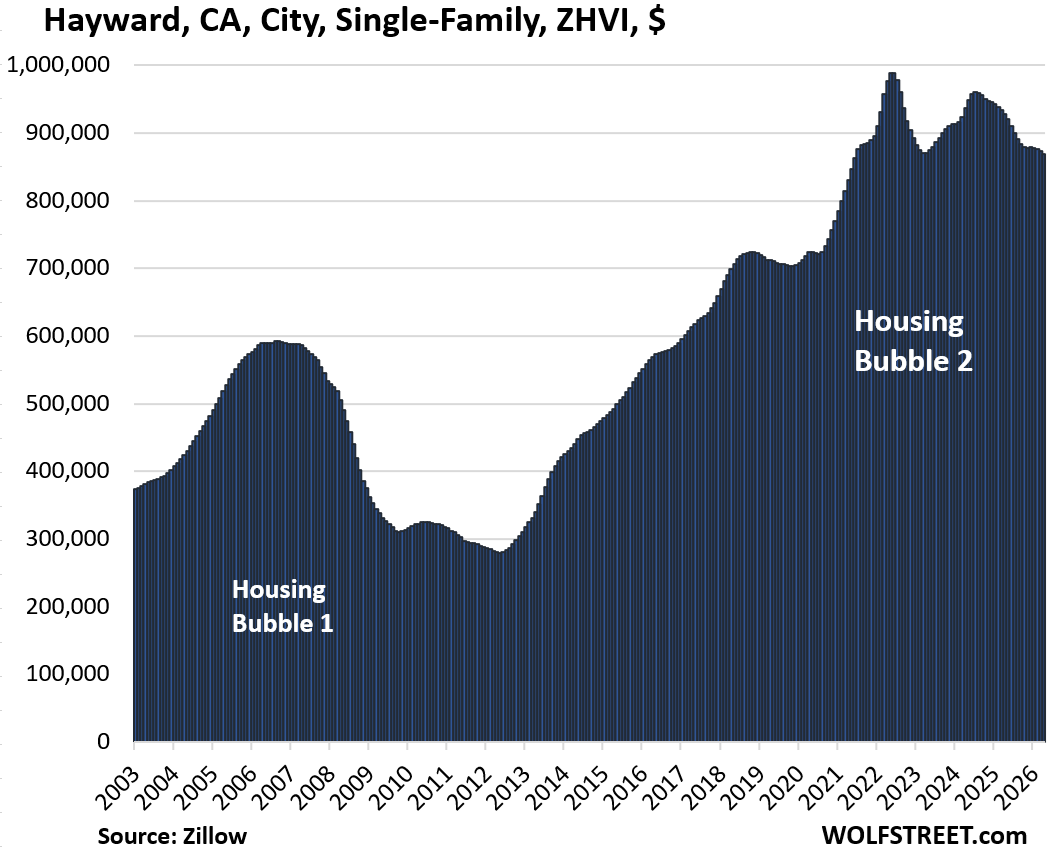
- Hayward, CA: -12%
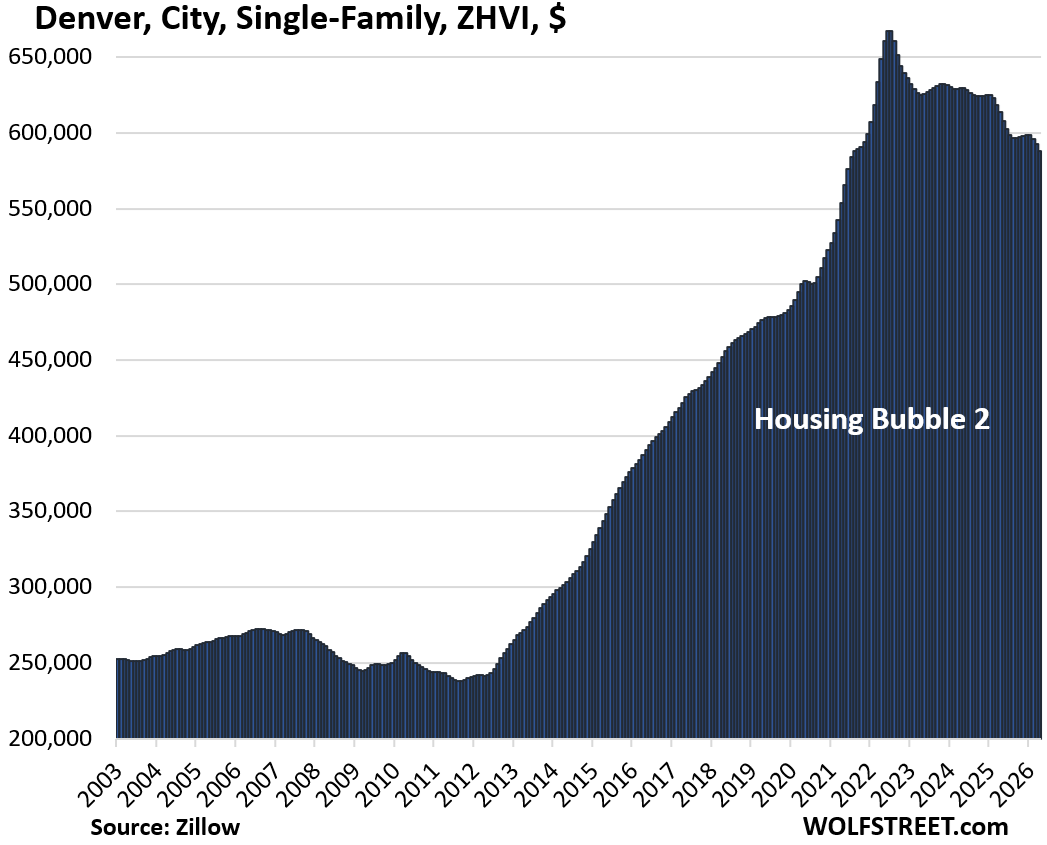
- Denver, CO: -12%
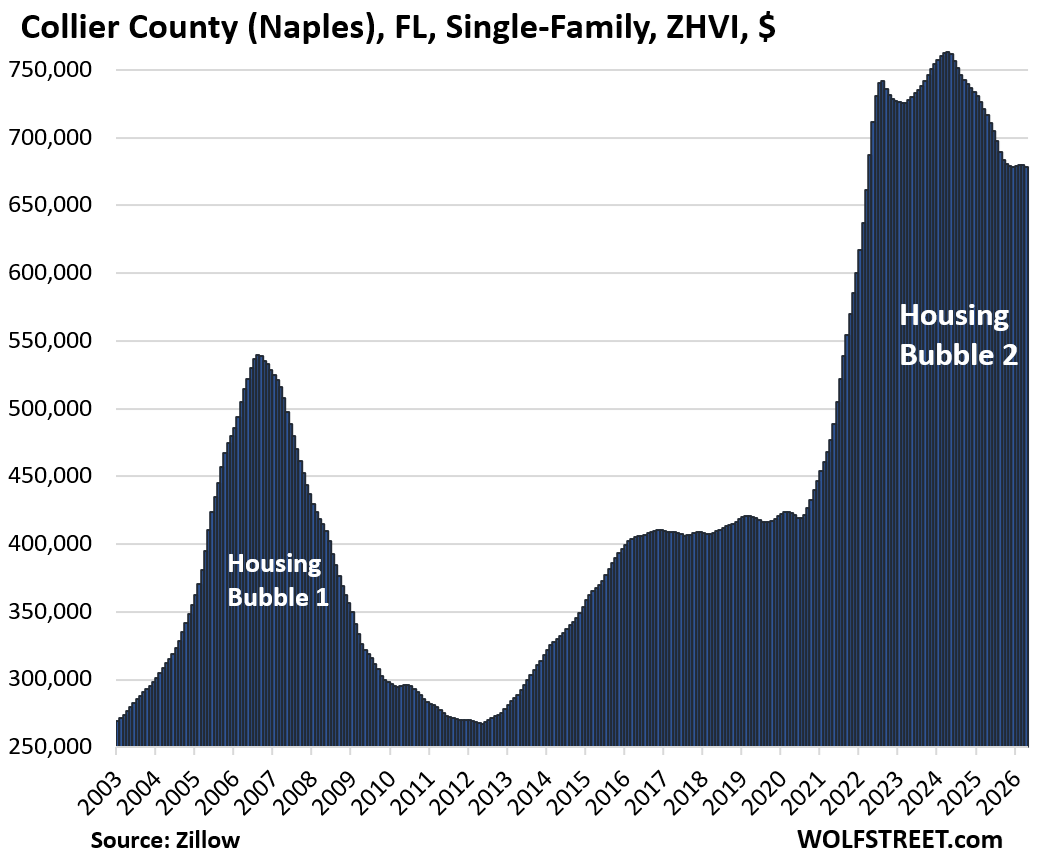
- Collier County (Naples), FL: -11%
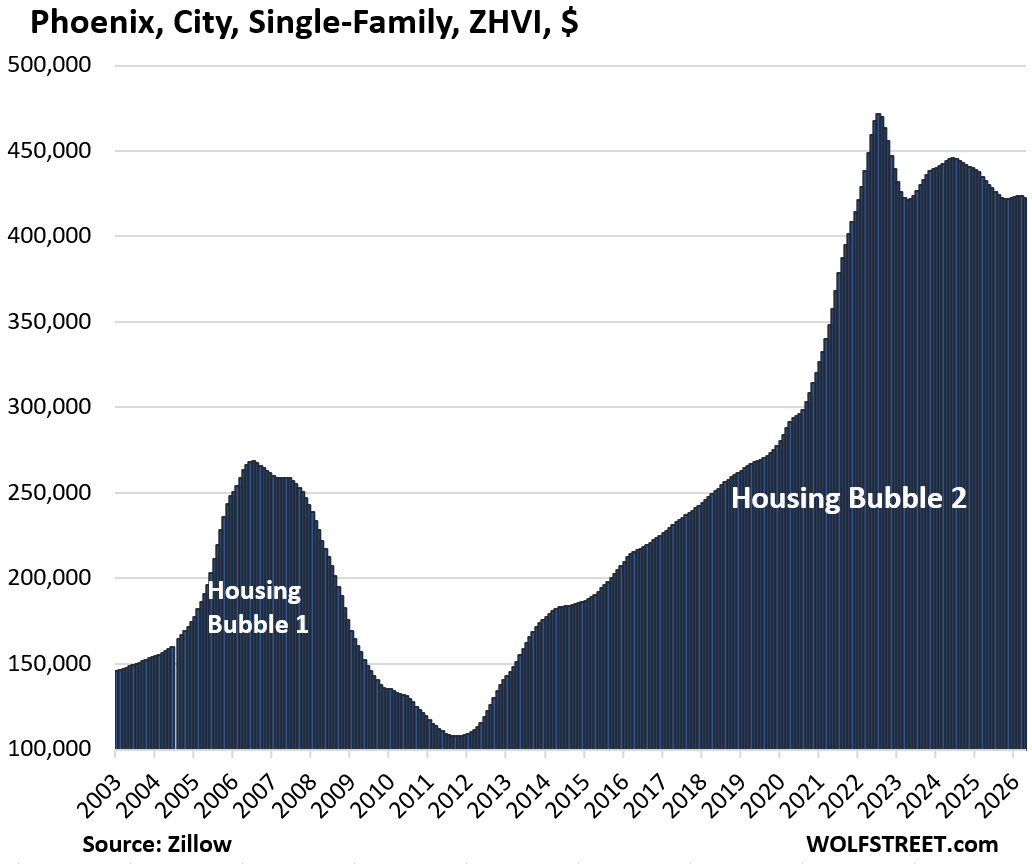
- Phoenix, AZ: -10%
- Petersburg, FL: -10%
- Aurora, CO: -10%
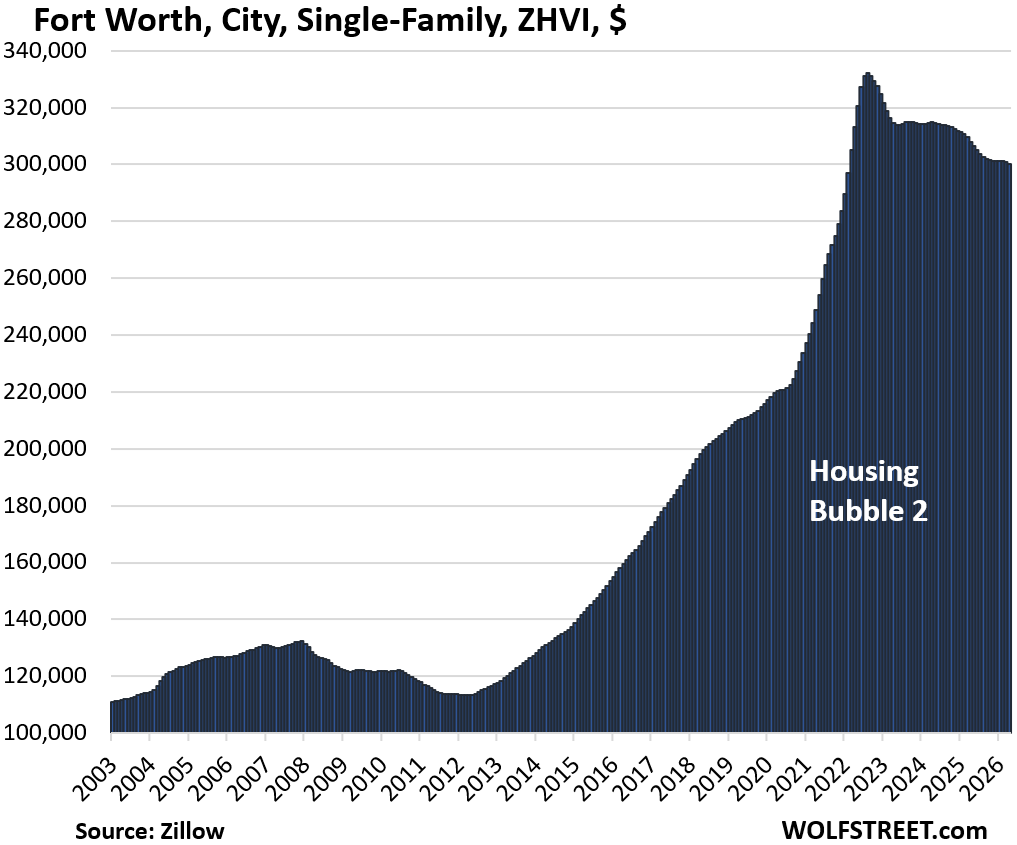
- Fort Worth, TX: -10%
The huge Dallas-Fort Worth metro has two cities on this list – McKinney (-13%) and Fort Worth (-10%). And it has a bunch of cities in the “didn’t make the 10% cutoff” category listed below, including the city of Dallas (-6.1%).
McKinney is interesting. It was one of the fastest-growing cities in the US over the past 20 years, part of the Texas Miracle, as it’s called in Texas. In the two years between mid-2020 and mid-2022, home prices exploded by 63%. Homebuilders have been flooding the market with new supply.
But now demand has backed off in relationship to this inventory and to 2022 prices. Homebuilders are cutting prices and piling on incentives to make deals, and that is putting downward pressure on prices of existing homes that we track here.
Lennar, one of the largest homebuilders and shooting to be #1, has been active in McKinney, has been very aggressive with its pricing strategy: The average price of its homes sold nationwide last quarter was down by 24% from the peak in 2022. This effectively rolled the average price back to where it had been in 2017. That’s what homeowners who want to sell are up against. But anything will sell if the price is low enough.
In April, prices of existing single-family homes in McKinney fell by 0.7% from March and by 7.1% year-over-year.
| McKinney, TX, City, Single-Family Home Prices | |||
| From Aug 2022 peak | MoM | YoY | Since 2000 |
| -13% | -0.7% | -7.1% | 154% |
Didn’t make the 10% cutoff:
There are many other bigger cities that didn’t make the 10% cut-off, where mid-tier single-family home prices have declined from their respective peaks in prior years, but by less than 10%.
And there a few bigger cities that had previously made the 10% cutoff, but home prices increased in recent months by enough to reduce the decline from peak to less than 10%. The standout is San Francisco, the epicenter of the AI boom, where the massive amounts of money raining down on people working for local AI companies has triggered a “mansion shortage,” as it’s called, and it began to trickle down into mid-tier homes. Nevertheless, single-family home prices in San Francisco, despite the recent jump, are still down by 9% from the peak in 2022.
- Glendale, AZ: -9.5%
- San Francisco, CA: -9.3%
- San Antonio, TX: -9.3%
- Portland, OR: -9.0%
- Chandler, AZ: -8.9%
- Sacramento, CA: -8.5%
- Mesa, AZ: -8.4%
- Plano, TX: -8.1%
- Colorado Springs, CO: -7.8%
- Memphis, TN: -7.7%
- Stockton, CA: -7.7%
- Seattle, WA: -7.6%
- Arlington, TX: -6.9%
- Dallas, TX: -6.1%
- Atlanta, GA: -6.0%
- Boise, ID: -5.9%
- Orlando, FL: -4.8%
- Jacksonville, FL: -4.8%
- Houston, TX: -4.4%
- Spokane, WA: -4.4%
- San Diego, CA: -4.1%
- San Jose, CA: -4.0%
- Tucson, AZ: -4.0%
- Raleigh, NC: -3.5%
- Nashville, TN: -3.3%
- Los Angeles, CA: -3.2%
- Las Vegas, NV: -3.1%
In some other bigger cities, home prices have continued to rise or have flattened out, such as Chicago and Philadelphia. Every market is different. My discussion and charts of the price gains and price declines of combined single-family, condo, and co-op prices in 33 large and expensive cities is here.
Methodology and data: These prices are seasonally adjusted three-month averages of single-family mid-tier homes in “cities” or in two instances, “counties.” All data here are from the Zillow Home Value Index (ZHVI), which is based on millions of data points in Zillow’s “Database of All Homes,” including from public records (tax data), MLS, brokerages, local Realtor Associations, real-estate agents, and households across the US. It includes pricing data for off-market deals and for-sale-by-owner deals. These are not median prices.
The 15 bigger cities with price declines of 10% to 26%:
The metrics in each table from left to right: price decline from the peak, month-over-month change (MoM), year-over-year change (YoY), and the remaining increase since January 2000.
| Austin, City, Single-Family Home Prices | |||
| From Jun 2022 peak | MoM | YoY | Since 2000 |
| -26% | -0.6% | -5.5% | 160% |
| Oakland, City, Single-Family Home Prices | |||
| From May 2022 peak | MoM | YoY | Since 2000 |
| -24% | 0.1% | -6.6% | 276% |
Back to April 2018. In the 10 years from mid-2012 to the peak in May 2022, prices exploded by 236%, which was obviously nuts.
| New Orleans, City, Single-Family Home Prices | |||
| From Jun 2022 peak | MoM | YoY | Since 2007 |
| -20% | 0.0% | -3.1% | 103% |
| Sarasota County, FL, Single-Family Home Prices | |||
| From Aug 2022 peak | MoM | YoY | Since 2000 |
| -16% | -0.2% | -6.7% | 211% |
| Lee County (Cape Coral & Fort Myers), FL, Single-Family Home Prices | |||
| From Aug 2022 peak | MoM | YoY | Since 2000 |
| -16% | -0.2% | -7.7% | 184% |
| Birmingham, AL, City, Single-Family Home Prices | |||
| From Jul 2022 peak | MoM | YoY | Since 2002 |
| -14% | -0.5% | -1.9% | 32% |
| Washington D.C., Single-Family Home Prices | |||
| From Jun 2022 peak | MoM | YoY | Since 2000 |
| -13% | -0.5% | -3.0% | 271% |
| McKinney, TX, City, Single-Family Home Prices | |||
| From Aug 2022 peak | MoM | YoY | Since 2000 |
| -13% | -0.7% | -7.1% | 154% |
| Denver, City, Single-Family Home Prices | |||
| From Jun 2022 peak | MoM | YoY | Since 2000 |
| -12% | -0.7% | -4.1% | 208% |
| Hayward, CA, City, Single-Family Home Prices | |||
| From Aug 2022 peak | MoM | YoY | Since 2000 |
| -12% | -0.5% | -6% | 268% |
| Collier County (Naples), FL, Single-Family Home Prices | |||
| From Mar 2024 peak | MoM | YoY | Since 2000 |
| -11% | -0.2% | -5.3% | 241% |
| Phoenix, City, Single-Family Home Prices | |||
| From Jul 2022 peak | MoM | YoY | Since 2000 |
| -10% | -0.2% | -2.3% | 248% |
| St. Petersburg, City, Single-Family Home Prices | |||
| From May 2024 peak | MoM | YoY | Since 2000 |
| -10% | 0.2% | -4.9% | 353% |
| Aurora, CO, City, Single-Family Home Prices | |||
| From May 2024 peak | MoM | YoY | Since 2000 |
| -10% | -0.6% | -3.9% | 191% |

| Fort Worth, City, Single-Family Home Prices | |||
| From Aug 2022 peak | MoM | YoY | Since 2000 |
| -10% | -0.2% | -2.5% | 188% |
And in case you missed it: The Most Splendid Housing Bubbles in America: Price Drops & Gains in 33 Big Expensive Cities, April 2026
Enjoy reading WOLF STREET and want to support it? You can donate. I appreciate it immensely. Click on the mug to find out how:

![]()
Good article. I can confirm that Sarasota County is indeed down. In my neighborhood, the peak was summer 2022 and down about 10% since then (I get monthly updates on sales and prices). Other less desirable areas around the county are down more (e.g. further away from the beach). Still, new homes and apartments are being built wherever there is vacant land it seems.
In TX “Homebuilders have been flooding the market with new supply.”
Agreed wholeheartedly. Just this week, advised a guy moving here from Europe (to set up his new tech company) to buy a new house from a developer and negotiate a 15-20% discount.
In TX, I am surprised that Garland isn’t on the list. Wolf usually breaks out Garland separately.
Looks like retirement places in FL are getting hit the hardest. Maybe the Mamdani exits are helping the cities with employment in FL.
Yes, Garland single-family prices would be on the second list – “didn’t make the 10% cutoff” – with single-family prices down 8%. There are many cities in the Dallas area in that range of price drop, but it would make the second list very long. So I just picked some, not all.
For people who are not familiar with the Dallas area, I recommend driving through it twice from rural edge to rural edge, once along a north-south axis, and once along an east-west axis. Rush hour would be the best time to attempt that. It should be on everyone’s bucket list LOL.
Houston is the same, just an enormous sprawl, though I guess it’s contained by the Gulf on one side.
Why do you recommend this?
he major national home price indices roughly agree with each other: For the past months, national home prices barely inched up year-over-year – by less than 1% in April.
Mathematically the solution is for the housing asking price to decline by at least 30 to 40 pct given a socially neutral context.
Thanks for this detailed report. Collier County (Naples) can’t be right, though?
Why not? These are single-family home prices in Collier County, not condo prices. In the city of Naples, which is a small-ish city in Collier County, prices are down by roughly the same amount as in the county overall.
Wolf,
Will you write an article on ‘buying vs. renting’?
I think many readers would be interested in this now that the ‘buying’ market is frozen. Perhaps you could include a longer-term chart (10 years) of renting versus owning (and by owning, I mean owning the mortgage). I even suspect that in some markets, the cost of carrying the house is now competing with renting.
Anecdotal evidence
I am in san diego. And in my neighborhood it takes total cost of 10k per month to purchase
You can rent the same home for 5k
On top of this you are losing equity little bit every month
Renting is significantly cheaper in Denver. My rent wouldn’t even cover the interest on a mortgage after a 20% down payment.
Also when you consider earning 4% annually in interest on the down payment money (not risking down payment in the stock market) and dropping the extra money you’re saving in the S&P (52% return since summer 2022) it’s a no brainer. On the other hand the house would have lost 10%
The only thing keeping housing prices where they’re at is the gullibility of the general public that keeps listening to realtors and social media saying buy now before it starts going up 20% a years again or buy an Airbnb it’s super easy and no work and you’ll be rich.
Collier County Florida cannot be up 8% since 2000 is probably what other commentors are referring to Wolf.
Chart surely does not look like that, eh?
Thanks, fixed.
Might want to add Fairfax County, VA to your list. We have a larger population than most of the jurisdictions you follow.
Nope, doesn’t meet any of the criteria for this article. Go ahead and read the article, or at least the headline.
Oakland skyrocketed because San Francisco was too expensive. Watch out for another spillover into Oakland if a “mansion shortage” really exists. However, like the previous booms, the effect, as well as the “mansion shortage”, will only be short-term. Then The City can settle down until the next boom.
People should understand that prices will never fall much in San Francisco. It is a small, beautiful, and very desirable city with zero new construction.
“with zero new construction”
🤣 there are 70,000 housing units in various stages of the pipeline in SF. Huge former industrial areas, a power plant, port areas, an entire island, former Navy areas — some of them with nuclear contamination from the Cold War — a former football stadium and its parking lots, a big mall with huge parking lots, etc. are getting redeveloped into housing. Lots of new housing went up in recent years, several thousand housing units per year. What they’re not building much of is single-family. If you want to buy a new single-family home, you’ll have to move many miles east and go inland.
Friends and family who I visited in THE City were paying, on average, $50/month rent ”back in the day” after a huge bubble and bust TS.
NO reason in the world we don’t see similar dynamics again someday, perhaps a lot sooner than anyone can imagine…
RE IS, and always has been subject to those huge ups and downs, and in spite of all the propaganda otherwise, always will be…
At this point, the only real variable of the delta is the vast and continuing degradation of the USD.
What’s going on at the former Naval Base at Hunter’s Point Naval Shipyard? I heard the area was designated as contaminated at one time. I spent some time there when I was in the Navy back in 1973.
It’s being redeveloped into housing. But there were huge issues with the cleanup of the nuclear contamination, and construction is delayed in part because of it.
The redevelopment of the China Basin area is well along, with beautiful new parks along the shore and nice apartments and condos, many of them already occupied.
Treasury Island (Naval base during the Cold War and WW2) had the same issues with nuclear contamination, and I wrote about it in 2012, but they got it resolved, and buildings are now sprouting like mushrooms. Starting to look very nice. Many of the new apartments and condos are now occupied, surrounded by gorgeous views.
Wolf, Thanks for the reply to my specific question. I was discharged at Treasure Island. I road the first Bart Train to Oakland
I have some new information on the impact of the massive January 25 million gallon sewage spill here. Properties in prime high rent Southwest DC are suffering serious property sales declines. No one wants to buy anything downstream from the spill near the Potomac river. That includes condos and townhouses. That may be affecting the data reported in your charts.
I hiked in the area of the spill in the area of Maryland where the spill originated. The whole area,1 mile or more, was under construction. You only saw bikers on the bike path, no walkers.
It stunk like hell, and you needed a mask.
something like that is really bad. Thankfully, it won’t last long, unlike chemical spills. Nature will eventually take care of sewage.
Right you are. SF is a beautiful city, unique in the US. It is even more unique in its weather (worldwide) – not hot, not cold, not gray, not rainy, not humid, and not dry. It is perfectly sunny (but not too sunny) and warm. The ocean is right there, and the bay is on the other side. You can fish without a license. You can ski not far away. Any type of women you like, they are there also.
@andy asks “Wolf, Will you write an article on ‘buying vs. renting’?”
You don’t need Wolf to write one. You should never even think about buying a home unless you think you are going to live in an area for at least a decade or longer. If you can currently rent for a lot less than buying keep renting and investing the difference (not blowing it like most people).
P.S. To andy, I was born in SF and lived in the city for a decade, the weather is great in most of the city year round but the west side has more fog than most people would like and you won’t meet “Any” type of women in SF, there are plenty of woman with blue hair (and who used to be men), but I don’t think there are any “trad wife” types (who can cook, want to have chickens at home and that can adjust the valves on a tractor)…
By ‘any women you like’ I of course meant hot Asian women. With that in mind, the tractor valve adjustment is not a huge deal breaker for me. But yeah, I’d be surprised if my girlfriend cooked a meal from more than two ingredients.
The eye about SF is held in the eye of the beholder. SF seems to be a self absorbed dead beat, claiming that they are special and have a right to assemble a dossier on every American citizen
and store that information in a data center who’s only purpose is to blackmail the population with electronic evidence acquired
FYI the new AI data centers are in Texas, Virginia, etc., not in San Francisco.
”
People should understand that prices will never fall much in San Francisco. It is a small, beautiful, and very desirable city with zero new construction
”
LoL
Yes, it has miserable weather. Cold in the summer (fog), wet and cold in the winter. It is SO much nicer 25 miles north, south or east of SF. I lived there 20 years and can call it my hometown, but just don’t say the weather is any good whatsoever.
The glass is quarter full, eh?
I’ve lived or visited in nearly every city in the USA. I would say San Fran has the nicest weather in the USA.
Yep, the real question is how much deflation will our banking/corporate overlords allow? It seems to me that “mark to fantasy” is still very much in play when looking at balance sheet valuations. 2008 redo? Maybe, lots of “pipe farms” going up in my neck of the woods….
Howdy Prisoners. Does this mean your 30 Year Sentence has been extended? Not really. FREE yourself with a HELOC if you can learn something new.
Bubba, most of us don’t need any more debt, HELOC or otherwise. As a retired guy, I am debt free!
Glad to see your comment AA:
Far as I can remember, not far for damn shore these days,,, you’re the only one continuing to comment on Wolf’s Wonderful who is older than I am.
We too, in this case the family We, are debt free, and I cannot emphasize how great it feels to be able to live on my SS alone, even though my spouse continues to want to work with a great group of folx,,, and, of course, being happily married,,, I don’t argue with her…
Also retired but not debt free. Why would I use any of my 7 figure cash stash to pay off my 240k, 2 5/8% mortgage? It’s called free money. But like the other happy retiree’s, debt free besides. My philosophy in retirement is called “buckets”. Create as many as you can with cash flow, stop saving, and then start spending every dollar in those buckets monthly. God is good!
I’ve been in the home I purchased in ‘19, 30yr at 2.3 percent. VA, no down loan, already half paid for. Doubled in “value “ since purchase. Mortgage with taxes and insurance included less than $1k per month. In a neighborhood with multi-million dollar homes. WI. All homes save a few have been mortgage free for decades.
I am a debt free/ready cash buyer……,still on strike due to pricing.
Howdy James. I made a great living buying foreclosures while using HELOCs on my primary residences for purchases….Made $$$ even during the Govern ment created crash of 2008 and on…..
Bubba,just looking for a small home with a lot of land(ok,@ least 20+ acres,not a huge amount but enough to allow me to do what I want in regards to shop/chickens for eggs/goats for milk and cheese and entertainment value/on the move shooting range etc.
I now spell 1911 in handle as site will now for whatever reason not allow posters to have actual numbers in handle(WHY?).I originally did this to separate me from other James’s,did not want them to come across like idiots.
There is no housing bubble in Chicago at least. I bought my house in 2007 (peak pricing) for 550K and now it is priced at 690K. Almost 20 years, 25% gain is extremely modest. I think the housing property is depressed due to sky high property tax, insurance, and higher mortgage rate.
If anyone is looking for crash in housing, it will be a long wait.
Your statement sounds like home prices were mostly flat with a reasonable upward trend over those 20 years. But there was a huge trough in the middle. You bought near the peak after a gigantic run-up, then prices crashed, and then prices exploded from those low levels.
Don’t I wish I bought my house at the bottom. My next door house was sold short for 400K in 2009.
I think the real bottom is not entirely accurate reflection of value though because lots of low price transactions were due to neglect and damage. I bought a water damaged penthouse for 120k, spent tons of money fixing it, endured persistent problems, insane management fee, and later sold for 560k. The next gain is not as impressive as it appeared on paper.
I live around the Charlotte area, the property value decline in sfh has largely been offset by transplant pressure. A lot of working age northerners move here for lower cost of living, better weather, and job opportunities. More price reductions would be beneficial for the area but I think it’s been difficult to keep pace with the population growth for the past two decades.
Raleigh is probably the most similar circumstance on the list being in the same state, but it tends to be a locus for different kinds of jobs.
Phil P.
What type of jobs on Raleigh and Charlotte?. My wife and I are looking to moving to NC as well next year probably. Thank you in advance.
“Raleigh is full, don’t move here, please!” (c) every Raleigh area resident over the past few years.
On a serious note – unless you are happy living in Little Mumbai, I’d be extremely diligent choosing a house/development in Raleigh area, and definitely skip ~80% of new builds
Raleigh is more tech, government, and medicine while Charlotte is more business-ey (Finance, administration, logistics, etc). They are both fairly well rounded cities and have jobs in all sectors, but Raleigh is mostly known for the Research Triangle Park area and Charlotte for all the banking HQs. Both cities also have a relatively high WFH ratio since COVID.
Look at McKinney, TX who in their right mind would think anything here is worth more than 100k haha.
Are these inflation adjusted numbers?
To spare you Wolf’s wrath: no these aren’t inflation adjusted. You don’t adjust housing prices by the inflation of gasoline, services, rent, etc. It doesn’t make sense even though on first glance you might think it would be useful.
Some more useful divisors or comparisons that would probably give you what you want:
Mortgage vs rent
Mortgage vs income
House price vs income
This is exemplary of the ramifications of bad Fed policy.
Driving long rates to all time lows (QE). Great for prices and those who moved quickly to lock in those low rates. Now they are locked into that home. How can they give up mortgage rates (under 3%) that is essentially BELOW the current inflation rate?
The Fed interrupts free markets….continually.
People are left to deal with these interruptions.
Real Estate, one of the most illiquid markets ….. has become more illiquid, IMO.
Agree. While I like the idea of an independent Fed, I think it’s only independent of Congress and the White House. It’s a prime example of regulatory capture.
Congress needs to rein it in, permanently, which means no QE ever, no matter how bad things supposedly get, no 2% inflation target (the target should be 0%, I have never bought into the whole “deflation is evil” mantra), and it means no interest rates below the inflation rate.
Yeah, that whole sub 3% rate thing was a dumb idea. Everybody and their Mom refinanced. Total interference in free markets by Uncle Sam. And that’s why the US housing market is turning into what we see in Europe where prices are rather high in most places. It’s normal to rent there and desirable HCOL places like California are the New Europe.
The 30-year U.S. Treasury bond yield hit 5.20% on May 19, the highest level since mid-2007, just before the 2008-09 financial crisis. The 10-year yield topped 4.68% the same day before retreating, but remains above 4.50%.
The trend is global: Yields on United Kingdom gilts, German Bunds, and Japanese government bonds have also been climbing.
Major stock indexes are just below historic highs, reflecting investor enthusiasm about artificial-intelligence plays, which could reach a fever pitch as some of the biggest AI developers prepare to come public. Higher bond yields provide competition for stocks, and raise corporate borrowing costs.
The proximate cause of the recent bond rout—bond prices move inversely to yields—is the rise in oil prices due to the continuing closure of the Strait of Hormuz, a critical energy-shipping waterway in the Middle East. West Texas Intermediate, the U.S. benchmark crude, nearly doubled to just shy of $113 a barrel on April 7 from about $67 a barrel on Feb. 27, the day before the war began.
Your charts speak loud and clear – housing is still a f-ing rip off ❗️❗️ A 26% reduction is like charging a person triple or quadruple the price for a new car, and then saying “Ok Mr. Smith, we’re giving you a 26% discount on your lovely new car.” 😡😡.
The housing market is a complete racket. And to think the ‘man in the house’ said he wants to keep housing prices high! 😡😡
We get what we vote for.
RE AGENTS LOLOLOLOLO
Seems like half the HQ’s in America have moved into Frisco or Plano in the last 10 years. McKinney is right next door and it’s a nice place. There’s the reason. High paying jobs and it was very inexpensive to begin with. I live in one of the more desirable / safer middle-class DFW suburbs and see my home up 230% in 20 years to a whopping… $270,000. THE SKY IS FALLING!!! Not really.
This is why Fort Worth is the fastest growing big city in America and just bumped who knows which city off to reach the top 10 right behind Dallas. This is why Schwab just moved from San Francisco to FW. It’s why a billion dollar datacenter is being built between a couple miles outside my town. It’s why MP Materials is building a billion dollar plant to process their California minerals near Fort Worth.
$270,000 house, folks. 20 years old. $90,000 median household income. 5% poverty rate. All the amenities. under 20 minutes to downtown. Sure, it’s 9,000 degrees for 6 months of the year, but my point is not all of these places are in a bubble. It’s not all doom and gloom. And places like San Diego are that expensive for a reason. It’s no longer a place for middle class people to raise a family and that sucks, but the weather for real and San Francisco people are propping up the prices.