Home prices fell year-over-year in 25 of the 33 big expensive cities in April, a bunch set multi-year lows, led by Oakland & Austin, down by 26% from 2022. Two set new highs.
By Wolf Richter for WOLF STREET.
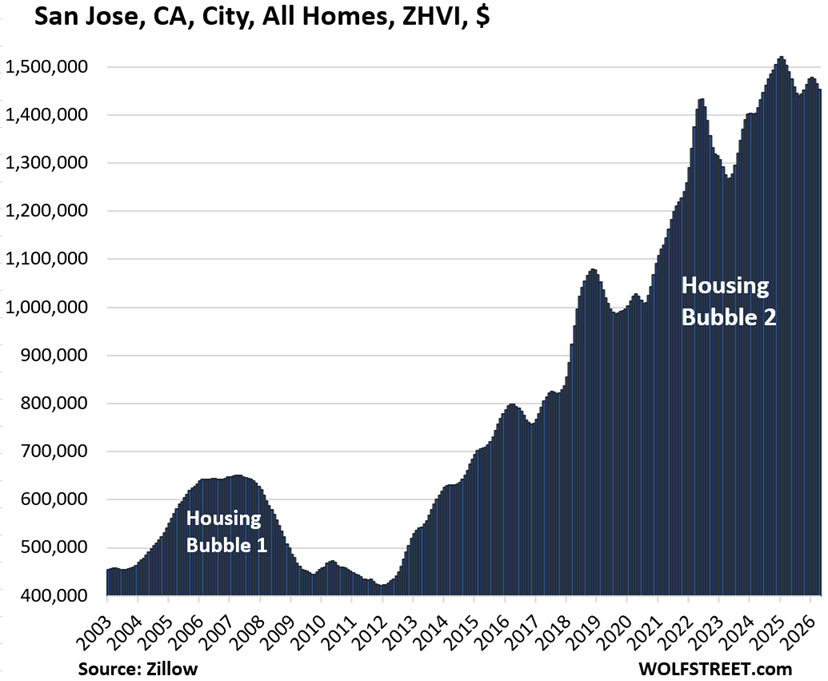
In 28 of the 33 big and expensive cities we track here, mid-tier home prices in April have dropped from their respective peaks in prior years. In 19 of those cities, the peaks were in 2022; in 7, the peaks were in 2024; and in 2, the peaks were in early 2025 (Boston in April 2025 and San Jose in January 2025). All of the prices are on a seasonally adjusted basis.
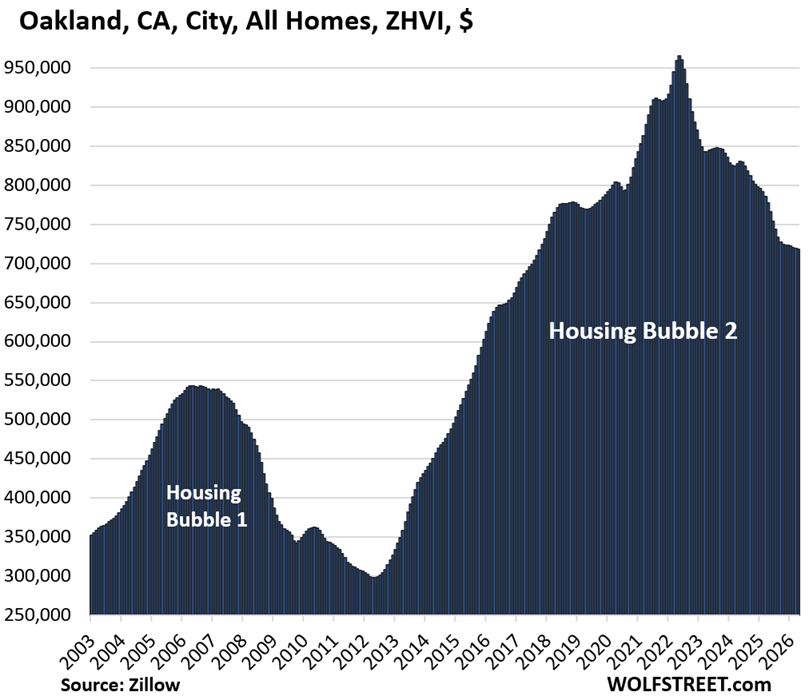
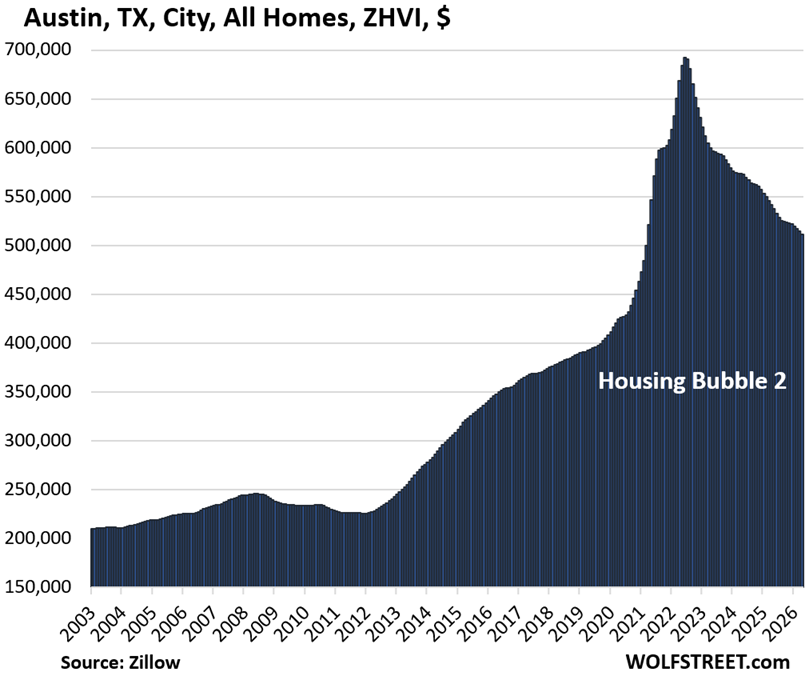
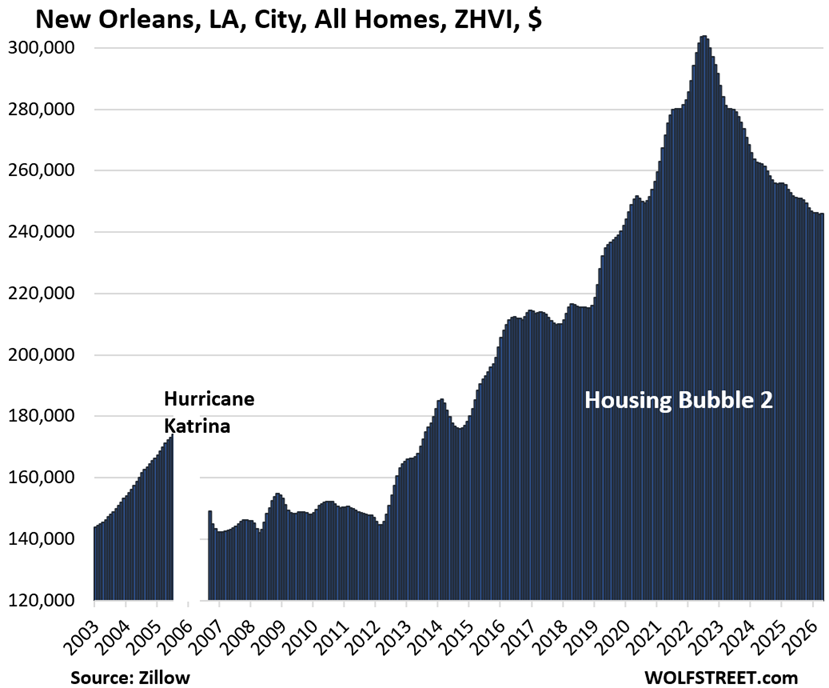
The 28 declines from their respective peaks were led by Austin (-26%), Oakland (-26%), and New Orleans (-19%). The new entry, and just barely, Boston, was down 1% in April from the high in April a year ago.
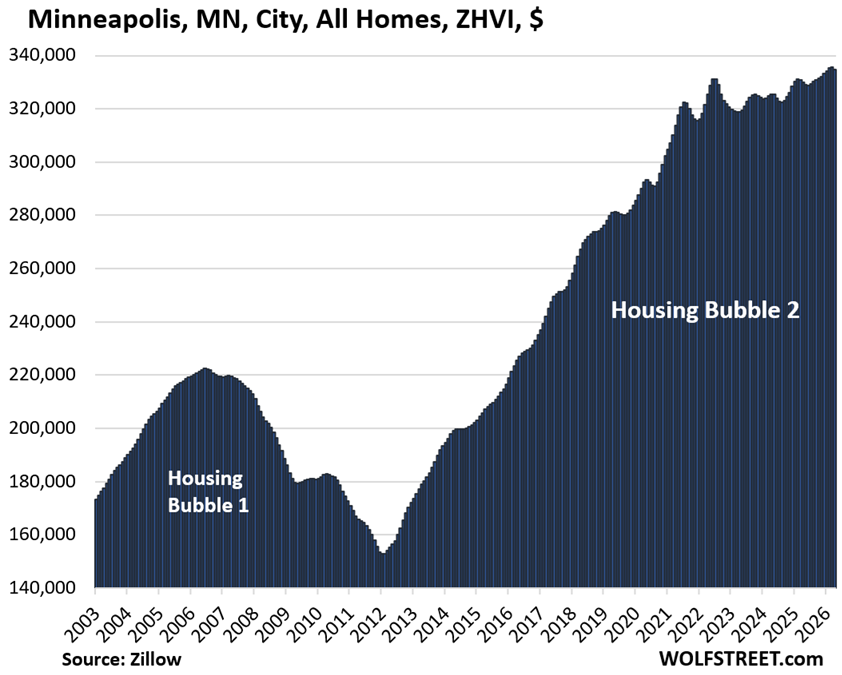
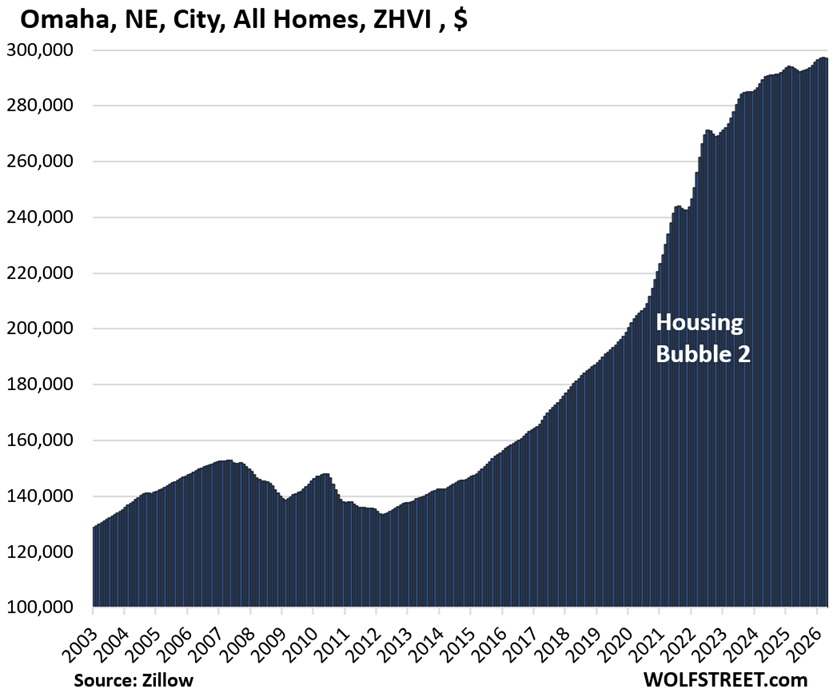
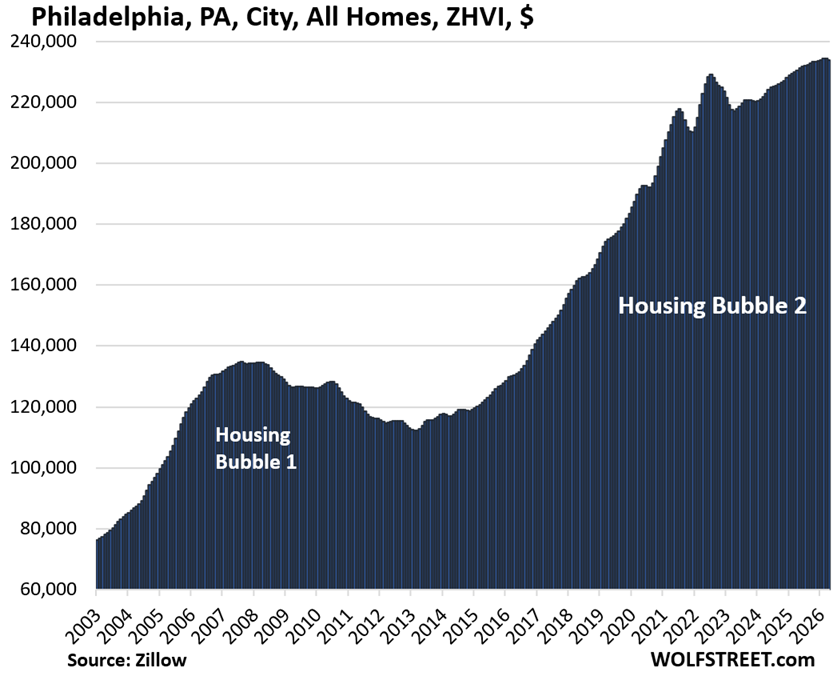
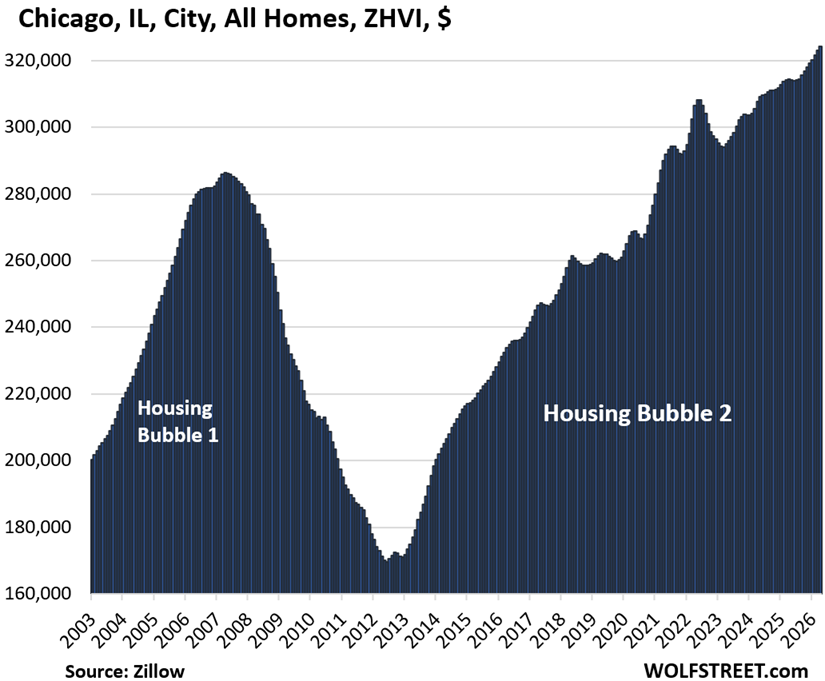
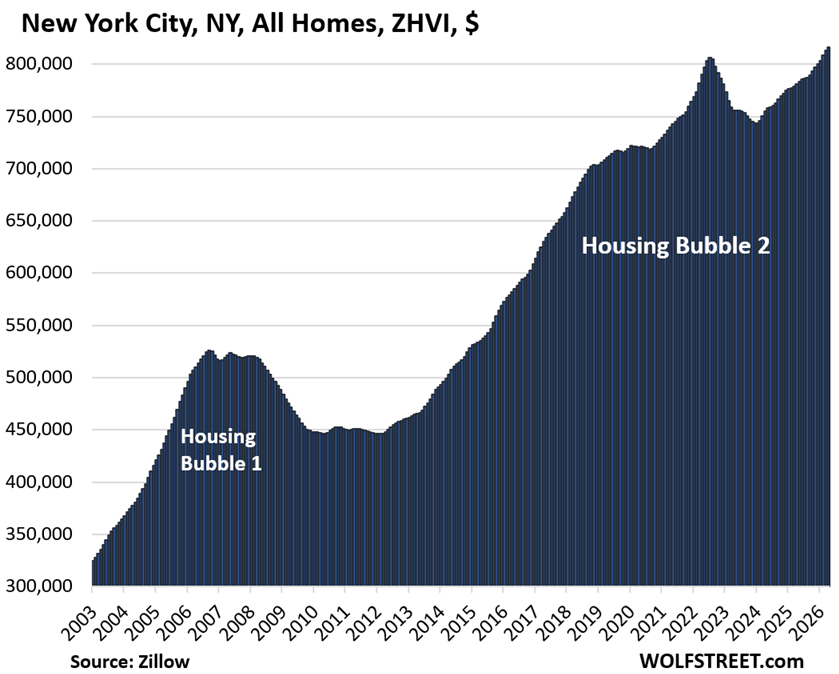
In the remaining 5 of the 33 cities, prices rose to new highs in 2026, seasonally adjusted: New York City and Chicago in April; Philadelphia, Omaha, and Minneapolis earlier in 2026.
On a month-to-month basis, prices declined in 27 of the 33 cities in April, seasonally adjusted; rose in 3 cities; and were unchanged in 3 cities.
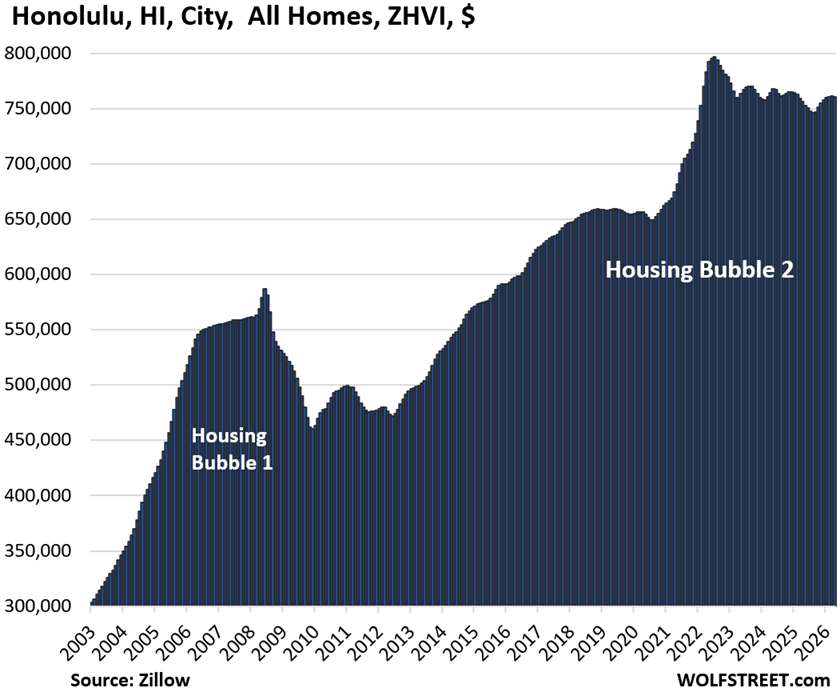
On a year-over-year basis, prices fell in 25 of the 33 cities and rose in 8; but in 3 of those 8 cities where prices rose year-over-year, prices remained below their highs in prior years (San Francisco, Salt Lake City, Honolulu).
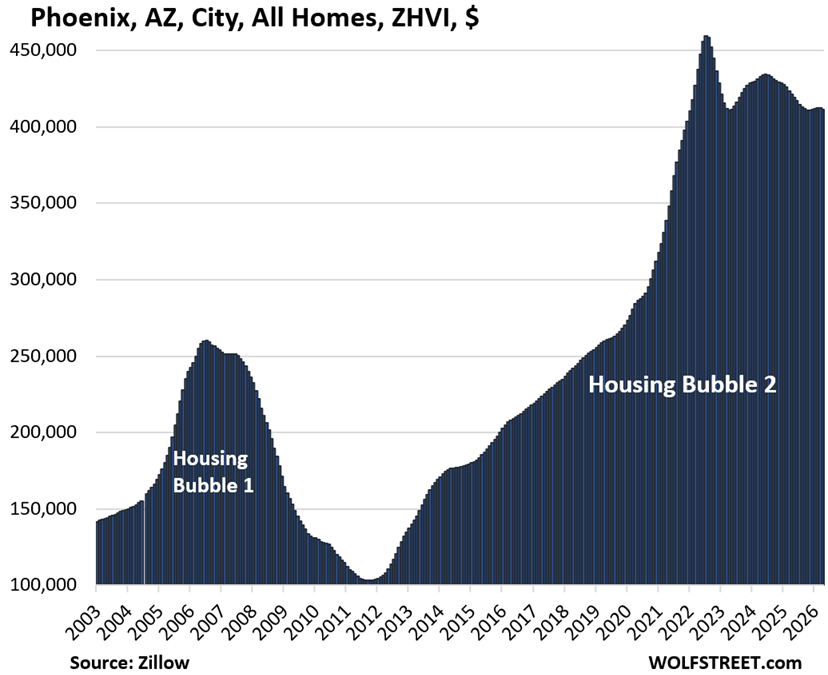
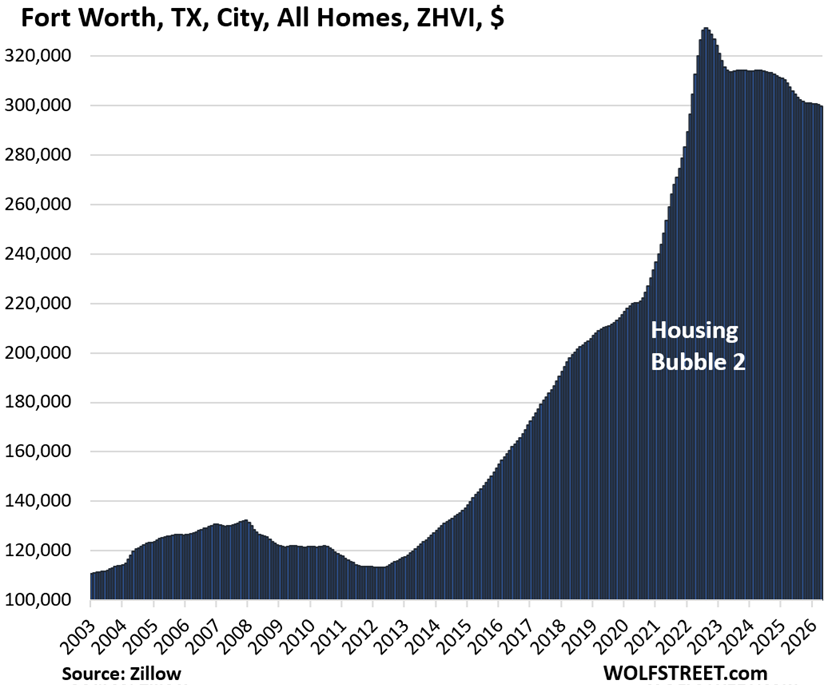
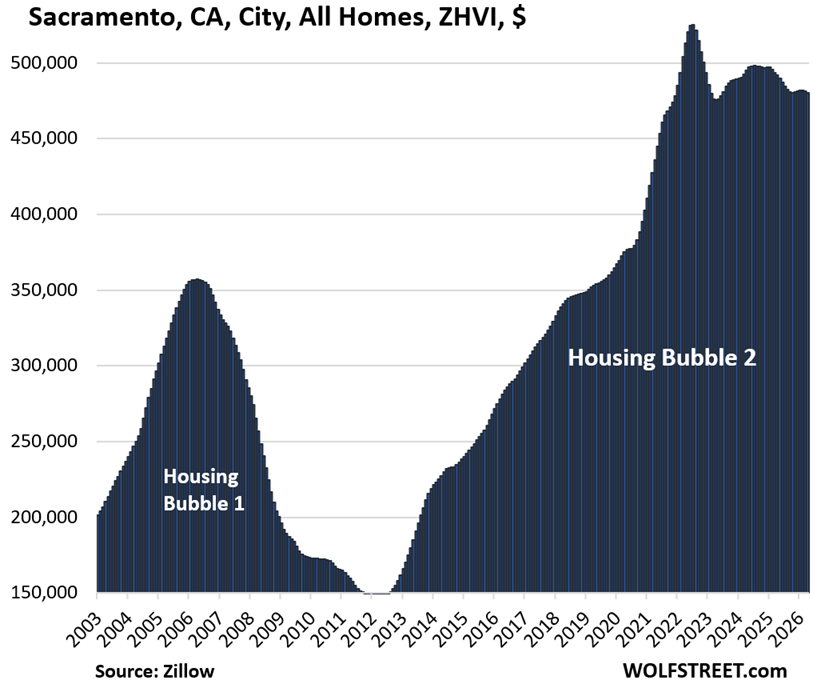
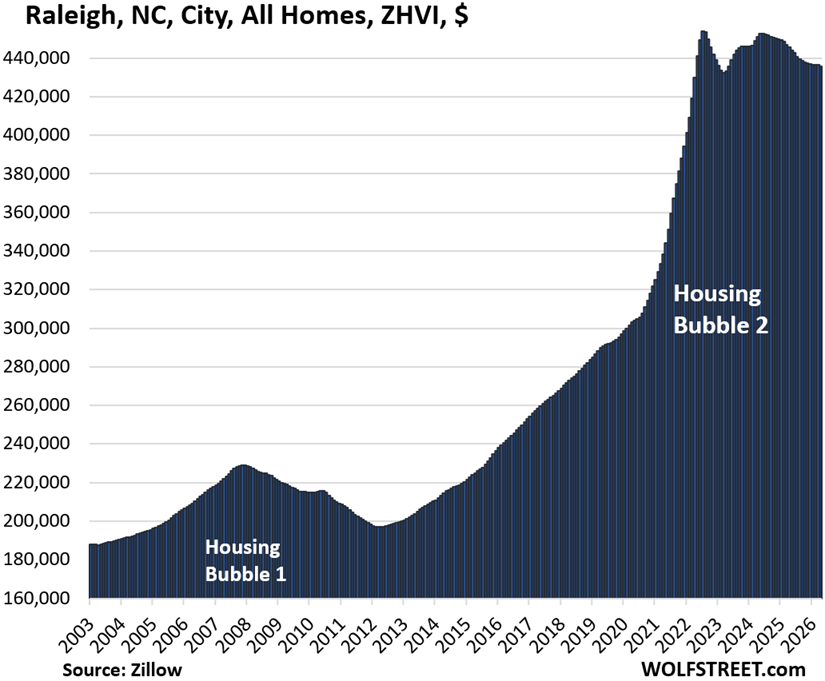
From mid-2020 to mid-2022, all of the 33 cities here had experienced huge price spikes, such as Austin (+62% in two years), Phoenix (+60%), Fort Worth (+50%), Raleigh (+49%), and Sacramento (+39%).
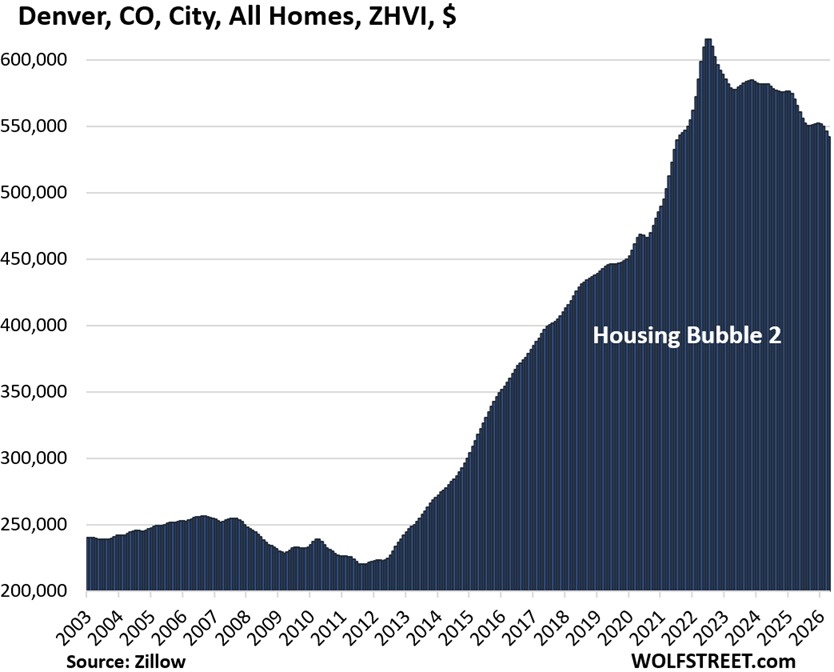
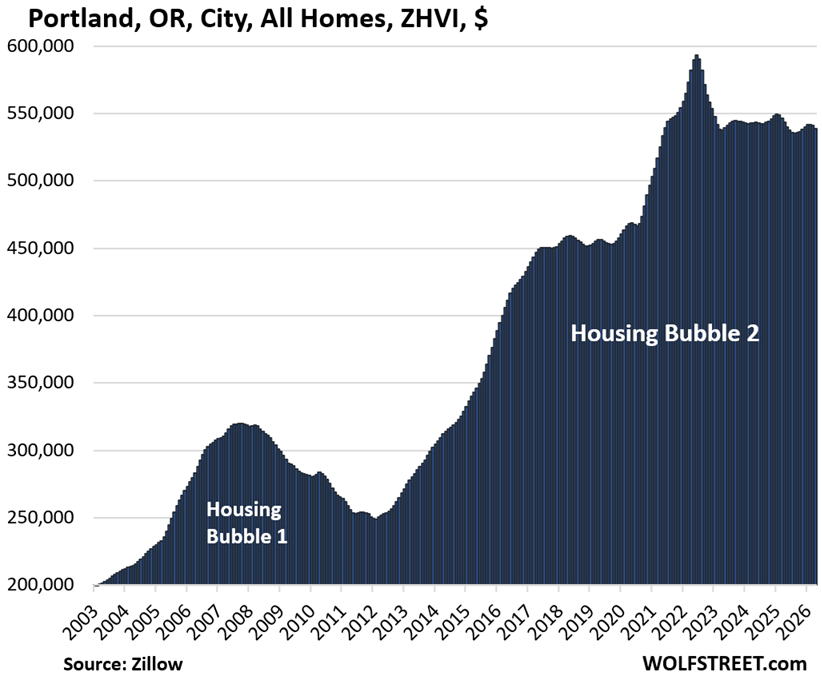
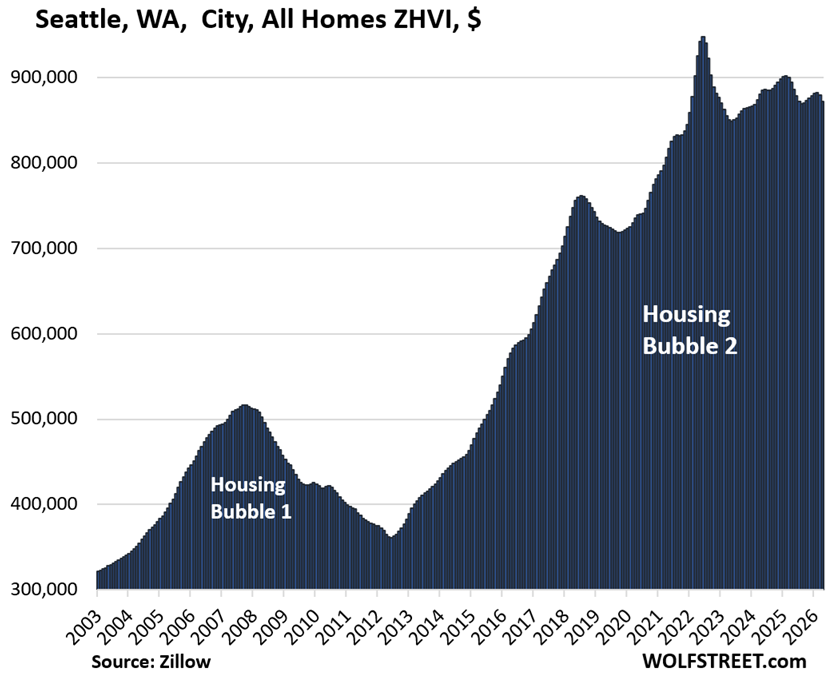
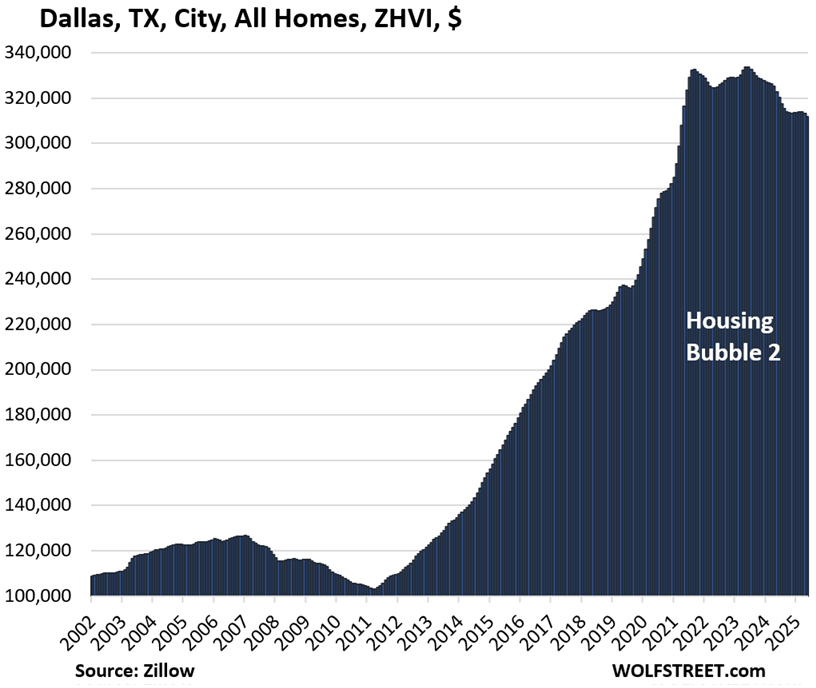
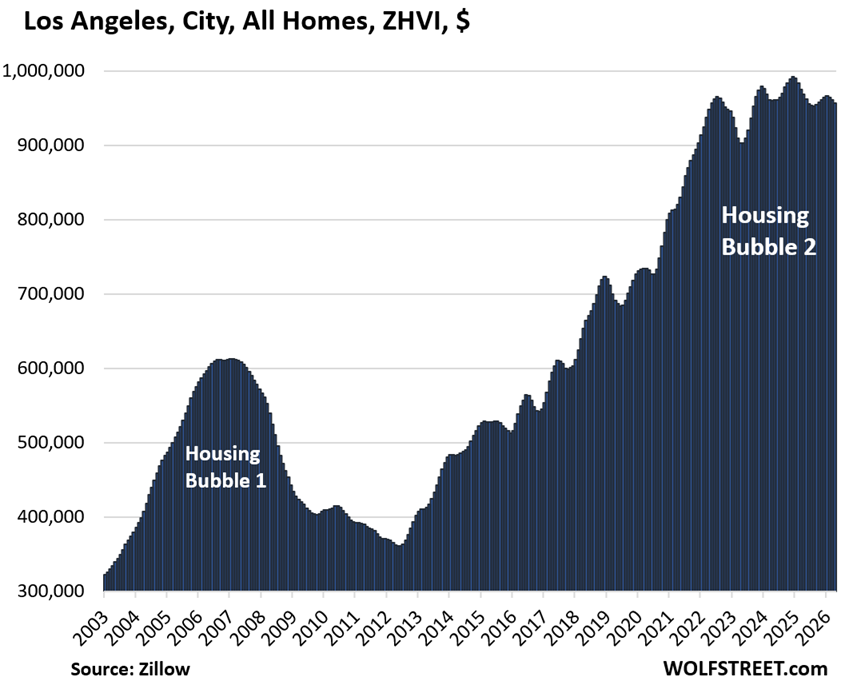
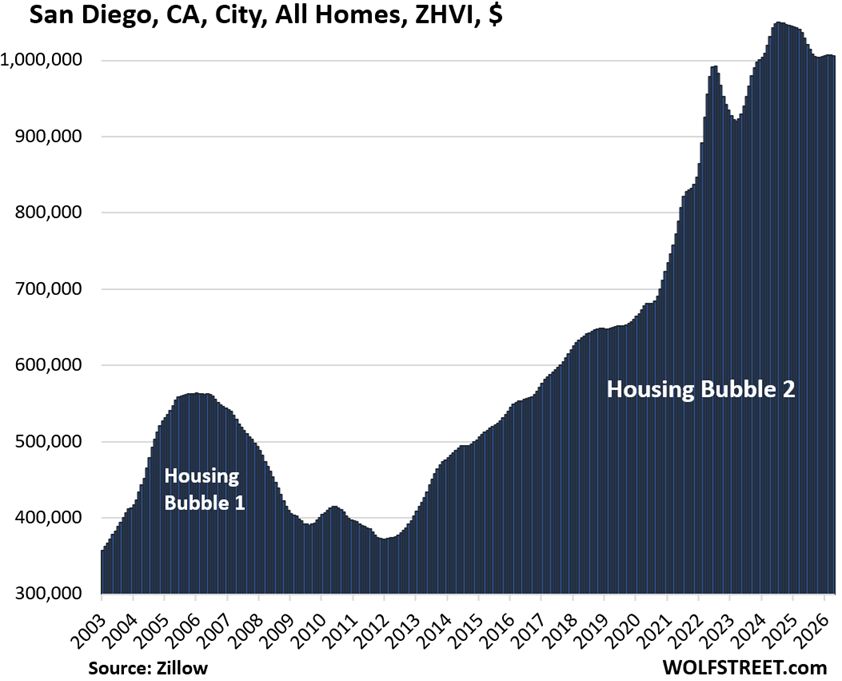
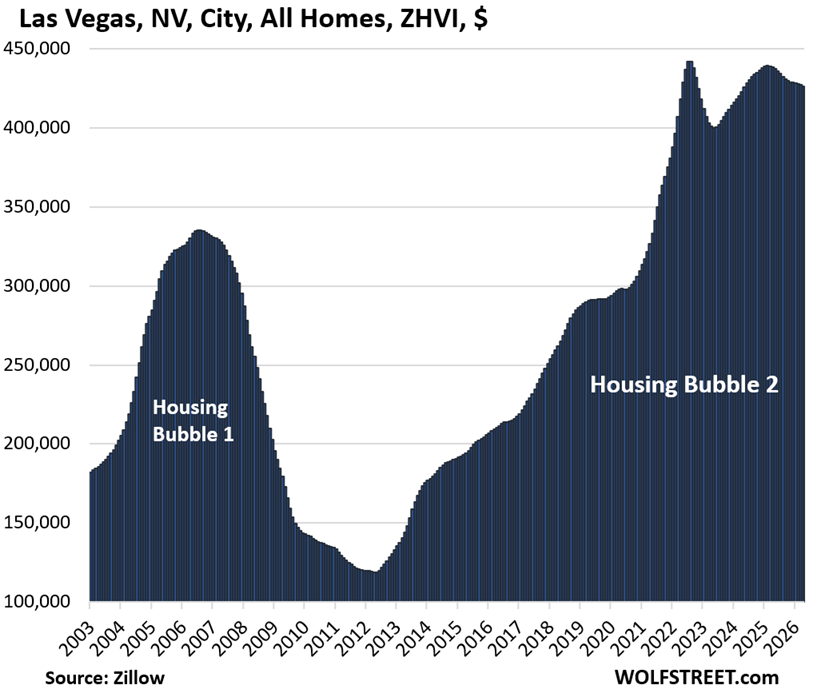
Those price explosions, piled on top of the already outsized price gains in the years before the pandemic, were fueled by the Fed’s reckless free-money policies, which included mortgage interest rate repression with trillions of dollars of purchases of Treasury securities and mortgage-backed securities, which generated the below-3% mortgage rates, even as inflation was heading toward 9%. Those policies blew up the housing market, as you can see in the charts below.
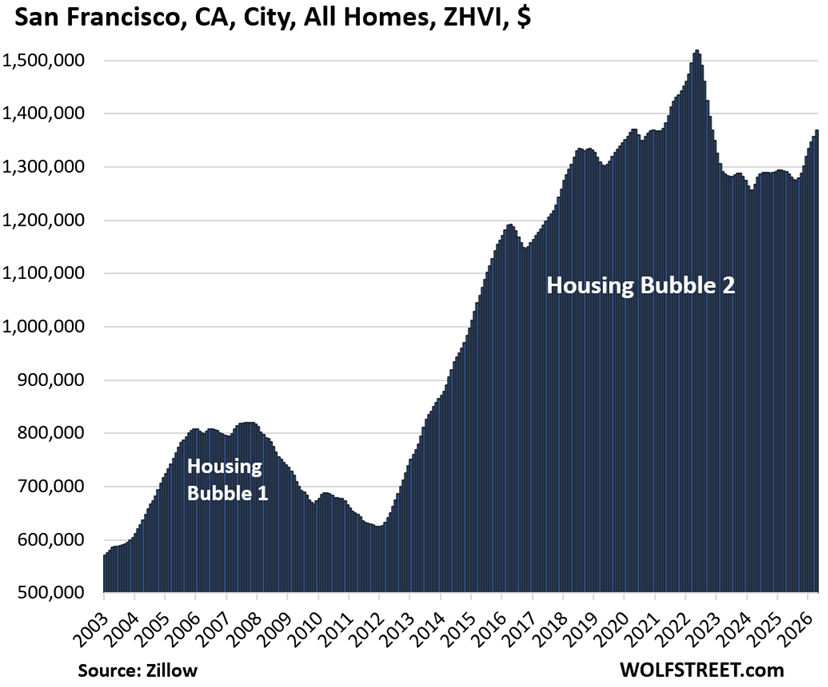
In San Francisco, despite layoffs in the broader tech sector in the city, people are hired in by AI companies with huge compensation packages. And people who have been working for local AI companies, such as OpenAI, are now sitting on massive wealth through their stock compensation packages. And they’re out there in the epicenter of the AI investment bubble, buying homes at the upper end of the range, leading to a phenomenon called locally the “mansion shortage,” and it has trickled down into the mid-tier homes (the middle third of the price range) that we track here. Despite the recent price surge amid those mid-tier homes, they’re still down by 10% from the peak in mid-2022.
By contrast, prices fell at an accelerated pace in San Jose (Silicon Valley), where mid-tier homes are even more expensive than in San Francisco.
The price index here is the seasonally adjusted three-month-average mid-tier Zillow Home Value Index (ZHVI) for single-family homes, condos, and co-ops, released on Saturday. Mid-tier means the middle-third by price in each market. The ZHVI is based on millions of data points in Zillow’s “Database of All Homes,” including from public records (tax data), MLS, brokerages, local Realtor Associations, real-estate agents, and households across the US. It includes pricing data for off-market deals and for-sale-by-owner deals.
To qualify for the list, the city must be one of the largest by population and be among the more expensive cities where the ZHVI for all mid-tier homes must have been at least $300,000 at some point.
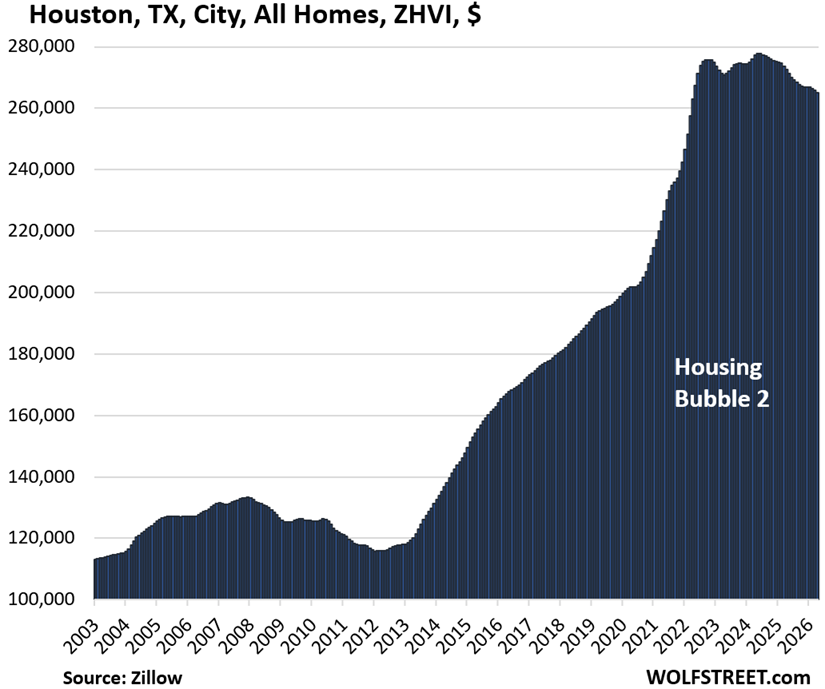
Some large cities don’t qualify for this list because the ZHVI for mid-tier homes never reached $300,000, despite the surge in recent years, such as the cities of New Orleans, Houston, Philadelphia, Memphis, Oklahoma City, Tulsa, Kansas City, Cincinnati, Pittsburgh, and a slew of others.
But Houston, Philadelphia, New Orleans, and Omaha are included anyway: Houston and Philadelphia because they’re the fourth-largest and sixth-largest cities in the US; New Orleans because it got very close to $300,000 in 2022; and Omaha, because it’s now very close to $300,000 and is the most expensive big city in the center of the US.
The 33 Most Splendid Housing Bubbles.
In the little tables, MoM = month over month; YoY = year-over-year. The column furthest to the right shows the percentage increase “since 2000.” All seasonally adjusted.
| Oakland, City, CA, All Homes, Prices | |||
| From May 2022 peak | MoM | YoY | Since 2000 |
| -26% | -0.1% | -7.6% | 246% |
Lowest since October 2017.
| Austin, TX, City, All Homes, Prices | |||
| From Jun 2022 peak | MoM | YoY | Since 2000 |
| -26% | -0.6% | -5.7% | 153% |
Lowest since March 2021.
| New Orleans, LA, City, All Homes, Prices | |||
| From Jun 2022 peak | MoM | YoY | Since 2007 |
| -19% | 0.0% | -2.7% | 106% |
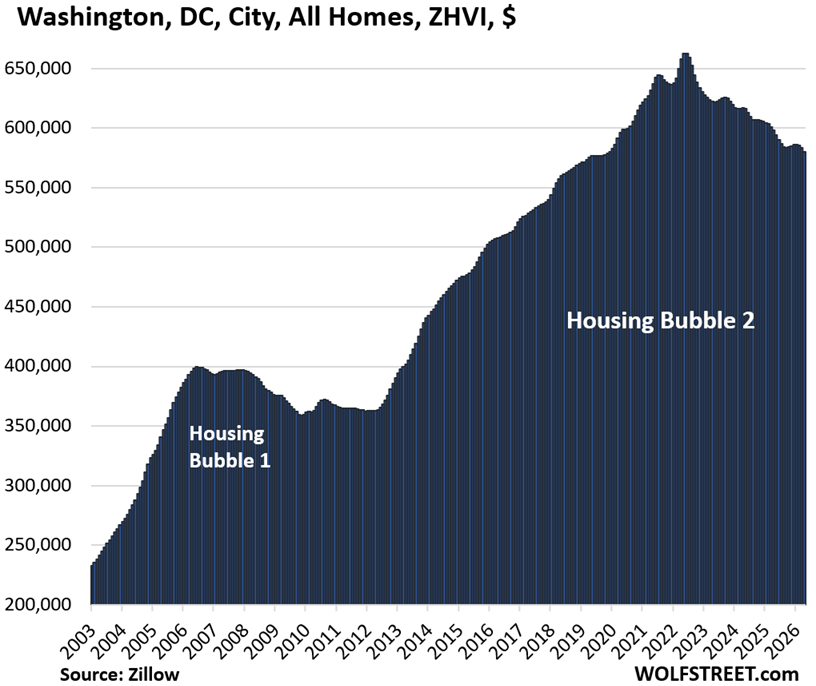
| Washington D.C., All Homes, Prices | |||
| From Jun 2022 peak | MoM | YoY | Since 2000 |
| -12% | -0.6% | -3.0% | 256% |
| Denver, CO, City, All Homes, Prices | |||
| From Jun 2022 peak | MoM | YoY | Since 2000 |
| -12% | -0.8% | -4.2% | 198% |
| Phoenix, AZ, City, All Homes, Prices | |||
| From Jul 2022 peak | MoM | YoY | Since 2000 |
| -11% | -0.2% | -2.4% | 249% |
| Fort Worth, TX, City, All Homes, Prices | |||
| From Aug 2022 peak | MoM | YoY | Since 2000 |
| -10% | -0.2% | -2.5% | 188% |
| San Francisco, CA, City, All Homes, Prices | |||
| From May 2022 peak | MoM | YoY | Since 2000 |
| -10% | 0.8% | 6.0% | 228% |
Trickle-down effect: The “Mansion Shortage” trickles down to mid-tier home prices.
| Sacramento, CA, City, All Homes, Prices | |||
| From July 2022 peak | MoM | YoY | Since 2000 |
| -9% | -0.2% | -2.3% | 285% |
| Portland, OR, City, All Homes, Prices | |||
| From May 2022 peak | MoM | YoY | Since 2000 |
| -9% | -0.4% | -0.9% | 216% |
| Seattle, WA, City, All Homes, Prices | |||
| From May 2022 peak | MoM | YoY | Since 2000 |
| -8% | -0.8% | -2.5% | 227% |
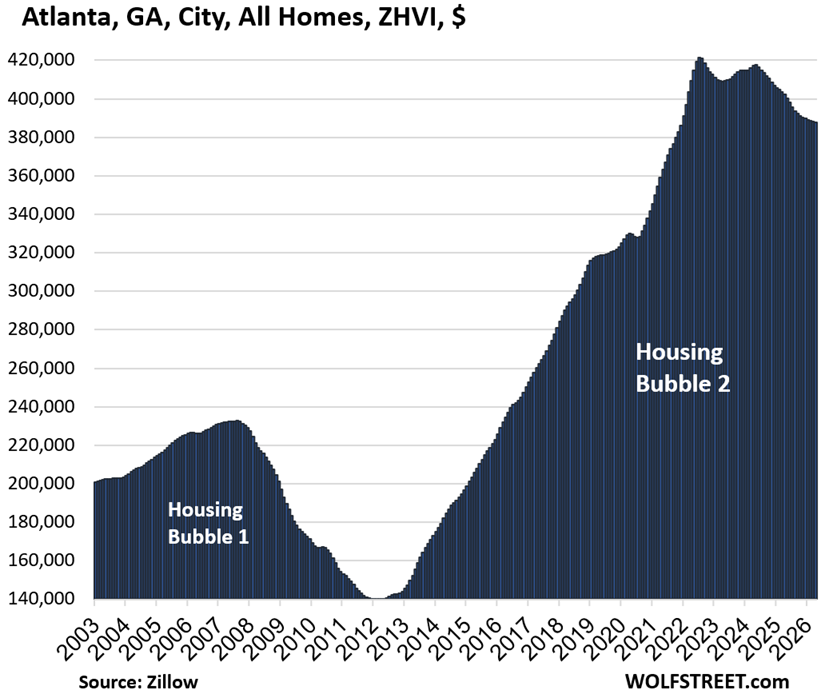
| Atlanta, GA, City, All Homes, Prices | |||
| From Jun 2022 peak | MoM | YoY | Since 2000 |
| -8% | -0.2% | -3.6% | 140% |
| Dallas, TX, City, All Homes, Prices | |||
| From May 2024 peak | MoM | YoY | Since 2000 |
| -7% | -0.4% | -3.4% | 214% |
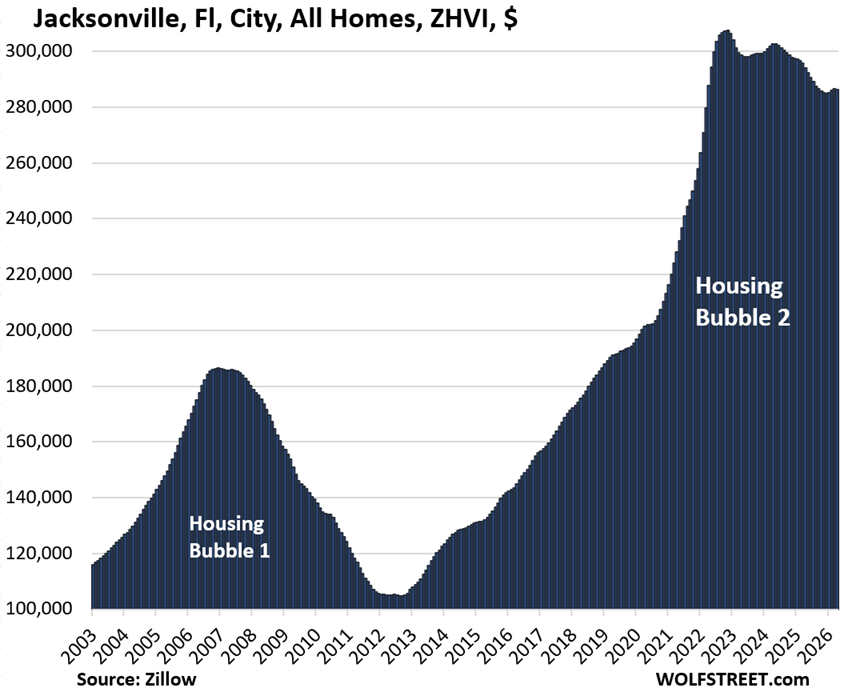
| Jacksonville, FL, City, All Homes, Prices | |||
| From Nov 2022 peak | MoM | YoY | Since 2000 |
| -7% | 0.0% | -2.6% | 204% |
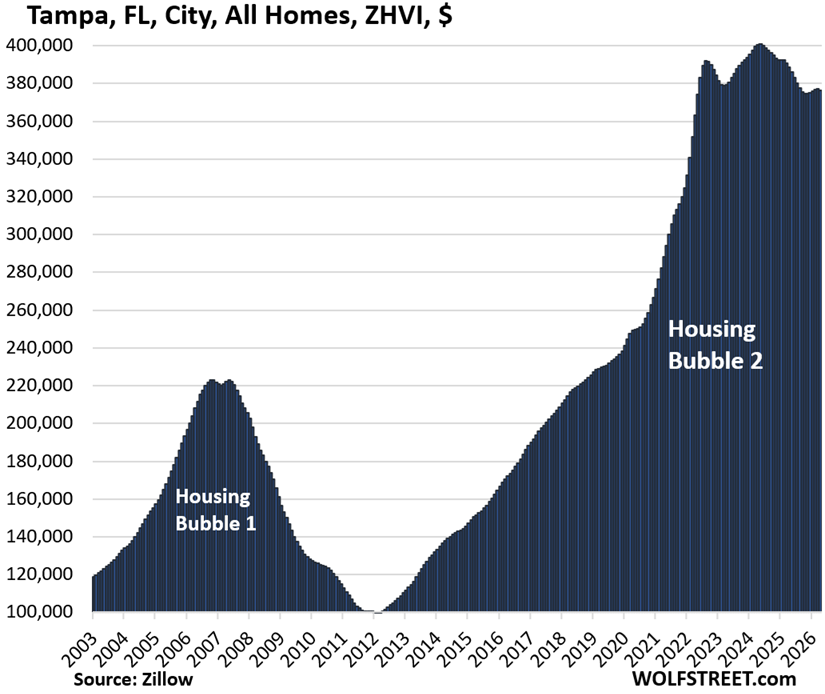
| Tampa, FL, City, All Homes, Prices | |||
| From May 2024 peak | MoM | YoY | Since 2000 |
| -6% | -0.2% | -3.1% | 311% |
| Houston, TX, City, All Homes, Prices | |||
| From Jul 2022 peak | MoM | YoY | Since 2000 |
| -5% | -0.3% | -2.7% | 153% |
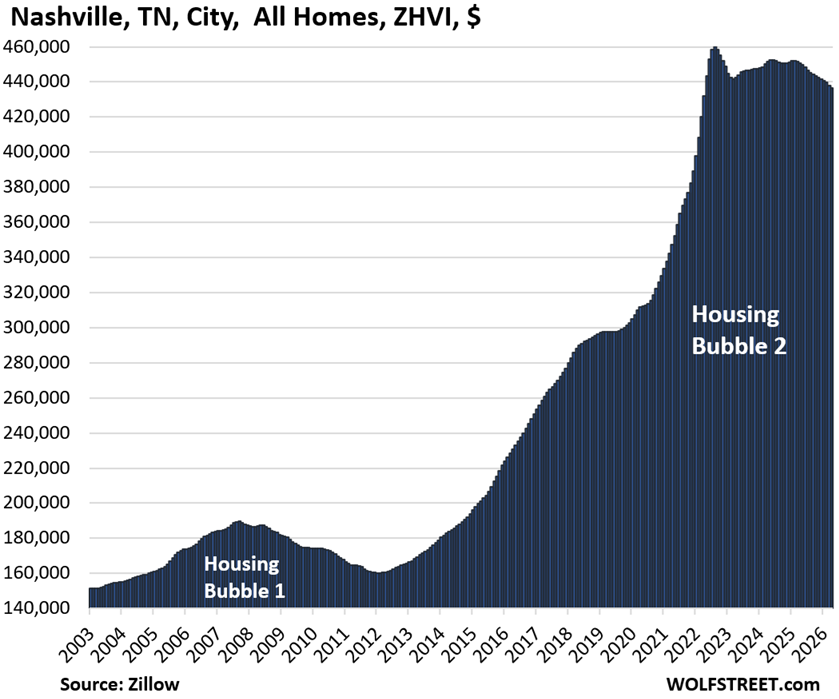
| Nashville, TN, City, All Homes, Prices | |||
| From July 2022 peak | MoM | YoY | Since 2000 |
| -5% | -0.4% | -3.2% | 213% |
| Honolulu, HI, City, All Homes, Prices | |||
| From Jun 2022 peak | MoM | YoY | Since 2000 |
| -5% | -0.2% | 0.6% | 207% |
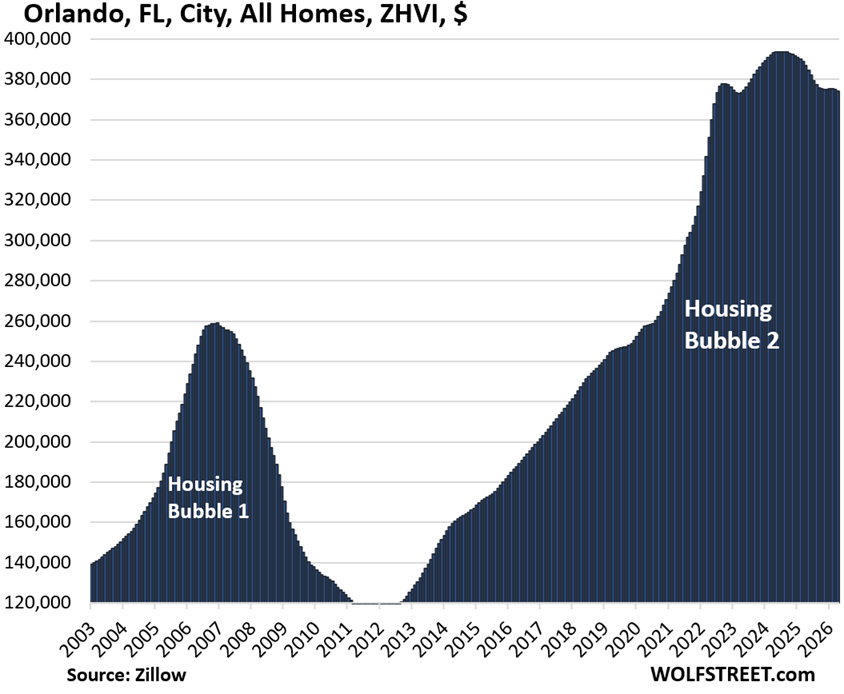
| Orlando, FL, City, All Homes, Prices | |||
| From Jun 2024 peak | MoM | YoY | Since 2000 |
| -5% | -0.2% | -3.2% | 240% |
| San Jose, CA, City, All Homes, Prices | |||
| From Jan 2025 peak | MoM | YoY | Since 2000 |
| -4% | -0.9% | -2.5% | 337% |
| Los Angeles, CA, City, All Homes, Prices | |||
| From Dec 2024 peak | MoM | YoY | Since 2000 |
| -4% | -0.4% | -1.2% | 325% |
| San Diego, CA, City, All Homes, Prices | |||
| From July 2024 peak | MoM | YoY | Since 2000 |
| -4% | -0.1% | -2.9% | 347% |
| Las Vegas, NV, City, All Homes, Prices | |||
| From June 2022 peak | MoM | YoY | Since 2000 |
| -4% | -0.2% | -2.8% | 176% |
| Raleigh, NC, City, All Homes, Prices | |||
| From July 2022 peak | MoM | YoY | Since 2000 |
| -4% | -0.2% | -2.2% | 149% |
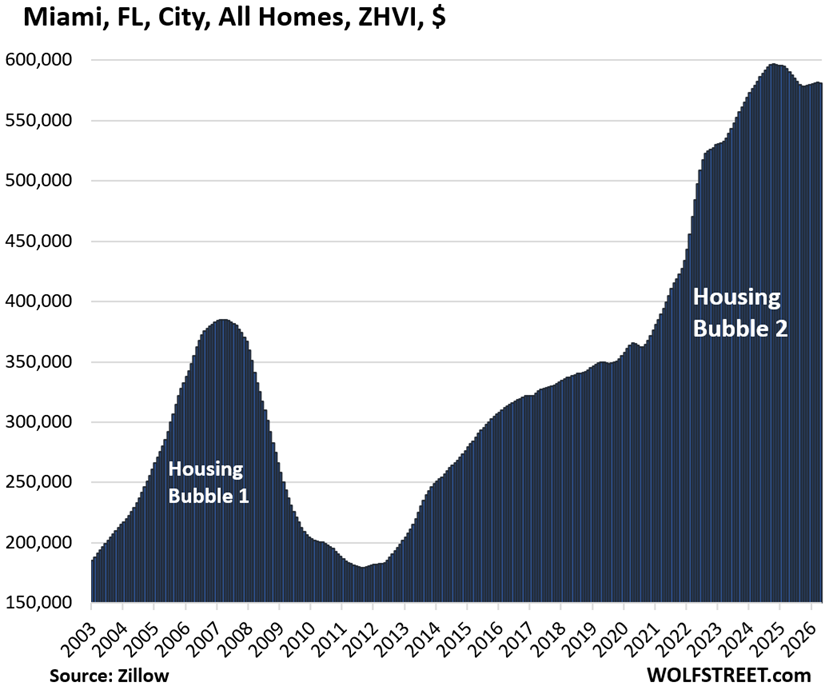
| Miami, FL City, All Homes, Prices | |||
| From Oct 2024 | MoM | YoY | Since 2000 |
| -3% | -0.1% | -1.6% | 342% |
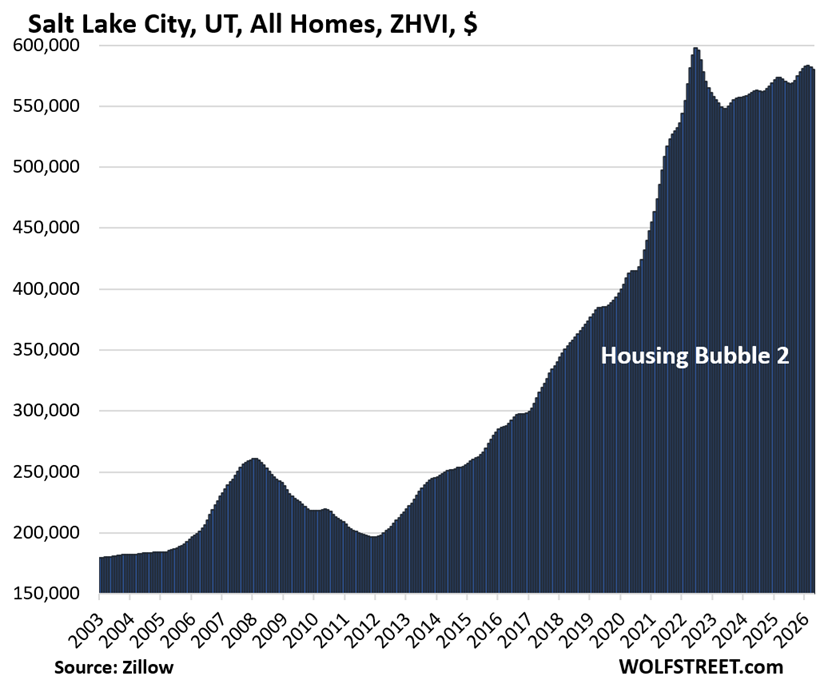
| Salt Lake City, UT, All Homes, Prices | |||
| From July 2022 peak | MoM | YoY | Since 2000 |
| -3% | -0.4% | 1.4% | 240% |
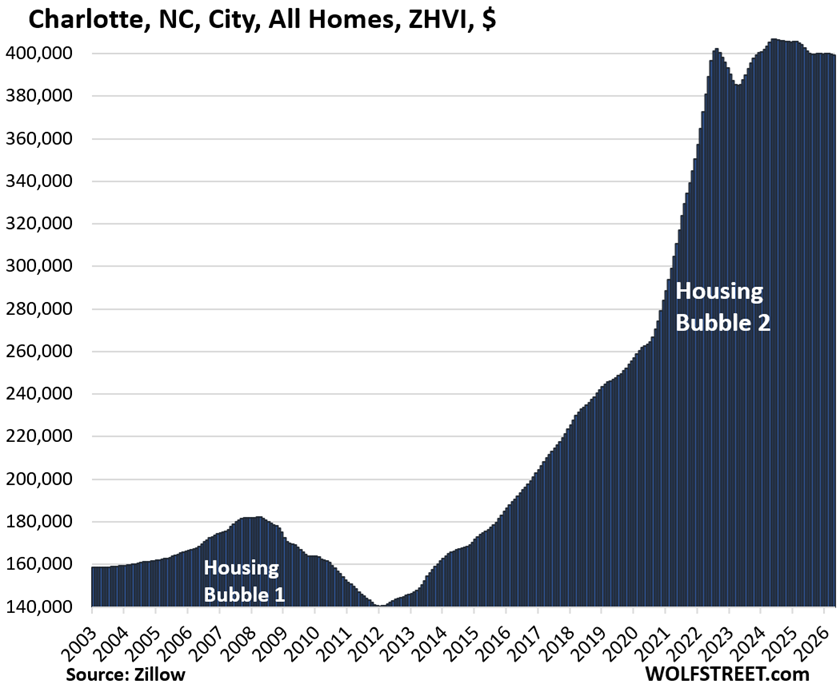
| Charlotte, NC, City, All Homes, Prices | |||
| From May 2024 peak | MoM | YoY | Since 2000 |
| -2% | -0.2% | -1.2% | 168% |
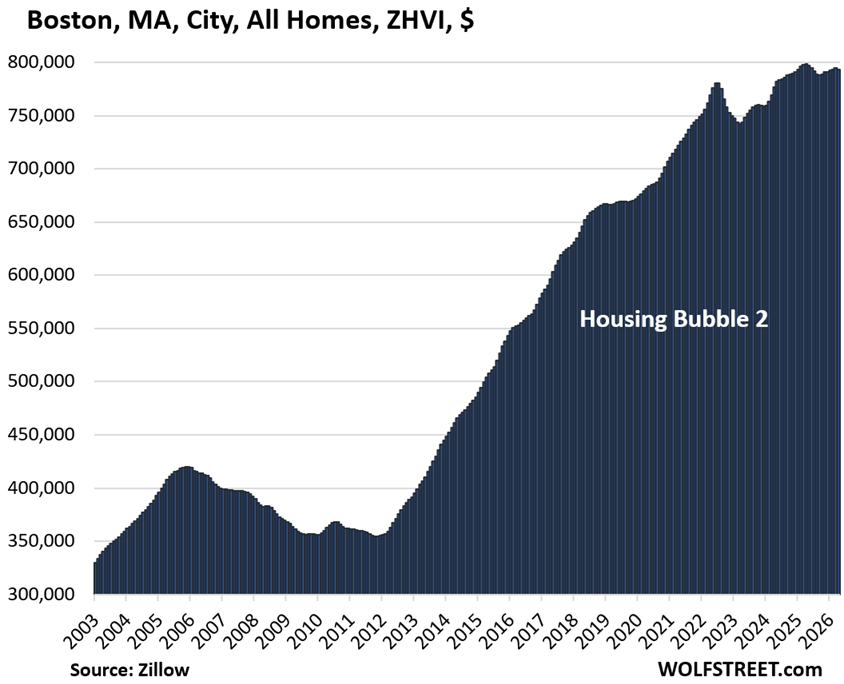
| Boston, MA, City, All Homes, Prices | |||
| From Apr 2025 peak | MoM | YoY | Since 2000 |
| -1% | -0.2% | -0.7% | 265% |
| Minneapolis, MN, City, All Homes, Prices | ||
| MoM | YoY | Since 2000 |
| -0.3% | 1.4% | 196% |
| Omaha, NE, City, All Homes, Prices | ||
| MoM | YoY | Since 2000 |
| 0.0% | 1.3% | 151% |
| Philadelphia, PA, City, All Homes, Prices | ||
| MoM | YoY | Since 2000 |
| -0.3% | 1.5% | 272% |
| Chicago, IL, City, All Homes, Prices | ||
| MoM | YoY | Since 2000 |
| 0.4% | 3.1% | 116.7% |
| New York City, NY, All Homes, Prices | ||
| MoM | YoY | Since 2000 |
| 0.3% | 4.4% | 240% |
Enjoy reading WOLF STREET and want to support it? You can donate. I appreciate it immensely. Click on the mug to find out how:

![]()
More support for a previous observation: this is not a good market for buyers, it is only less bad. Less bad is still bad. Buyers paying today’s prices are still taking on a relatively high level of risk.
Anyone considering a home purchase should review Wolf’s Housing Bubble charts. Look at Phoenix, for example. What a precipice. Only government involvement could cause such rapid and large price appreciation amounts.
Some of these oversized appreciation levels can be attributed to Powell not receiving something he fully expected: a recession. Fed interest rate hike cycles are often (but not always) accompanied by a recession. I remember Powell saying after one of the early hikes (think this was in 2022) something to the effect that “many families will be affected by this action.” Fedspeak for “these hikes will probably cause a recession.”
That may have happened if Powell had not capitulated too early on further hikes. That may have prevented some of these astronomic housing price increases. Recessions are tough medicine but sometimes necessary for the long term health of the economy.
Like the point, but I wouldn’t even say recessions are tough medicine.
Unemployment rate might rise 2% for a year or two, so no biggie there. The main impact is a 20-40% drop in asset prices, which usually just rubs out 2-3 years worth of outsized undeserved gains, and impacts only the top 10% who can easily handle it, so no biggie there either.
We need recessions to impose discipline on the system, so we avoid excessive asset price run ups and moral hazards with related UNEARNED wealth concentration. Recessions also allow the economy to avoid huge depressions.
Says a guy who thinks (just wrote) losing a job is ‘no bigee’. I remember my Father in Law’s words when I lost my job in the ’81 recession/inflation nightmare. He said, “It’s always trimming the fat when it’s the other guy, but when it’s you losing the job it’s a goddamn nightmare.” Only 2%, hey?
It is also the guys/gals on the bottom who tank first, never those with money and assets. When a ‘reduction’ hits, many don’t even notice, but the laid off lose a great deal. I remember having to work away from home….up north, 3 month contracts. For years. New mortgage, little kids and a wife to support, and neighbours across the street didn’t miss a snack, let along a paycheck or meal.
“We need recessions to impose discipline on the system, so we avoid excessive asset price run ups and moral hazards with related UNEARNED wealth concentration. ”
You think the billionaire insiders will forsake asset price run ups and improve their morality with a recession? Seriously? (Matthew 25:29): “For to everyone who has, more will be given and he will grow rich; but from the one who has not, even what he has will be taken away.”
This is a new gilded age built upon the backs of working people. If a 2% rise in unemployment occurs the rich will have to hide within their gated communities. WFH…ha ha.
You seem to think there is a better answer than accepting temporary recessions from time to time. I’d like to hear from you what that is. Please don’t tell me it’s what they’ve been doing, which generated 25-30% inflation in six years, which hurts the little guys much much worse.
In order to stop the inflation, they need to end this irrational recession fear.
So you are complaining about this new guilded age that favors the rich (which is a direct result of not having any recessions and a subsequent asset bubble) while also opposing and complaining about recessions. Which is it that you want? Continue the status quo without sacrifices having to be made, or a fix to the broken system?? Ohhh that’s right…you want both…..
If the Banksters that crafted the liar loan/MERS/CDS etc. rip off had been prosecuted and sent to Pelican Bay for life then perhaps you would see honesty and justice have a chance. Does the name Madoff ring a bell? theCon dot TV has all the gory details. Wall St. got bailed out and 7,000,000 homes were foreclosed. Paul is right. Instead Obama was crowned “the man that saved the world economy” when nothing could be further from the truth.
When recessions occur, many working people lose jobs. Some lose their homes. It is tough for working people and people in retirement depending on a portfolio. Typically 10% unemployment is the result. For the rest of working people, investments decline in value, and retirement is delayed, but most people don’t lose their job or their home. No question tough for a lot of people, but for a majority of working people, not a major life event.
Recessions for the extremely wealthy are very different. They don’t generally end up in bankruptcy, unless they are leveraged, but very wealthy people have the majority of their net worth tied up in stocks and private businesses, which are always drastically affected by recession, someone like Elon could easily lose half or more of his net worth in a typical recession.
So while no one is hoping for people to lose jobs, the idea that recessions don’t touch the rich is simply incorrect. The rich just have a larger cushion.
Realtor here but have been focusing more on investing the last few years. There is so much pent up buyer demand in the market now. Priced a listing somewhat aggressively over weekend and had 20+ showings in 2 days and many offers.
I suspect those waiting for a significant crash may be disappointed cause the lack of sales activity the last 3-4 years doesn’t mean people have lost interest in home ownership. They are waiting and many are buying and that may keep this market propped up?
Cut the price and they will come. Price is the issue.
I call BS on “Only government involvement could cause such rapid and large price appreciation amounts.”
Price manias stem from “extraordinary popular delusions and the madness of crowds”, not government action.
The government after all is just a subset of the people.
Today’s delusion is that houses are assets – whose prices should be appreciated for capital gains – rather than slowly-depreciating capital goods that provide an essential service. Housing provides a service whose affordability is more critical to the health of the economy than any capital gains could ever be.
That delusion isn’t limited to the government.
“Nothing can save a people determined to suddenly grow rich” is a classic quote that comes to mind.
It’s the government manipulating the market by creating a mortgage tax deductibility policy that has fueled the entire modern concept of investing in your house to avoid tax and turning it into a savings tool. Furthermore, governments 2000 era policies forcing lenders to make loans to families in poor neighborhoods where they could not sustain the payments fueled the 2008 bubble. Every time government gets involved they distort markets. Distorting markets ultimately always leads to either bubbles or deficits (government over-regulation in California has created a massive shortage of housing supply).
Look at what’s happened to the cost of higher education since the government has agreed to guarantee the student loans: epic and unsustainable higher ed fee inflation that is going to ruin the lives of millions of young people who cannot repay the absurd loans that have been made to them thanks to government encouragement and involvement. There’s nothing more dangerous than the government getting involved in anything to do with markets. Not only do they consistently fuck things up, they overspend at every opportunity there by inflicting currency devaluation through money printing to solve the problem. The people who suffer most from this activity the poor who do not own assets the tend to resist inflation as they rise along with it. The government has always made the poor poorer despite deceiving them with false promises and Santa Claus policies.
You make my point for me. Yes, government involvement messes things up. Our only disagreement is that you seem to think “government” is the root cause. It’s not. The problem is the popular delusions – what Wolf sometimes calls “consensual hallucinations”.
You mention the “entire modern concept of investing in your house…” – that is exactly the popular delusion I mentioned in my comment. Just notice one thing: house mania was popular _before_ the government got involved.
Yes, the Government screwed things up, but only because of the pre-existing popular misunderstanding.
Usually the government only screws things up because enough people (mistakenly) believe they want it that way.
The same is true for college subsidies and loan guarantees.
“Make college more affordable” (what people thought they wanted) has indeed made it less affordable. But the root cause is, once again, various popular delusions, such as (a) the delusion that it’s worth going into debt to pay for any college degree, and/or (b) the delusion that it’s okay to have a system where everyone gets benefits they have neither earned nor paid for, paid for by someone else, and/or (c) the delusion that it makes sense to have non-dischargeable debt.
The list is long. But it’s not “the government’s fault” – we have the government we deserve.
The next question to ask is, how did we end up with so many popular delusions and unrealistic consensual hallucinations?
Take a look at the bubble charts in this article. Notice the direct and immediate inverse correlation home prices have with interest rates. When the Fed buys several Trillion in Treasury bonds, 10 year yeilds are driven down, and home prices, and also other asset prices, increase because everyone seems yield. Yes, bubbles are inflated by people seeking risk, but risk is encouraged by government artificially lowering interest rates. If there had been no QE, we would likely be living in a world with home prices and stock prices half what they are now, and with real income higher than it is now for working people.
Excellent article, very informative. Just one question, did the “Atlanta” chart get mislabeled as “Austin, TX”?
Thanks. Not mislabeled but mis-uploaded.
@Wolf – Rohry spotted that there are in fact 2 copies of the Atlanta chart in the article. I suppose it’s worth it, Atlanta looks extra-toppy, sorta like the next Austin or Oakland!
You couldn’t even make up fiction more ridiculous.
How people take the hot poker up their A$$ that is 2026 is beyond me.
Wolf, are you missing the Atlanta graph?
Not anymore. Thanks.
The general assumption here is that home prices in the us are still precariously high, even after reductions of 20 percent or so from recent highs in many markets. However if you compare home prices in the us to most g20 countries, and especially the richer g20 countries, us housing is relatively cheap. You are often paying 1/2 to 1/3 less than the other countries are. And lot sizes in those countries are usually smaller. Maybe us prices are regressing up to the global mean?
I live in fly over country.
Unfortunately its a blue state.
My 1600ft2 house property tax in 2025 was $5,600.
Lower house prices needed? I agree.
Lower taxes also a must.
I wish my 1600 sq ft house was 5600 in taxes. We pay 13000 and they keep going up. Blue State
You get what you pay for.
I just looked on Zillow and there is a 1,666sf 3×2 in town next to me on the SF Peninsula on the market for $2,895,000 if is sells for the list the property tax will be about $32,000K a year. Despita ll the property tax that comes in they still shake down parents to donate to the public schools and every few years work to increase the “parcel taxes” to get even more money for the schools.
The $32K plus fire insurance if it’s in a fire zone. I bet fire insurance is at least $20K if not $30K. I can live very comfortably in New Mexico with my wife for $50-60K a year.
Society would be so wonderful for everyone with an uneducated population.
Yeah but thanks to some administration of the past anyone who has owned that home since the 80s is probably paying 5k a year or less. In CA last person in pays the tab. There are multiple homes on my block where they pay 2400 A year, (Two are basically empty), and I pay 18000.
Homeownership has fallen for the first time in a long while. And the percentage of renters is up.
IMHO – doesn’t make much sense for any renter to become a buyer now, unless you just can’t stand being a renter anymore. The currency reset is a big threat of price escalation but that’s at least 2 years away.
And now a bill to stop Private Equity from buying houses is working it’s way through Congress, and that can’t help housing prices.
Does the Washington D.C data include parts of northern Virginia and Maryland or only the D.C area ?
These are strictly cities, not metros. So Washington D.C. is strictly D.C. San Francisco is strictly the city of San Francisco, not the San Francisco metro, which includes Oakland, Hayward, etc. Oakland is strictly the city of Oakland.
Hi Wolf – I know its a lot of extra work, but having numbers on the cities vs. the metro areas would be helpful.
it might be the suburbs in general are maintaining prices. My place in suburban Fort Worth is up 1-3% since fall 2023, and I have been puzzled by that (Did I get lucky, did I make a good buy) ?. Your comment gives me a clue as to why.
Quit bitching about what you don’t get!!! This is Wolf’s Kitchen and you eat what I serve or you don’t eat. I used metros until a few months ago; I stopped because they sucked because you get San Francisco and Oakland in the same freaking metro. Look at those two charts and repent. The metro just averages it all out. Same in other diverse markets, such as the Washington DC metro, the Chicago metro, etc. You think that I don’t think about this stuff??? I do this for a living.
But the Dallas metro isn’t all that diverse. Prices are down everywhere. And there is a HUGE amount of new supply from homebuilders on the market, and they’re cutting deals. Lennar will sell you a brand-new house in North Texas for $275k.
And no, suburbs are NOT “maintaining their prices.” On the contrary. Arlington, TX, a suburb of Dallas, is down 6.9% from the peak, which is more than Dallas and less than Fort Worth. Other suburbs in the area are down quite a bit more, such as Plano, one of the more expensive suburbs of Dallas (ZHVI of $507,000): -8.4% from the peak two years ago, -5.5% year-over-year. And prices in Garland, a suburb of Dallas: -8.4% from the peak in 2024 and -5.4% year-over-year. The suburbs are worse than Dallas. Same as in San Francisco, BTW. Same as in lots of other places. And your neighborhood is the one exception?
But prices in cities in the Dallas area are down a lot less than prices in cities in the Austin area. So yes, you’re lucky that you didn’t buy in the Austin area in mid-2022. You might have been underwater by $100k by now.
I don’t know where you live so I cannot check. Don’t use median prices, they will f**k with your mind because they jump and plunge month to month due to shifts in the mix of what sold, not prices. And check prices against April a year ago and against April two years ago, and you will see.
How close is Cincy to the 300k zhvi?
$253k. And it has started flattening out.
thanks Wolf. I realized what a lazy question it was after I posted it. I repent.
I went to zillow and poked around the Cincy zhvi and for those who want more granularity in the data; I was surprised that zillow breaks things down in to a handful of general neighborhoods within the city itself.
Zillow also breaks it down by zip code.
What’s the deal with Omaha? The only obvious explanation for continued gains is cheapness relative to everywhere else.
Huge percentage price gains at nearly all cities near the center of the US during 2020-2022, including Tulsa, OKC, Kansas City, etc. But price gains have stopped now, even in Omaha. OKC is now negative YOY by a hair, Tulsa is still up YOY but flat over the past four months. Omaha has also flattened over the past four months with a drop in April, and the yoy gain has steadily declined is now down to just 1.3%.
Philly says Philadelphia MSA, not city. Is that data for just Philadelphia, or the surrounding areas as well?
I think that’s the city. If you google zillow zhvi for philadelphia, it shows 233814, +1.5%. But if you scroll down there are neighborhood values. Like East Kensington neighborhood (wherever that is) is 348630.
It’s “city” and should have read “city,” and it reads “city” now. It was just mislabeled.
Wolf are you still happy with the ZHVI after moving to it from the old case shiller numbers?
Yes, the Case Shiller is useless, covers only 20 metros (no Houston, no Philly, no Austin, no Omaha, no nothing), has no data at all on cities, and condo data on only a handful of metros. In addition, it lags months behind. It was a huge innovation when it was invented, and then got bought by Corporate America that left it to wither, currently owned by S&P Global.
The metro data that it does have is very close to (but is months behind) the metro data of the ZHVI, and other than the lag, I don’t have a problem with the limited data that it does have.
It looks some of markets have turned around and are going higher now. Am I reading the graphs correctly?
Was Sarasota Florida eliminated from this new analysis?
Anyone have thoughts on the timing of the Florida condo market from an investment standpoint?
Opposite. They were going higher late last year and early this year but now are going down. Nearly all had month-to-month declines over the past two months, seasonally adjusted.
According to Zillow, Orange County CA just hit a new high.
There was a huge influx of buyers from the Palisades fire according to high end real estate brokers.
By a hair, +0.1% month to month, +0.8% yoy.
If we see some acceleration of the % declines going into summer (May, June) I think maybe we’ll finally see the start of the drop many of us have been hoping for. Right now it’s too soon to tell – looks a lot like the start of last summer
Also would be helpful if the media picked up on the housing decline narrative. Like I’ve been saying for awhile half of the problem with this market is psychology – people believing that soon as rates drop housing is going to jump 20% yoy again (this creates stubborn sellers and fomo buyers). Soon as the narrative/collective group think psychology of the general public turns we should see the bottom fall out.
How can you say that? I post home prices city by city, with some of them down by 26%. And you come up with this generic stuff. Home prices go city by city. That’s why I posted 33 charts of 33 cities.
Wolf maybe you can comment on how real estate data is increasingly diverging. Zillow, Redfin (who just killed most of their tool), Altos, Reventure, shiller, NAR, etc. have in my opinion never been farther apart on just current/recent data than they are now. Some showing price increases vs declines in markets, lots of inventory vs tight inventory, new listings, sales, etc.
On your data set the biggest divergence vs other providers is the FL cities. Miami, Tampa, etc. are down a lot more from peak in a lot more data sources.
And no one really wants to talk about why at this moment there is bigger spreads in data (even accounting for difference methodologies for relisting, condo included vs not included, etc. that have always been present).
You’re making up stuff. Zillow and Case Shiller do NOT diverge.
Case Shiller only covers 20 metros (MSAs, not cities). So you compare each metro that it covers to the SAME metro on Zillow, and you will see that they do not significantly diverge. If you look at seasonally adjusted data at one, make sure you compare it to the seasonally adjusted data of the other. The CS lags Zillow by a couple of months, you have to shift the data by about that much.
And the national Zillow index (not seasonally adjusted) and the national Case Shiller index (not seasonally adjusted) also match (the national CS index uses the FHFA House price index for markets that it doesn’t cover). For example, for April, the Zillow national index shows a year-over-year increase of 0.73% (rounded 0.7%), and the Case-Shiller National index for “February,” latest available, shows a year-over-year increase of 0.66% (rounded +0.7%).
Interest rates are the biggest problem period.. 4 to 5 percent Mortgage rates would offset most of these price increases and actually help to reduce prices by getting people to the negotiation table. Also governments should get there budgets in order to reduce property taxes back to 2022 levels. Greed is not good for the economy remember pigs eat hogs go to slaughter
No, the biggest problem is that the Fed’s interest rate repression since 2008 was like a virus that ate up people’s brains, and now people like you think that 6.5% mortgage rates are high, and that prices are fine. Mortgage rates not high. What’s way too high are prices. They need to come down. Lower property prices will also reduce property taxes. Solves both of your problems. Those too-high property prices are toxic.
Shiller and Zillow may not diverge much (I havent gone through all of the pairs), but NAR, Altos, Reventure, Redfin, etc. all have shown considerable divergence.
But I’m also going to say its ridiculous to compare a Feb vs April result from 2 different systems that do show a small difference. At least use the same month when comparing.
1. You people ask me for stuff and then you bitch when you don’t get what you imagined. Go look up that shit yourself!
2. “At least use the same month when comparing.” Like I said, look up that shit yourself and quit bitching because the CS does not have a value for February, it only has a three-month average called “February,” which is the average of Dec, Jan, and Feb. The Zillow version (raw) is per month for the national figure. So it doesn’t match timewise anyway.
3. The YoY increase at Zillow for February was 0.43% compared to the 3-month average of the CS for Dec, Jan, and Feb (called “February”) of 0.66%. there is no difference between the two because that’s well within the margin of error.
4. The big difference between Zillow and the CS is that the CS lags Zillow a couple of months, as I pointed out.
5. The yoy change has been between 0% and 1% at both for months.
6. NAR’s median price YOY change is very similar, a very small gain in recent month, +0.9% in April. There is no divergence there.
7. I don’t look at the others.
The housing market in the Swamp is a complete wreck. Housing is unaffordable. Buyers are on strike. Sellers are not moving. Lenders have resorted to illegal schemes to make loans. We have had to get out of the appraisal business for now because the cost of doing business exceeds the fee structure that the lenders are will to pay. It’s turned into a gigantic pyramid scheme whereby new recruits are bought in to work for free to get experience to qualify for a career which doesn’t exist. We are in for a repeat of 2007 all over again or worse. Look for 30% to 40% reductions in existing housing prices going forward, including a rise in foreclosure sales. The only solution is to do what the Air Force captain in NAM once said”
“We have to destroy the village in order to save it”
People who make urbanist vids on YouTube seem to be bullish on cities like Chicago and Philadelphia for delivering the kind of affordable, walkable, transit rich communities that the sunbelt and the heartland typically eschew. I wonder if the social media trend towards embracing those types of cities is showing up in the home value indices seen in those cities.
Indeed. Chicago is underpopulated though, so plenty of opportunity, With that said, the chart presented here is mostly driven by suburbs.
“the chart presented here is mostly driven by suburbs.”
No, this is the CITY of Chicago, the administrative area under mayor Brandon Johnson.
I am actually a bit surprised that prices are not tanking faster and more universally given the huge rate change. Whatever normalization may mean, it seems like it may be a 30 year process rather than 10. A whole generation where ownership is nearly pointless, or worse, a generation that cannot use house ownership as part of their retirement strategy. Seems to me.
Blame the NAR and social media hype. I think we’d see declines sooner if most the general public didn’t think rates were going to drop and housing would take off again and similarly home owners think they just need to hold out for the rate cut and then they’ll get that 2021 price…
The whole Power is trying to keep the home prices stable. Have you not heard POTUS saying, we need to keep home prices stable.
Unless and until, the rates shoot up, and the psychology is broken, I don’t see crash coming but prices have indeed crashed in many one hot cities and slow decline coming elsewhere.
Agreed that it is a pricing issue. Just saying there is a lot of more pent up demand than I expected.
Some discussion on demographics and the boomer effect on home prices . My small neighborhood in East Texas Tyler maybe 150 homes developed in 2006-2009 full of baby boomers are born between 1946 and 1965 roughly so are starting to hit 80. I bring this up because we have a neighbor that rides his bike and chats with folks 3 times and day so finds out about death moves etc.
in the last year we had 4 deaths aged from 65-80 , 4 moves due to moving closer to family . Homes are 3500-4500 sq ft.
Sales take about 90 – 120 days and it’s all about price . Lower prices and one can find buyers.
Agee with Wolf caution to folks buying prices are elevated and affordability is the key . If one lowers the price can find buyers .
It isn’t just housing. Vehicles have went up an average of 150% in the same time period. Roughly what housing has done in my area. Maybe a bubble maybe just inflation?