Some industries hired, others cut jobs: we zoom out with charts by major industry categories.
By Wolf Richter for WOLF STREET.
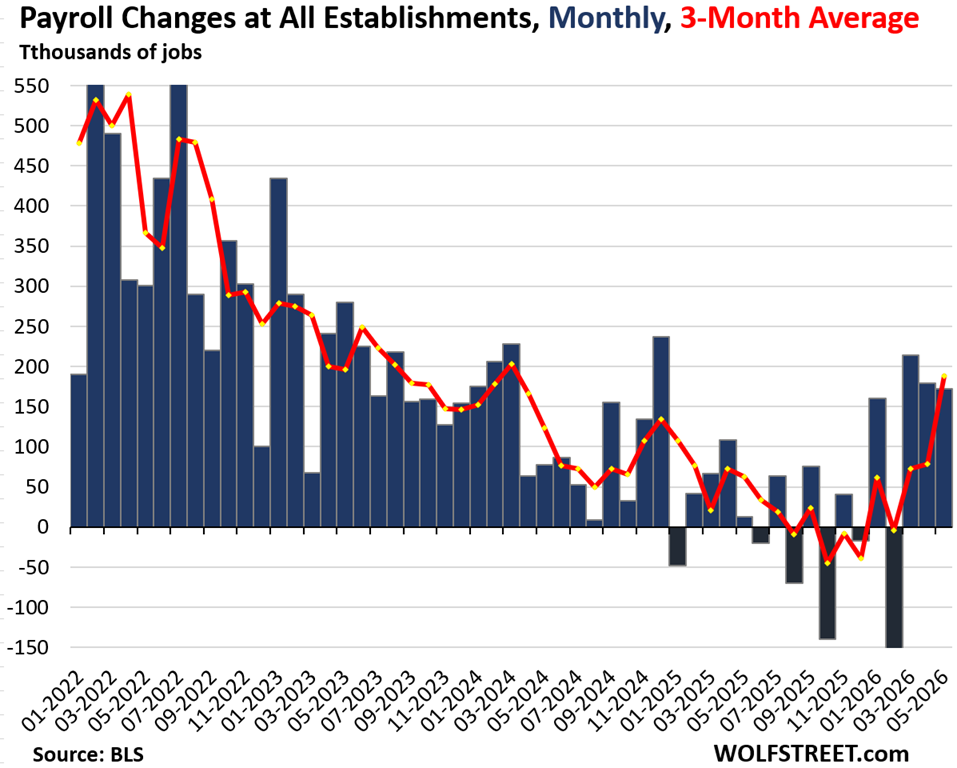
Job growth at nonfarm employers was substantial for the third month in a row, and beyond the month-to-month squiggles, the three-month average job growth, which had bottomed out late last year and has been zigzagging higher since then, jumped in May to the highest level since March 2024, decidedly breaking the years-long long downward trend.
Total payrolls at all nonfarm employers rose by 172,000 in May from April, and the prior two months were revised higher by a combined 93,000, according to the Bureau of Labor Statistics today (blue columns in the chart). The three-month average job gain rose to 188,000 in May, the highest since March 2024 (red line).
Major industries are depicted in the charts further down. Just briefly, employment at the federal government, after having plunged by 333,000 workers or by over 11% since January 2025, remained roughly unchanged in May. State governments continued to shed jobs, and since January 2025 have shed 58,000 jobs; a big part of state government employment is at universities and colleges, and they’re struggling. Local governments (mostly educators, first responders, and healthcare workers) continued to add jobs.
Immigration crackdown caps the labor force.
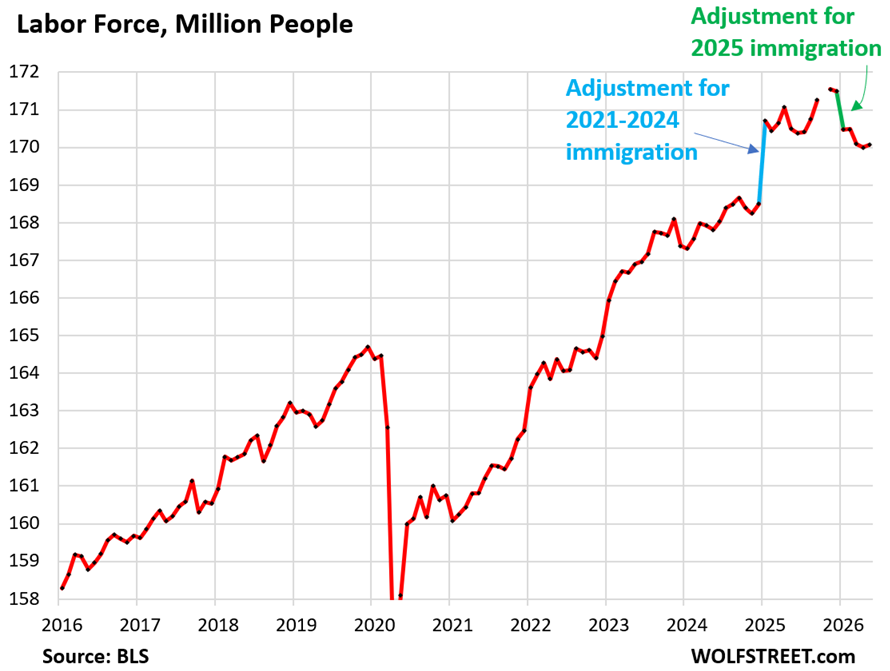
These job gains of the past three months would be nothing to write home about, under normal conditions. But the current conditions are not “normal” for the US: as a result of the crackdown on illegal immigration and the tightening up of legal work-visa immigration, the labor force has shrunk after ballooning in 2021 through 2024, and there are fewer workers in the labor market than there were in 2024.
The labor force is the supply of labor, composed of people who are working or actively looking for work. So supply of labor has been constrained, while demand for labor is growing at a moderate pace, which is keeping the unemployment rate very low.
The labor force data is based on household surveys that are adjusted annually at the beginning of the year to the Census Bureau’s revisions of the US population (the last two annual adjustments are the blue and green segments in the chart).
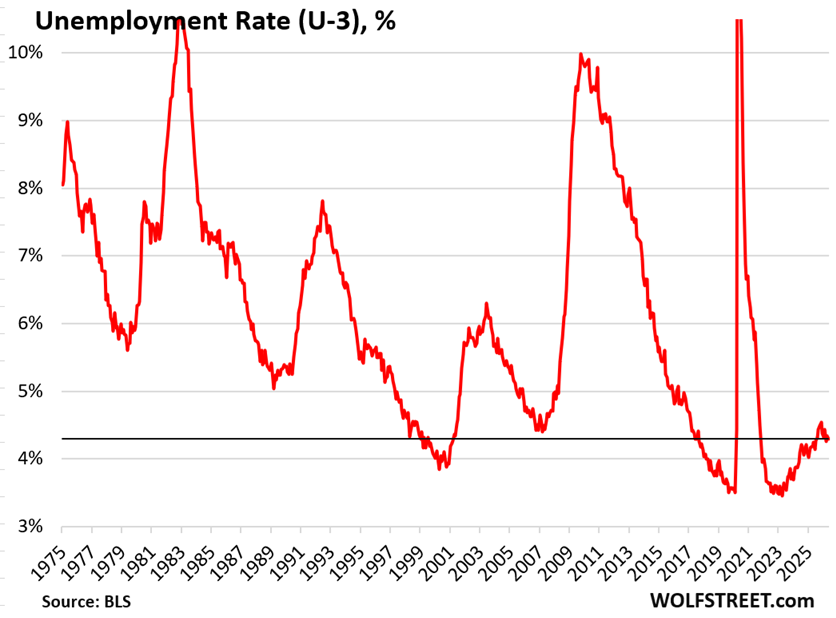
The unemployment rate inched down a hair to 4.30% in May from 4.34% in April, and has been roughly stable at this low rate for the third month in a row, and is unchanged from a year ago.
The unemployment rate reflects the number of unemployed people who are actively looking for a job (7.31 million) divided by the labor force (170.08 million).
Zooming out, this is a relatively tight labor market within the 50-year timeframe, largely because of the tight supply of labor, amid moderate job growth.
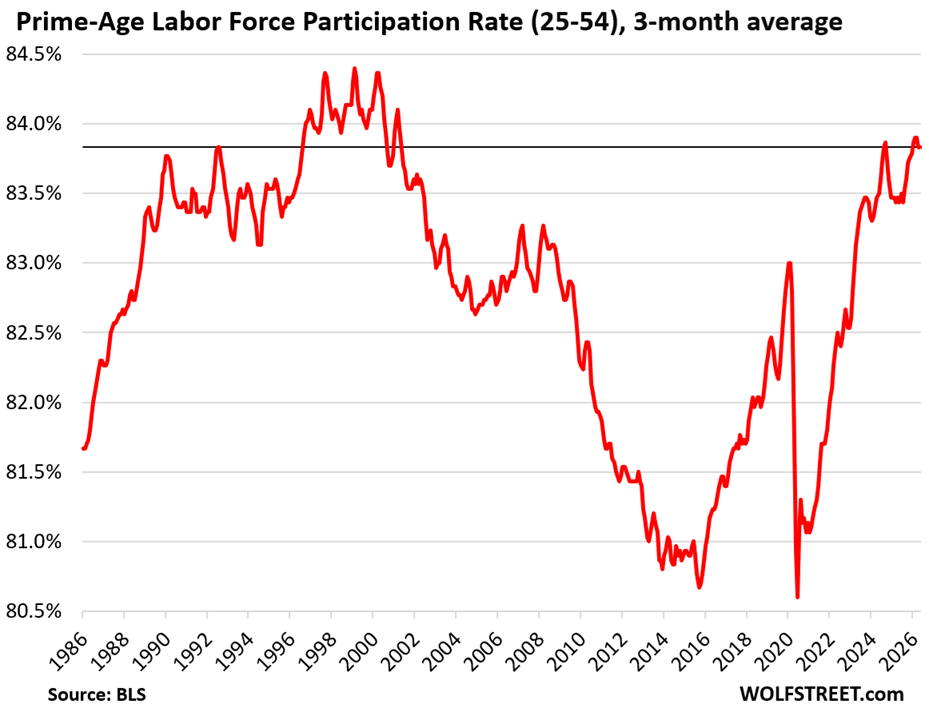
The prime-age labor force participation rate rose to 83.9% in May. The three-month average remained at 83.8%. This range has been the highest since the Dotcom Bubble in the 1990s.
This high prime-age participation rate is the result of more people getting pulled into the labor force by demand for labor amid tight supply of labor due to the crackdown on immigration and boomer retirements.
The prime-age labor force consists of people between 25 and 54 years old. It eliminates the issue of the retiring boomers. When people retire and stop looking for a job, they’re no longer “participating” in the labor force but remain in the population until they die. It’s the surge of boomer retirements over the past 15 years that has pushed down the overall labor force participation rate.
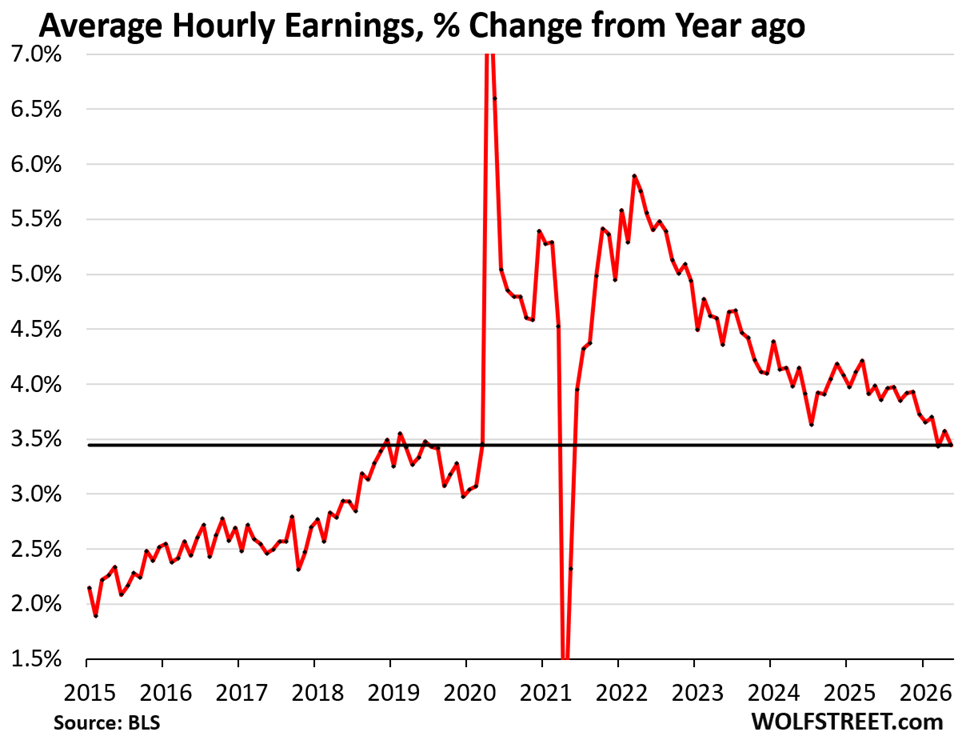
Average hourly earnings rose by 0.32% in May from April (+3.9% annualized), and by 3.45% year-over-year.
Inflation has been accelerating for months and in April reached 3.8%. The CPI for May will be released next week. So inflation now exceeds wage growth.
Employment by major industry.
The charts below zoom out and take the long view beyond the month-to-month squiggles. Employment by industry is shown in millions of employees.
The jobs in each industry are defined by work location. The surveys are sent to employer facilities. The primary activity at that facility determines the industry category (NAICS code). For example, a worker at an Amazon fulfillment center would be under “transportation and warehousing,” not “retail.”
Some industry categories are very broad, and therefore have a very large number of employees, such as “Professional and business services,” which is where many tech and AI offices are categorized, but also includes architects, lawyers, accountants, etc. Others are narrower and therefore have far fewer employees, such as “Manufacturing,” which includes only employees at manufacturing plants, but not employees at other offices, design centers, or service centers of manufacturing companies. For example, Tesla has many employees in the US that are not classified under “manufacturing” because they work in facilities where no manufacturing takes place.
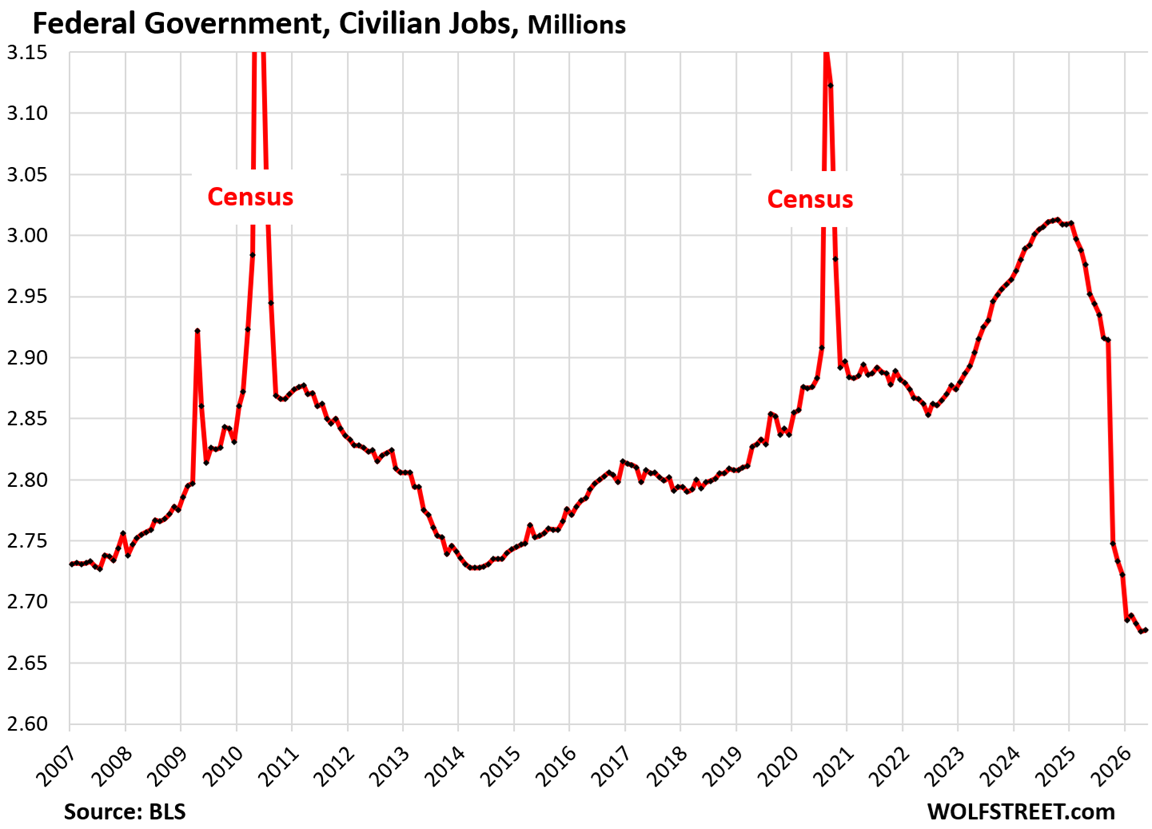
Federal government: Since January 2025, civilian employment shrank by 333,000 workers.
- Total employment: 2.68 million
- 3-month average growth: -4,000
Government payrolls don’t include workers on the payroll of government contractors; they’re in private-sector categories, such as in “Professional and business services,” and government cutbacks on contractors triggered some layoffs on those non-government categories also.
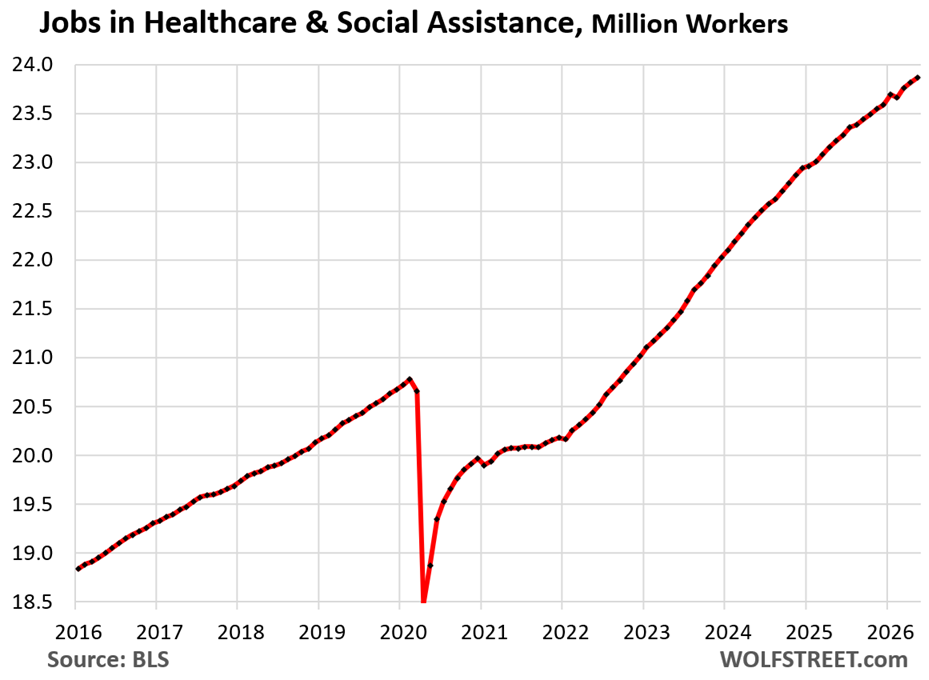
Jobs in Healthcare and social assistance:
- Total employment: 23.86 million
- 3-month average growth: +66,000
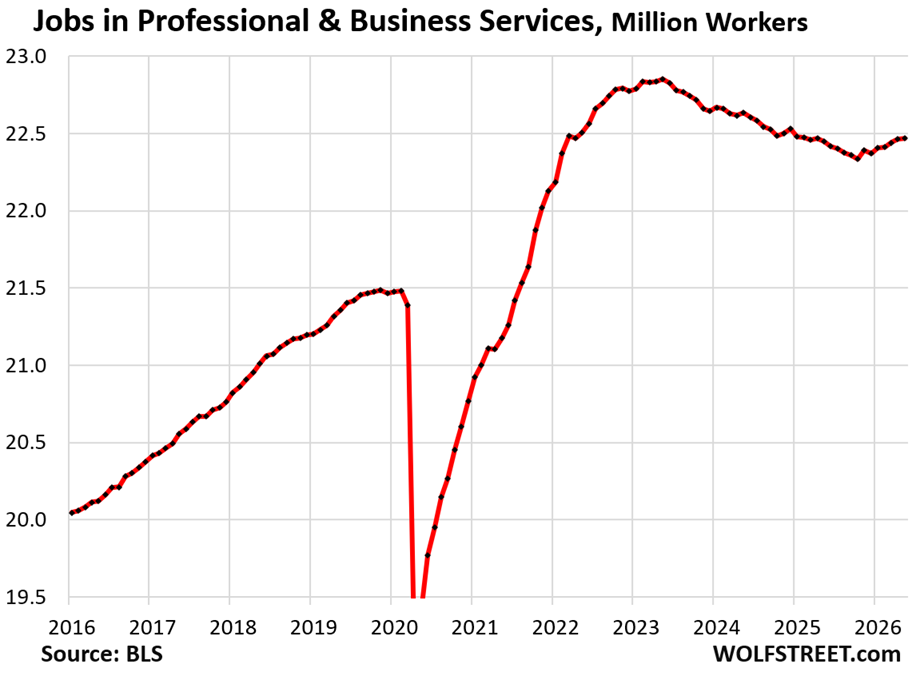
Jobs in Professional and business services: includes facilities whose employees work primarily in Professional, Scientific, and Technical Services; Management of Companies and Enterprises; Administrative and Support, and Waste Management and Remediation Services.
It includes jobs in tech and social media, which had gone on a bout of massive over-hiring during the pandemic and then shed the excess.
- Total employment: 22.47 million
- 3-month average growth: +19,000
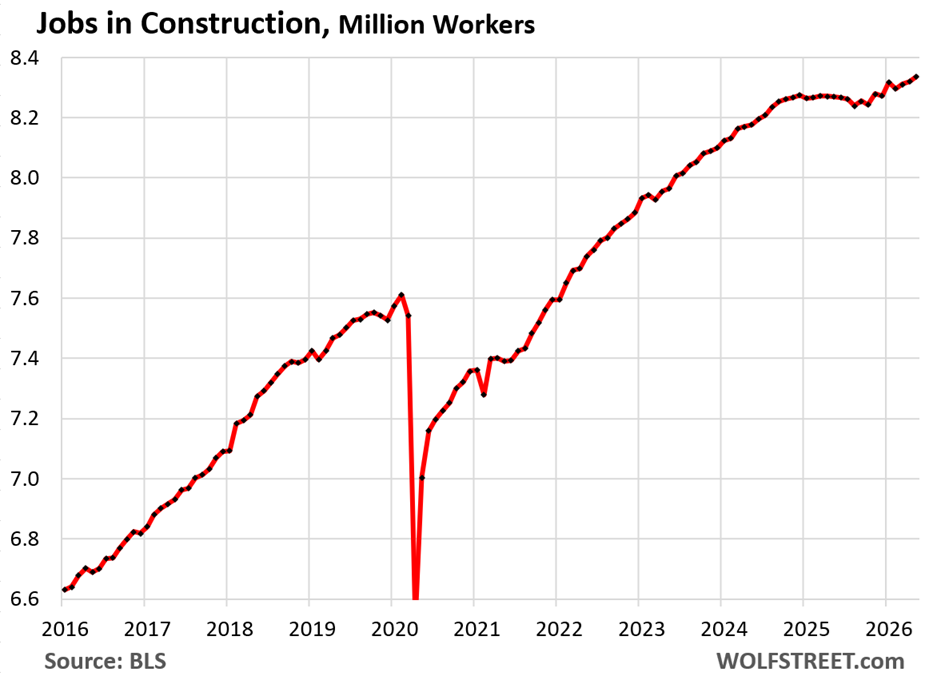
Jobs in Construction (all types, from single-family housing to highways):
- Total employment: 8.38 million
- 3-month average growth: +14,000
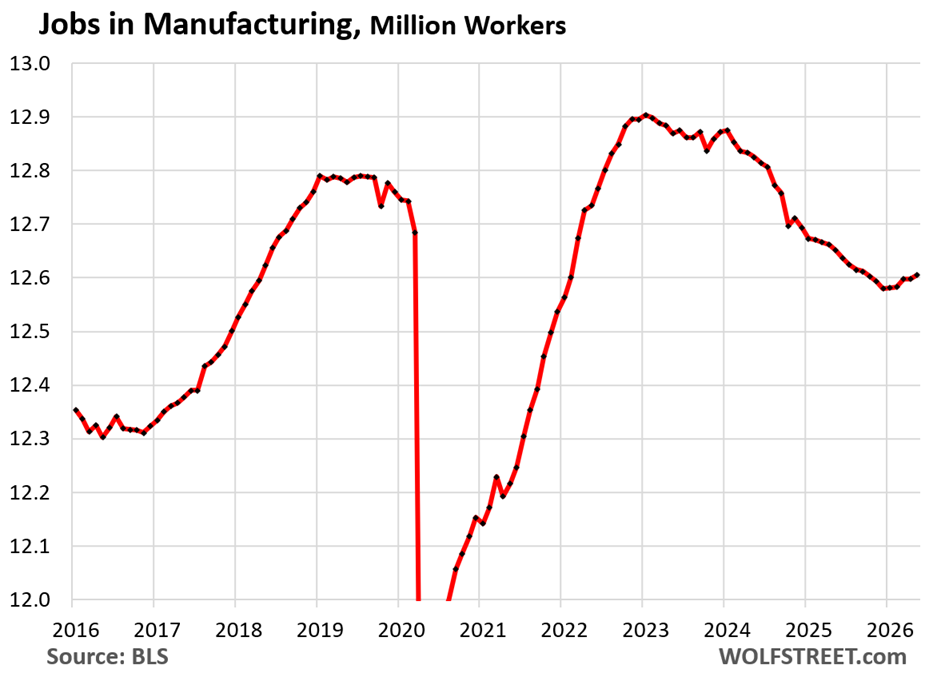
Jobs in Manufacturing: Automation powers manufacturing in the US. All new plants in the US are heavily automated, and automation at old plants is constantly improved, to reduce to costs of manual labor. Jobs at manufacturing plants today require a high skill level and include tech jobs.
- Total employment: 12.61 million
- 3-month average growth: +7,000
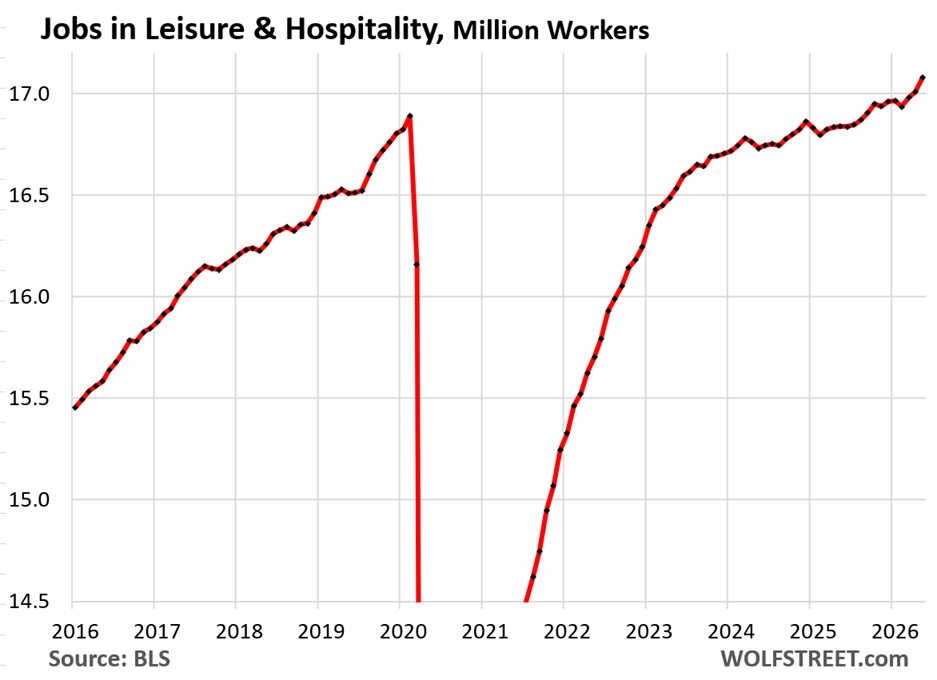
Jobs in Leisure and hospitality – restaurants, hotels, resorts, casinos (other than Wall Street), etc.:
- Total employment: 17.08 million, new record.
- 3-month average growth: +48,000
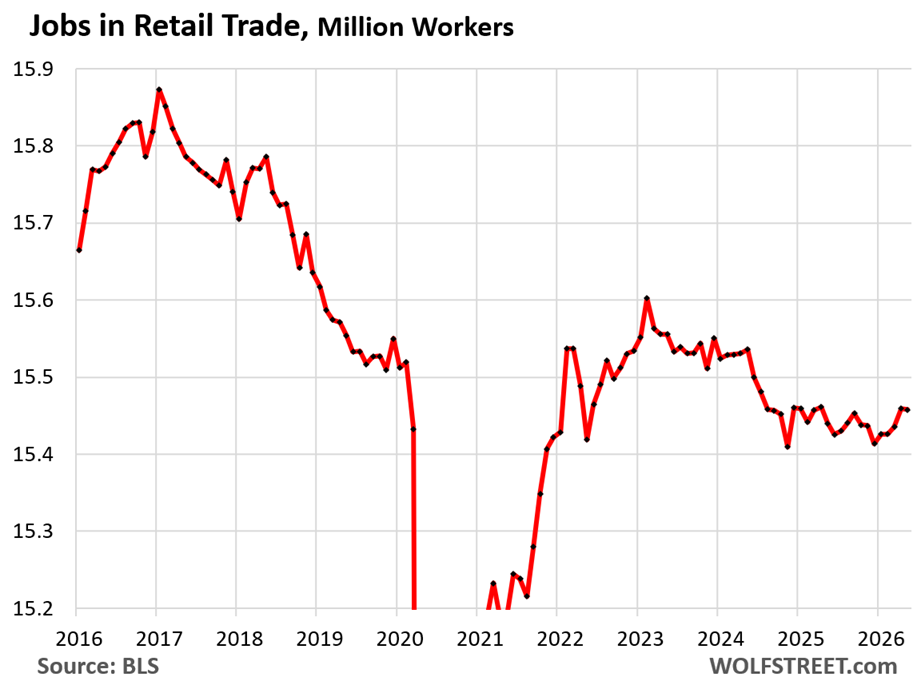
Jobs in Retail trade are at brick-and-mortar retail stores, such as malls, auto dealers, grocery stores, gas stations, etc., and other retail locations such as markets. It does not include the tech-related jobs of ecommerce operations, drivers, and warehouse employees.
A big portion of this sector has been under pressure from ecommerce, and dozens of major retailers have been liquidated in bankruptcy court, some of which we have documented since 2016 in our Brick-and-Mortar Meltdown series.
Brick-and-mortar retailers that are doing well are those that are selling groceries, motor vehicles, gasoline, and others that are not under pressure from ecommerce.
- Total employment: 15.46 million
- 3-month average growth: +11,000.
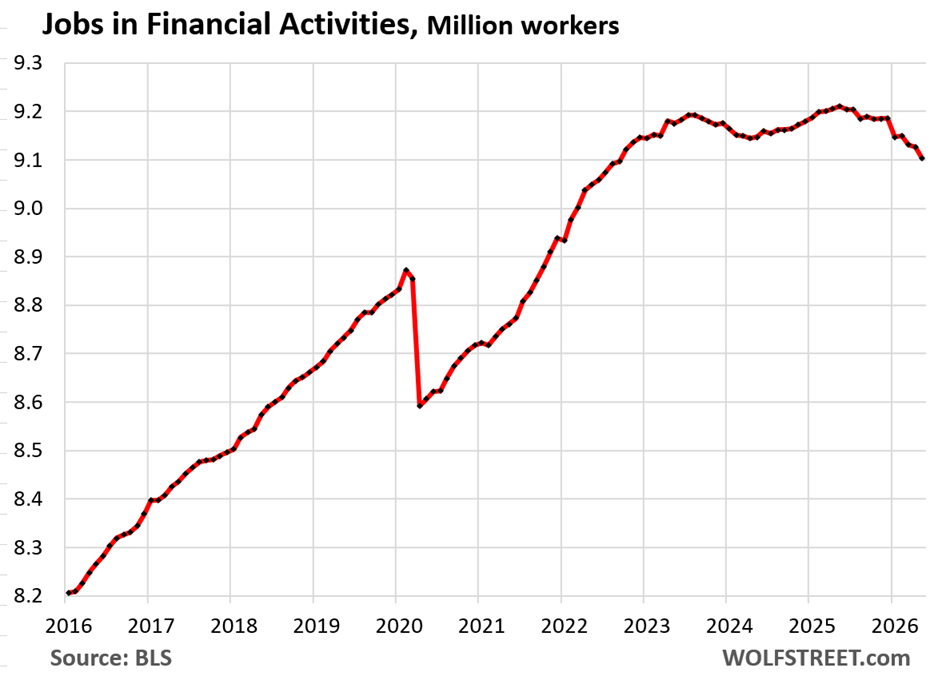
Jobs in Financial activities (finance and insurance plus real estate renting, leasing, buying, selling, and management).
- Total employment: 9.10 million
- 3-month average growth: -15,000
Jobs in Transportation and Warehousing:
- Total employment: 6.05 million
- 3-month average growth: +22,000
![]()
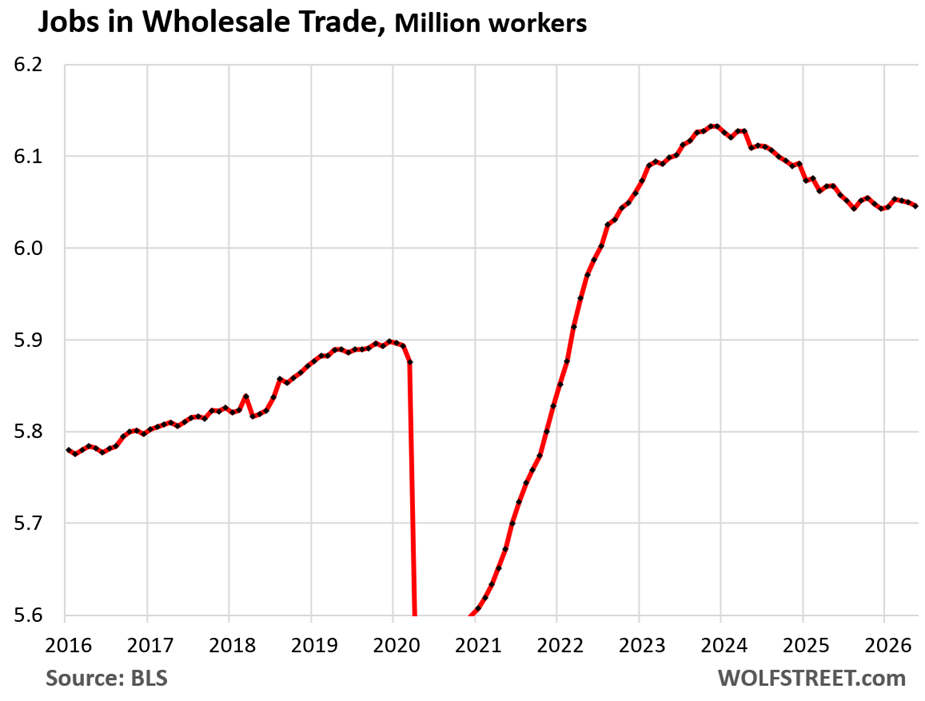
Jobs in Wholesale Trade:
- Total employment: 6.18 million.
- 3-month average growth: -2,000
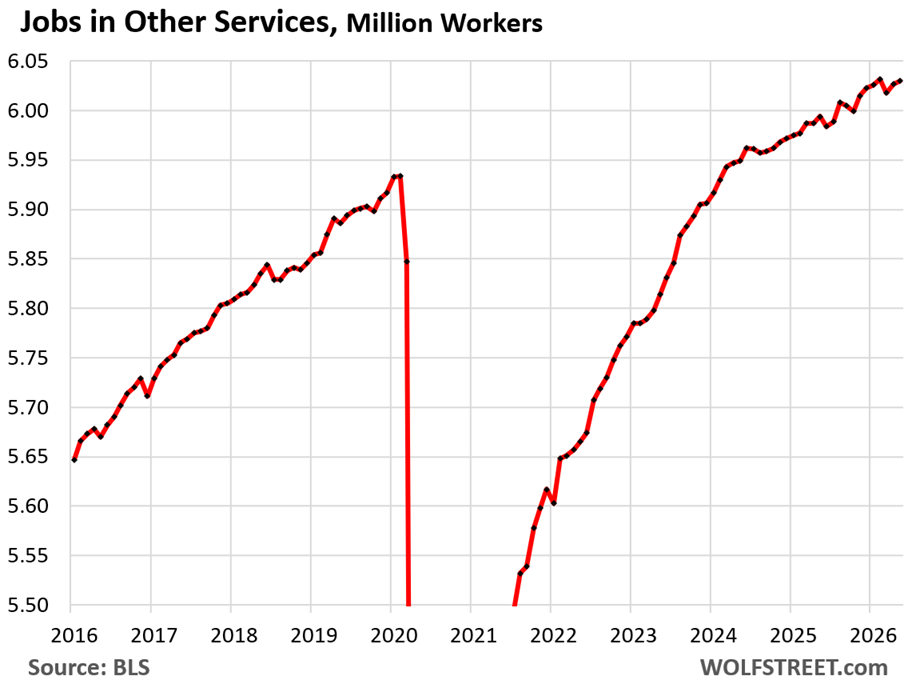
Jobs in “Other services”: includes equipment and machinery repairing, promoting or administering religious activities, grantmaking, advocacy, dry-cleaning, laundry services, personal care services, death care services, pet care services, photofinishing services, temporary parking services, and dating services.
- Total employment: 6.03 million
- 3-month average growth: -1,000
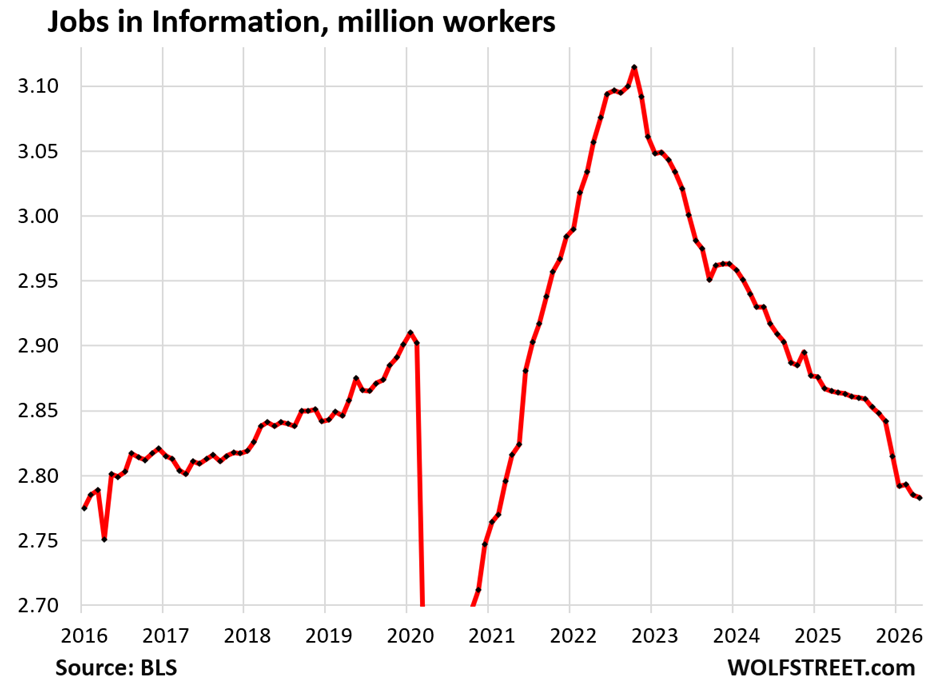
Jobs in “Information” includes facilities where people primarily work on motion picture and sound recording, broadcasting including over the Internet, telecommunications, web search portals, data processing, data transmission, information services, and software publishing.
There may also have been shifts in workers between work sites classified under “Information” to work sites classified under “Professional and business services” as many companies have offices in both segments. Information is a small category compared to Professional and business services.
- Total employment: 2.78 million
- 3-month average growth: -3,000
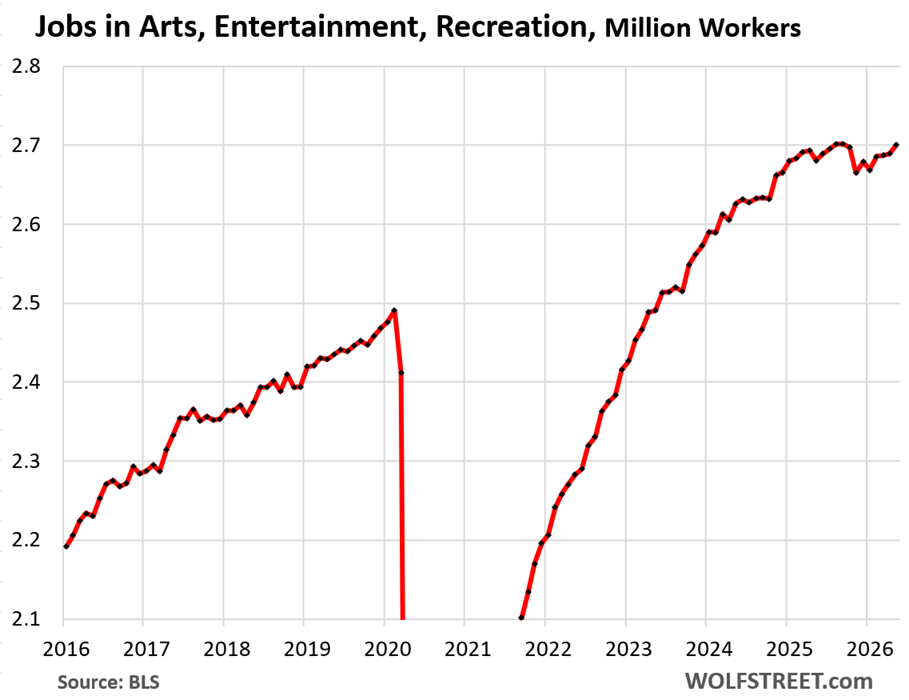
Jobs in Arts, Entertainment, and Recreation:
- Total employment: 2.70 million
- 3-month average growth: +5,000
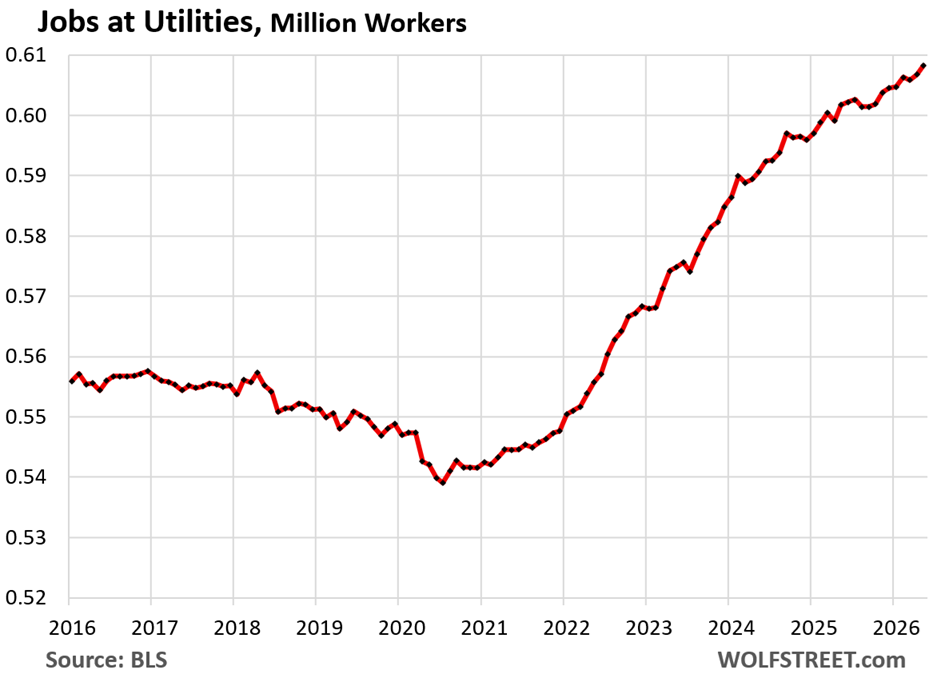
Jobs in Utilities:
- Total employment: 0.61 million
- 3-month average growth: +1,000
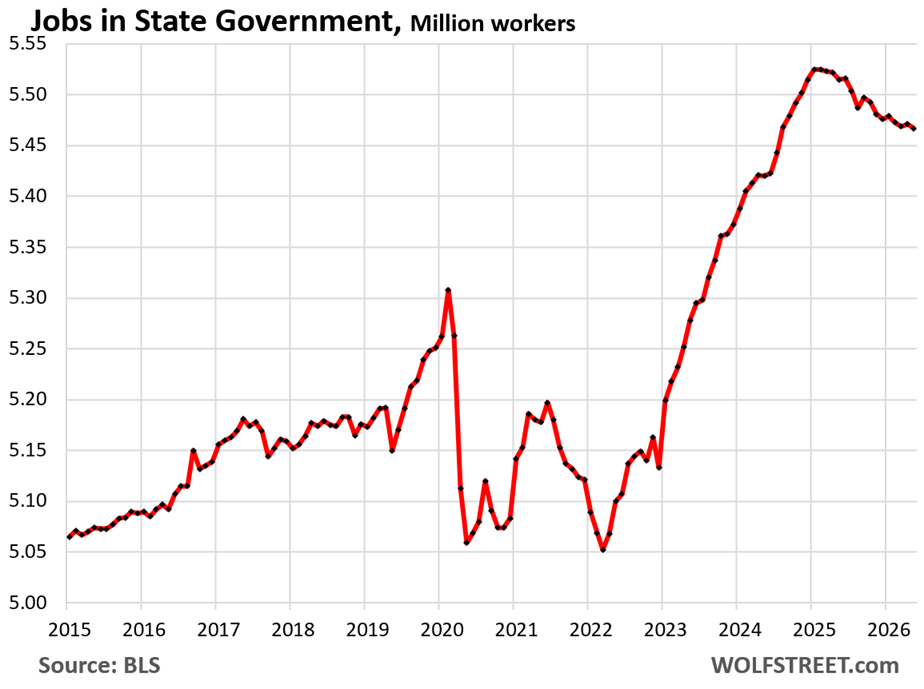
Jobs at State governments, a large portion of which are jobs a state universities and colleges, which are huge employers, but enrollment especially of foreign students, where universities get a big chunk of their tuition and fee income, has declined, and staffing has responded.
Since January 2025, state governments had shed 58,000 jobs.
- Total employment: 5.47 million
- 3-month average growth: -2,000
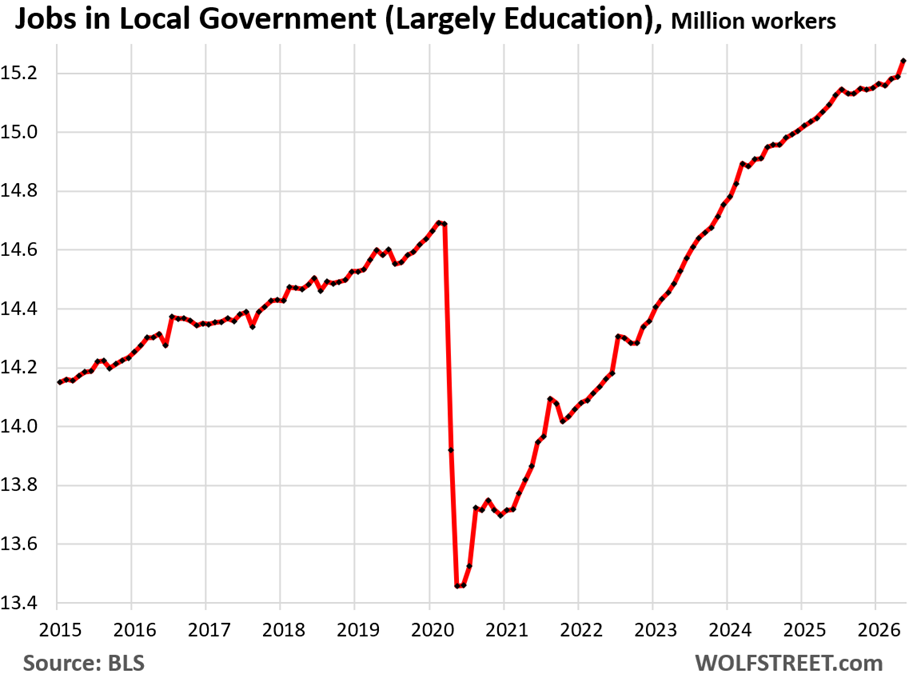
Jobs at Local governments, mostly educators, first responders, and healthcare workers.
- Total employment: 15.24 million
- 3-month average growth: +28,000
Enjoy reading WOLF STREET and want to support it? You can donate. I appreciate it immensely. Click on the mug to find out how:

![]()
And yet markets are down hard today. Oil and gold are down more than stocks. Celebration day for the perma bears.
Brad, I’m assuming this is because the markets are now pricing in a potential rate hike. With consistent numbers on the labor side of the dual mandate offset by concerning inflation on the other side, the likelihood the Fed will look through inflation seems to be waning.
They have been in denial about it but it was bound to happen with a reckless Fed and Congress re: inflation. Rate hikes are coming. Yields are too low right now for the amount of new debt they are trying to issue.
So this week I had couple maintenance issues at rentals
I have full time maintenance man, but he’s on project and I didn’t want to side track him.
Called 2 people I’ve used this year, 1st said he doubled his rates(this guy charges every minute and gas to boot)
called 2nd one – used to get him for $35 hour, now he’s wait for it
$150 hour and booked for month
needless to say – I pulled my worker for 2 days
The DOW down a little over 1%.
Other markets 2-4%
Not really the end of the world. And used to be quite normal before endless money printing.
Any self-respecting perma bull would be buying that dip, with max leverage.
almost forgot
I thought maybe the herd was rotating hard into Bitcoin. But nope.
I sold a ton this month.
Phew!
It was feeling bad with the yield curve so high and these high oil prices.
Hoping this is the big bear 9 month bonanza
S&P 500 and Nasdaq deep in the red as chip stocks suffer their worst session this year
MW: For the first time ever, the U.S. labor force isn’t growing. Here’s what you need to know about that.
Deportations are great. And my adult children are getting significant getting pay raises too.
Believe it or not, Nepalese on H1B visas are starting to take over server farms. That’s what I am hearing.
What kind of person celebrates the misfortune of others?
We need a lot more arrests/raids like we saw in South Carolina this week.
That may instill some fear on business’s who have profited on slave labor.
I wonder what Healthcare looks like on its own. Local governments ate trimming down, but if Healthcare is, then that’s a tale sign of recession. Healthcare has been recession proof for sometime.
Any connections to FIFA World Cup hirings?
🤣
@wolf – why the lol for the question about FIFA connections ? I too wondered how much of the job gains are from hospitality or such for FIFA.
Did they build 10,000 new hotels just for FIFA that need to be staffed? The US economy is gigantic, and FIFA is just a minuscule part in it. Get a grip, people.
“Jobs in Leisure and hospitality – … casinos (other than Wall Street), etc.:
Thanks! Needed that laugh today!
I got laid off from my engineering job on 4/24/2026. Me and two other engineers plus the director of engineering. Yesterday they laid of another 15 people from the facility. The industry they are in gets a lot of its business from new home construction. The company stock has dropped about 32% YTD.
Harvey – sorry to hear that.
Thanks
How long will you get severance pay? I’m asking because I want to show how these unemployment numbers here work.
While you get severance pay, you’re counted as employed because you’re still on the payroll. If you got three months severance pay, and you find a job in two months and start working in two months — receiving double pay for one month — you never counted as unemployed because you were never unemployed. If your severance runs out, and you’re still looking for a job, then you count as unemployed.
I wish you the best of luck with your career.
– I got 21 weeks of severance pay.
– I had health insurance up until May 31st, now I’m on Cobra
– I got paid for 219 hours of unused vacation time
– It’s pretty eye opening how much goes to taxes
The last time I got laid off was 1992. At that time, I went to the unemployment office and made my claim. Now it’s all done online. I’ve been on several screening interviews. All of them used Teams except for one today who used Zoom.
I did one coding test online using “Coderpad”. On Wednesday I went for an on-site interview. When I got there the hiring manager handed me a 15 page coding test. That was about 1.5 hours. When I finished the hiring manager brought in two engineers and an HR person for more interviewing questions. By time I left I had been there 2hrs 15minutes. I was happy when I was done :-)
Oh, and I’m 63. Youngest of the boomers.
Bummer man. Best wishes for a short, lucrative, successful job search.
Dude, that sux. Sorry to hear that. Where are you at – as in location?
Southern California
SOXU is down 33%. By today close the mag7 will be under $20T
DX is up !!
Meanwhile, in Canada 88,000 jobs added last month. Extrapolated by multiplying our pop by 8.7 to compare to US population numbers , this would have been 765,600 new jobs below 49 deg. 25% of these Canadian jobs are in construction even though new mega projects are still being permitted and not yet started.
This almost offsets the jobs decline felt over the 1st 4 months of this year caused by tariffs, etc.
Recent free trade agreement with India, new LNG agreement with Germany to use a new plant on the BC north coast (Nishga Territory….1st nations), a new LNG plant presently under construction at Squamish just north of Vancouver, and 4 proposed new oil pipeline routes to the west coast now under consideration. Looks like 1 new one will be built terminating on north coast and another expansion/addition to Trans Mountain. Energy infrastructure changes planned for east-west grid transmission, and a possible new oil terminal for Churchill Manitoba. Plus, a relaxation of trade tensions with China. Plus plus, new poll on Alberta separatist movement shows a freefall in interest with only 20% saying they will even vote to have a future referendum on the topic. Actual separatists number said to be 8% despite flames fanned by both US and Russia social media postings and cash donations.
Tariffs and the Iran war have produced this turnaround. That, and creditable leadership by PM Carney.
The mag7: $22.66T
1:04 PM 6/5/2026
Dow 50,866.78 -695.15 -1.35%
S&P 500 7,383.74 -200.57 -2.64%
Nasdaq 25,709.43 -1,121.53 -4.18%
VIX 21.51 +6.11 39.68%
Gold 4,346.50 -158.50 -3.52%
Oil 90.32 -2.72 -2.92%
Boom, just one day, SOXS is up 32%. See below.
andy
Jun 4, 2026 at 9:55 pm
Great article, Wolf. It will prove to be very timely.
Re: karma
Here is what someone with loads of good karma could do: wait until SOXX is down a good 12% from its top. By then, NVDA, MU, ASML, AVGO, and AMAT will all have rolled over. Then, sell a call in SOXL and buy 12-month calls in SOXS with the proceeds. This is what they call a YOLO trade.
Better yet, skip selling a SOXL call and just buy a good bunch of SOXS calls with cash—don’t do a YOLO. SOXS is like an option already—only five bucks. Then you wait six to nine months, and then sell. Then buy a Maybach with your good karma. Not financial advice—only for Gamblers Anonymous.
andy
May 30, 2026 at 7:54 pm
The best widowmaker out there is SOXS. Good thing I’m not married. Whomever times it well right before Black Tuesday. And Micron is of course in it.
Wolf:
It’s the surge of boomer retirements over the past 15 years that has pushed down the overall labor force participation rate.
Pushed up?
Pushed down the “overall” participation rate, which has dropped by a lot over the past 15 years (not shown in the article). I’m showing you the “prime-age” participation rate, which even the youngest boomers have left by now.
It’s interesting how the Jobs in Information peak lines up perfectly with when Chat GPT was released on 11/30/2022.
Interestingly irrelevant coincidence. It’s not like the day after chatgpt was released every HR person immediately understood the implications.
The other thing this “count-of-jobs” model misses is over employment in remote roles. In 2023 I had at least 3 full-time tech jobs at any one time, as did many I know, but almost everyone is back down to 1 now.
(… and healthcare workers)
Some of which pay 500k – 1mil annual.
Seems that when you’re an American you now get scratch off lotto tickets with your life. You’ll never know where they’ll show up. Many folks played the ’30 year torn to floor’ rates game. Maybe this lotto America has created here in healthcare can be called “take two 100k a month pills and call me in the morning.”
Last year’s 3 rate cuts did what they were designed to do: more jobs, higher inflation, higher asset valuations. All of which happened in the last few months as the lagged effects of rate cuts flowed through the economy.
I’ll wait for the revisions
All the recent revisions were higher. The last two revisions for March and April, mentioned in this article, were 93,000 higher combined, as I pointed out. So next month, with the next set of revisions, the data may look even stronger.
What do you think will be the long term effect of a shrinking labor force on economic growth?
The thing that really matters to Americans is economic growth per capita.
I had a good chuckle from the casino (not wall st) joke. Good work as usual Wolf, really helps put things into perspective