The Fed is “behind the curve,” and the bond market is getting very nervous. Treasury yield curve flips from a sag to a hump in the middle as 2-5 year yields spiked.
By Wolf Richter for WOLF STREET.
Longer-term Treasury yields spiked late this week as the second wave of inflation took on more substance with back-to-back inflation reports: CPI inflation soared by 3.8% year-over-year, driven by core services, gasoline, electricity, and food; and the measure that tracks inflation in prices companies pay each other, the Producer Price Index soared by 6.0% year-over-year as the services PPI blew out. Inflation in services is the biggie. Services account for over 60% of the economy, and inflation took off in services.
The 30-year Treasury bond sold at the auction on Wednesday at a yield of 5.046%. In the secondary market, the 30-year bond has traded over 5% from time to time in recent years, but this was the first time since 2007 that the 30-year bond actually sold at auction with a yield above 5%. And in the secondary market, the yield rose following the auction and ended on Friday at 5.12%, the highest since June 2007, having edged past the October 2023 high.
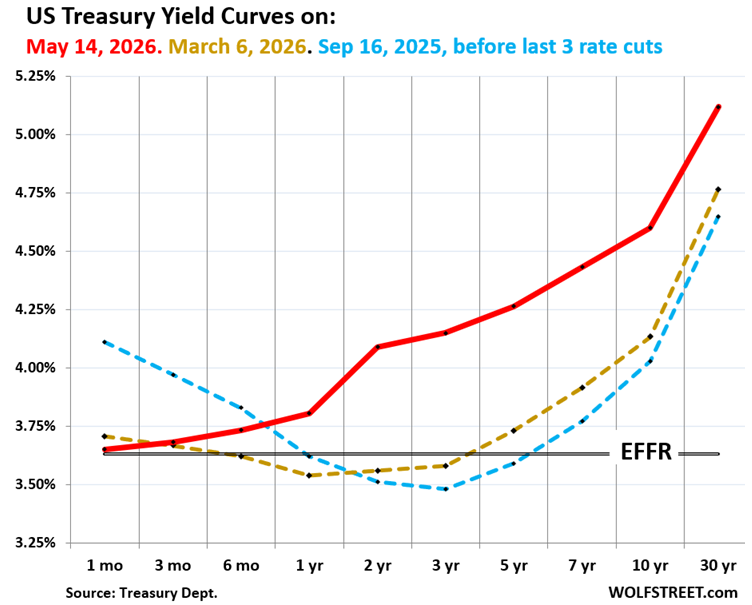
The long end of the Treasury market completely blew off the Fed’s rate cuts, as indicated by the widening gap, now 149 basis points, between the 30-year yield (5.12%) and the Effective Federal Funds Rate (EFFR, blue line) of 3.63%, which the Fed targets with its policy rates.
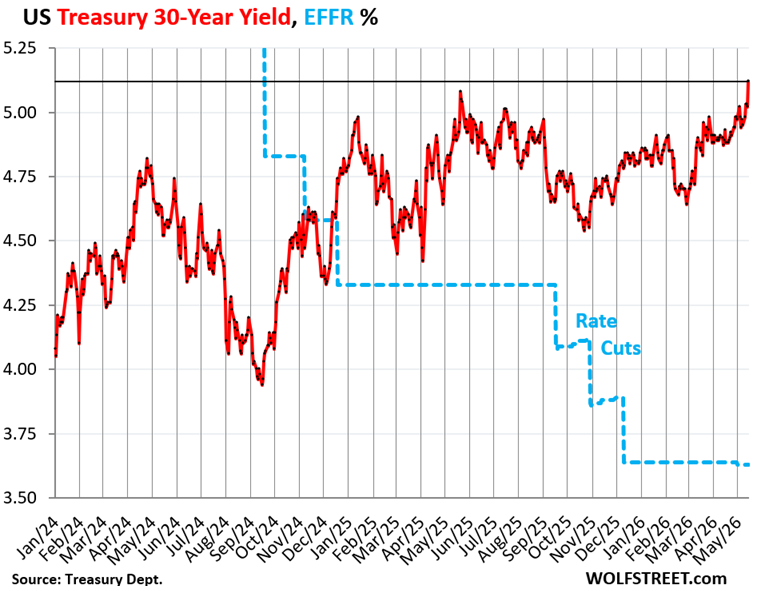
Higher bond yields in the market mean lower bond prices for existing holders.
The bond market is now fretting about a lax Fed that would “look through” the surge of this second wave of inflation for too long and, instead of getting serious about it, would proffer more excuses why no rate hikes were needed at this point. And the bond market is cutting the market price of those securities, which causes yields to rise.
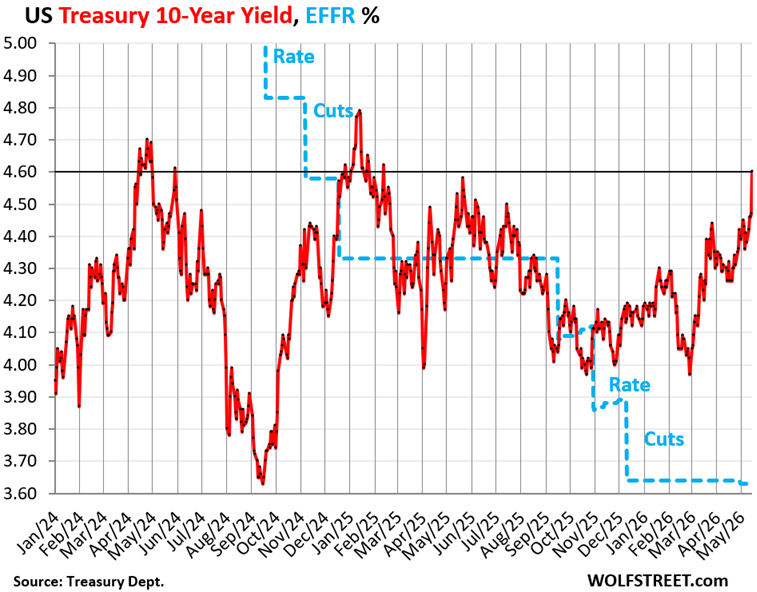
The 10-year Treasury note sold at the auction on Tuesday at a yield of 4.468%. The yield then continued to rise in the secondary market, including by 11 basis points on Friday, to 4.60%, the highest since January 2025.
Longer-term yields reflect the bond market’s views of the future – especially the path of inflation as the second wave takes shape, amid the tsunami of supply of Treasuries to fund the ballooning deficits.
The amount of 10-year Treasury notes outstanding rose by $24 billion this week: The $52 billion of 10-year notes sold at the auction on Tuesday at 4.468% replaced $28 billion in 10-year notes sold at auction in May 2016 at 1.710%, that matured today. So with this week’s auction, the total amount of 10-year notes outstanding rose by $24 billion.
New issues being so much larger than the issues they replace is one of the dynamics by which the total pile of Treasury notes (2 year to 10 year) and Treasury bonds (20 year and 30 year) increases constantly even as the Treasury Department says that it is not further increasing the auction sizes.
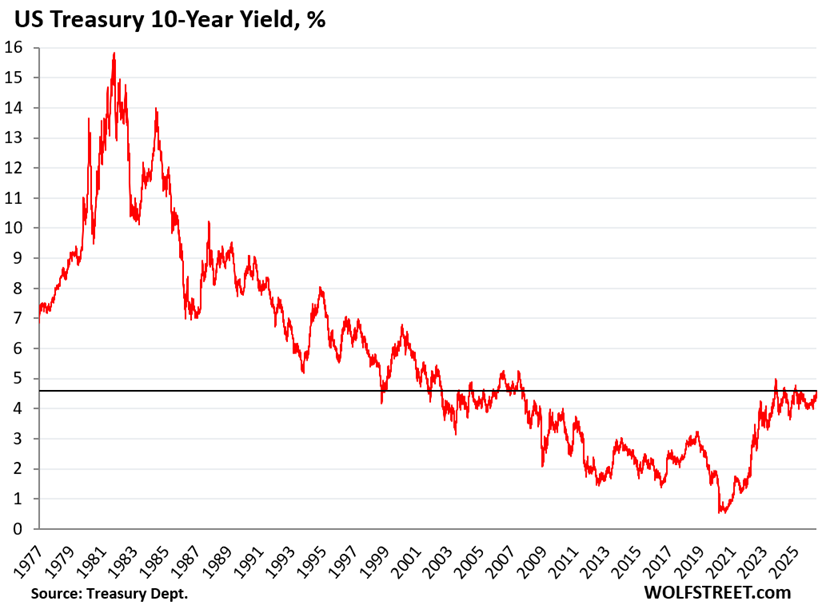
The 40-year bond bull market died in mid-2020, when the 10-year yield bottomed out at 0.5% amid the Fed’s massive interest-rate repression. Since then, as inflation forced the Fed’s hands, it has been a rough ride back to normalcy.
A 10-year yield of 4.6% in a historical context is still relatively low. At this yield, with this potential path of inflation, and with this Fed that wants to sit on its hands to let it happen, 10-year paper looks very unappetizing to this observer, and 30-year paper looks even worse.
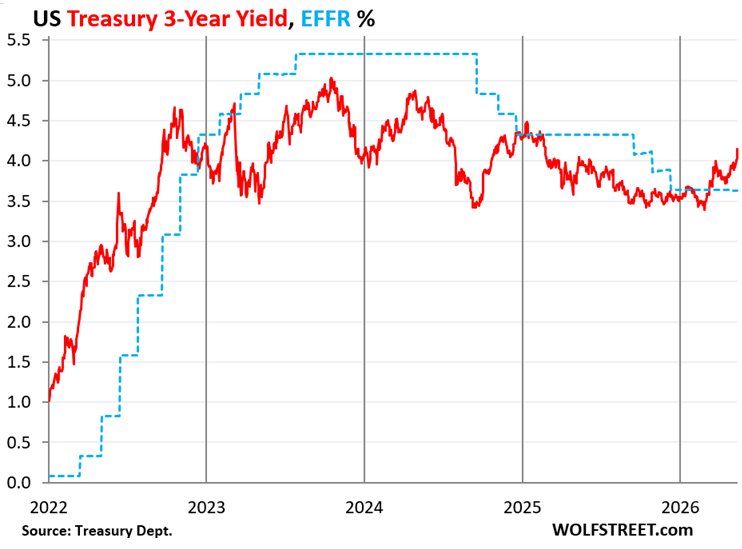
The 3-year Treasury note sold at auction on Monday at a yield of 3.965%. Then the yield spiked, amid the CPI and PPI inflation reports that followed the auction, including by 11 basis points on Friday, and ended at 4.15%.
In the four trading days since the auction, the 3-year yield has shot up by about 20 basis points from the auction yield. This is not fun for the buyers at the auction, and is a sign that the Treasury market is adding to the expectations of multiple rate hikes by the Fed, if not later this year, then next year.
The 3-year yield shows the U-turn in expectations in the market, having spiked by 76 basis points since February 27. The 3-year yield had anticipated the top of the rate hikes and then the rate cuts, and now by having blown through the EFFR is anticipating rate hikes.
Combined, the government sold $155 billion in notes and bonds this week, and all of them dropped in price since their auctions, as yields rose sharply:
| Notes & Bonds | Auction date | Billion $ | Auction yield |
| Notes 3-year | May-11 | 72 | 3.965% |
| Notes 10-year | May-12 | 52 | 4.468% |
| Bonds 30-year | May-13 | 31 | 5.046% |
| Notes & bonds | 155 |
The US government also sold $536 billion of Treasury bills this week, in six auctions, with maturities from 4 weeks to 26 weeks, most of them to replace maturing T-bills.
T-bills and Treasury notes and bonds combined, the government sold in total $691 billion of securities this week.
| Type | Auction date | Billion $ | High Rate | Investment Rate |
| Bills 4-week | May-14 | 104 | 3.605% | 3.665% |
| Bills 6-week | May-12 | 85 | 3.615% | 3.681% |
| Bills 8-week | May-14 | 99 | 3.610% | 3.681% |
| Bills 13-week | May-11 | 95 | 3.610% | 3.694% |
| Bills 17-week | May-13 | 72 | 3.615% | 3.710% |
| Bills 26-week | May-11 | 82 | 3.615% | 3.733% |
| Bills | 536 |
“High rate” v. “Investment Rate”: The Treasury Department provides two different calculations of the yield at which T-bills were sold at auction: the “high rate” and the “investment rate.”
T-bills are sold at a discount to face value, and at maturity, the holder gets paid face value; the difference is the interest, and there are no coupon interest payments. The “high rate” reflects the yield calculation of that process. To make this discount yield comparable to the yields of coupon securities (2 years to 30 years), the Treasury department re-calculates it as “investment rate.”
The investment rate is higher than the “high rate.” And around the time of the auction, the “investment rate” is close to the “constant maturity yield” published by market index providers to reflect trades in the secondary market.
Inflation has surpassed T-bill yields. Yields of 1 year and less are bracketed by the Fed’s policy rates and expectations of those policy rates over the next few months. The yields of the T-bills sold at auction this week were all below the rate of inflation.
With negative “real” yields, T-bills have become unattractive.
But the 10-year Treasury note with a yield of only 80 basis points above current inflation rates may be even more unattractive because 10 years is a lot of time for a lax Fed to allow inflation to wipe out much of the purchasing power of the principal, while the yield is insufficient to compensate holders for that loss of purchasing power and for other risks. Not with a ten-foot pole at those yields, I’d say.
Treasury yield curve: sag in the middle turns into hump.
The chart below shows the yield curve of Treasury yields across the maturity spectrum, from 1 month to 30 years, on three key dates in 2025 and 2026:
- Red: Friday, May 15, 2026.
- Gold: March 6, 2026.
- Blue: September 16, 2025, before the Fed’s last three rate cuts in 2025.
The yield of every maturity has been above the EFFR since mid-March, with the gap dramatically widening for yields of 2 years and longer.
The former sag in the middle – with 1-year through 5-year yields lower than short-term yields – has turned into a hump in the middle, after the yields from 2 years through 5 years spiked.
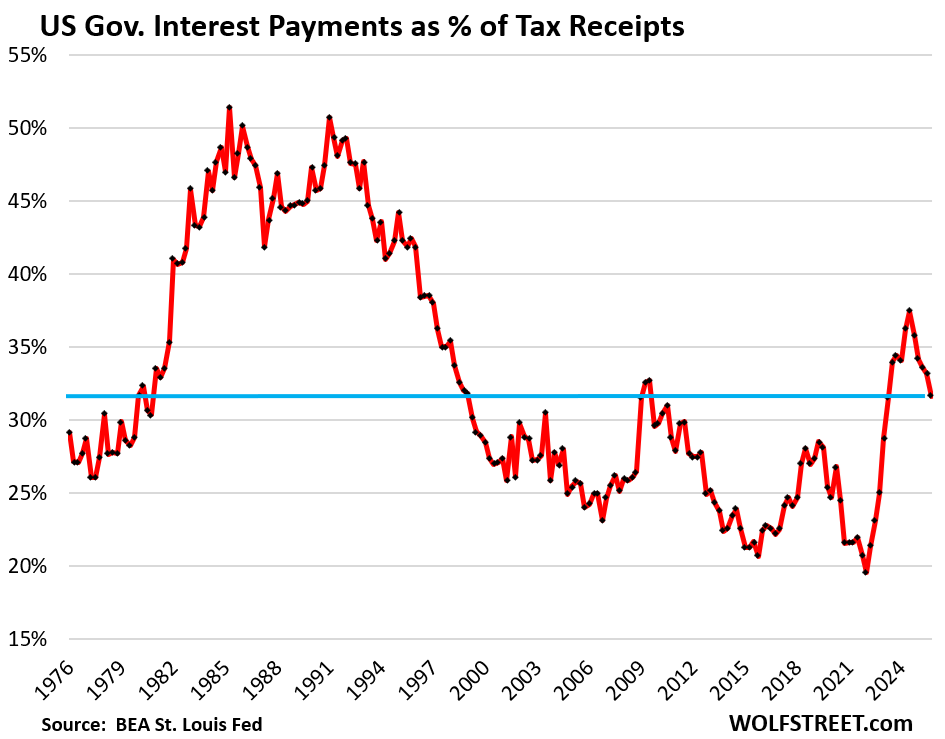
Letting inflation and the economy “run hot” may be the only way of dealing with the ballooning federal debt – that is on an “unsustainable path,” as Powell likes to say – as the hopelessly Drunken Sailors in Washington refuse to do anything other than piling even more debt upon it.
Higher inflation, such as in the 3% to 5% range, and higher nominal economic growth result in higher tax receipts, which make the interest payments easier to deal with, and we already see some of those effects, such as in the portion of tax receipts that get eaten up by interest payments:
Years of higher inflation and higher nominal economic growth also reduce the burden of the existing securities when they mature because they get paid off with devalued dollars.
But for existing bond holders, this inflation would add to their nightmares. And potential bond buyers, facing these treacherous times, would then recalculate their inflation projections and adjust at what yields they would be interested in buying, and those yields would be higher still.
Enjoy reading WOLF STREET and want to support it? You can donate. I appreciate it immensely. Click on the mug to find out how:

![]()
A little “Volcker Shock” and a “Saturday Night Massacre” coming?
When does Warsh start? His confirmation is done, right?
A 10-year yield of 4.6% in a historical context is still relatively low. At this yield, with this potential path o
of inflation seems low. One would logically guess that the ten year should be at 5.45 at least,
Warsh is no Volcker. No need for massacres.
Our Reluctant Fed prefers to let the market do its dirty work. Expect a rerun of the 2022 playbook: Fed only raises rates after the market prices them in.
For the Fed, the advantages of going slow are:
(a) Warsh gets time to take the reins gently,
(b) the Fed avoids accusations of skewing the fall elections,
(c) a bit of run-hot inflation helps with the national debt crisis,
(d) rising “market” rates still put pressure on Congress to reduce deficit.
A “path of least political resistance” for the Fed: at next meeting (6/17( signal that next move could be upward, then at 7/29 meeting do something hawkish but short of raising rates, and only raise rates on 9/16 – too late to meaningfully impact the economy before the election, but not an “October surprise”. Then wait until after the election to see how markets react. After that, the moves could be larger.
Very convincing forecast.
This is the Way
Well we can whistle past the graveyard all we like
I think that the bell at the top has been rung
FED is way behind the curve and is injecting liquidity from Dec 2025. We CAN NOT call it QE but this whole Reserve management is BS. If Banks want money borrow it from Discount window or use the SRF. That’s how needs to be. Thats how it was.
Latest Balance sheet shows FED balance sheet has now grown to 6.73T. FED has undone all its QT between April 2025-Dec 2025. So we are back to April 2025 level. Why wont we have ATH in All Stock indices?
Trump’s bogus charges and criticism distracted us from actual issues; Powell led FED’s poor performance in it mandate. Powell got lot of sympathy because Trump’s attacks.
I really hope Warsh takes the charge and starts balance sheet reduction quickly. Stop rollover of MBS into Treasury securities immediately. Sell those MBS.
Lets see if he really can Talk the Talk and Walk The Walk.
The Fed has already reduced the amount of the RMPs starting in mid-April. And as of the announcement yesterday, it further reduces them for the next four weeks. The RMPs were a way to deal with the liquidity drain that the TGA (government checking account at the Fed) poses for the markets around Tax Day. The Treasury Dept is now discussing investing the TGA’s excess cash in the repo market, instead of keeping it at the Fed, which would solve that liquidity drain around Tax Days.
Thanks Wolf. Always appreciate your articles and comments.
Treasury investing the TGA’s excess cash in the repo market wold be smart/strategic move. On peak tax days, TGA hit 1.05T. So Treasury can invest that and make money. FED can stay away from managing liquidity drain. It would be more of market driven solution.
I understand FED’s reasoning for RMPs. But FED is always taking easy route. It could have forced banks to use SRF. If FED doesn’t use those mechanisms, then whats point of having them.
In longer time horizon, balance sheet uptick with RMPs look small. But FED also slowed down QT to minuscule amounts after May 2025. So Balance sheet did go back to April 2025 level. Is that correct or am I missing it?
I am sure if FED wraps up RMPs in next 4 weeks, Balance sheet would go back to Dec 2025 levels quickly.
Also its been 2 years after Logan talked about possibility of selling MBS. Any concrete news on that?
Right now, the Fed is in a complicated transition period and nothing will change until Warsh settles in. Logan and a few others that wanted a smaller balance sheet, or would have gone along with a smaller balance sheet, were bulldozed away last year by Powell, Barr, et al. who were worried about the looks of running up the SRF during Tax Day, and they were worried about the looks of the EFFR fluctuating a little for a few days, and they wanted RMPs to prevent that. She hasn’t said anything about the balance sheet since then. If Warsh wants a smaller balance sheet, he’s going to have some support. Whether he can build a voting majority for it, and how lang that would take, remains to be seen.
It sounds to me like Warsh and Bessent are on the same page about excess cash in the TGA needing to go into the repo market instead of sitting at the Fed. That’s a solution to lots of problems, and I’m surprised no one mentioned it before. And it would shrink the balance sheet by quite a bit.
but in end the exponential debt will have to implode
and we’ll be(99%) ones paying for it
with massive amounts of worthless fiat $dollars
and the 1% will just keep hoovering it up
“The Treasury Dept is now discussing investing the TGA’s excess cash in the repo market, instead of keeping it at the Fed….”
Won’t that create small counterparty risks in a place where there was essentially zero before? And in a place where we really don’t want any?
I hadn’t stumbled into reports of these discussions yet. I’m trying to wrap my head around this: So Treasury manufactures things (T-bills, -bonds, and -notes), sells them at auction for “cash”, puts the “cash” into the TGA, and then loans out that “cash” collateralize-d by the very things it manufactured?
I get that the market for Treasuries is deep and wide but in the private sphere wouldn’t we call that “vendor financing” with raised eyebrow? Like, a company builds a widget then sells the widget to a customer but doesn’t get cash, just a promise to pay cash in the future. And if the cash doesn’t show up for whatever reason then the company repossesses the widget and is stuck with the widget. Sure, they can try to sell the widget again but now they’re competing against themselves at the same time they’re trying to manufacture and sell new widgets. The machine works fine during low stress periods but breaks down during high stress periods when there are a lot of customers just sending back their widgets instead of cash at the same time, leaving the company with an empty checking account until they can sell all the old widgets they got back AND the new widgets still rolling off the assembly line. Widget prices drop a lot as the market sniffs out the overabundance of widgets.
Do we we really want Treasury to carry the risk of an unexpectedly empty checking account for even a short period of time? Seems like we get a preview of what that would look like every time there’s a thumb war over increasing the debt ceiling.
RHA – I totally agree with your cautionary observation. In a low pressure environment the solution is simple and tidy. Elegant, really. In a high pressure or crisis environment you have the possibility of the UST holding the RPA when it needs the cash. Or heaven forbids, sells the RPA into a collapsing market because it really needs the cash. I know they are looking for cooperative opportunities between Treasury and Fed, but this ain’t it.
You’re making up stuff. Nothing works the way you describe it.
Wolf:
It makes a person wonder how people come up with some of this stuff.
You are explaining complicated stuff as you see it in the data….
And for some reason some commenters feel obligated to try and be arm chair economists, CEO’s, the Fed, and for some reason like to make outlandish predictions.
I suppose it is easy for them to do by just spending a few seconds and typing a couple of letters on the web while sitting on their couch.
Haha
This is an excellent rate update and not to be fluffy about it. Thnx for the long term chart. Some here seen ignorant of that 40 year bull in bonds. Once that down channel broke then the writing was on the wall because the fundamentals are broken(bond holders not being compensated correctly), as you have explained in detail.
As Daniel told Belshazzar : “You are weighed in the balance and found wanting.”
This is what bond holders are saying to the Fed.
This implies the fed considers its SRF incapable of providing stable liquidity, so its instead implementing QE-by-another-name.
Somehow banks that managed tax season drawdowns just fine for decades are struggling and need the fed to buy up a lot of t-bills for 4 months a year.
The other 8 months of the year, those banks are … Less struggling? Apparently they need the fed to be buying up only about half as many t-bills during the off season.
Grant
No, before the financial crisis, the federal government had its checking accounts at commercial banks, and the biggest one at JPM. So the cash in the government’s checking accounts remained in the banking system, and when taxpayers paid $300 billion on April 15, that $300 billion stayed in the banking system, but just flowed from bank to bank.
During the Financial Crisis, the TGA was moved from commercial banks (which were on the verge of collapse) to the NY Fed, which cannot collapse. And with that emergency move, the unintended consequence was that the cash in the TGA was taken out of the banking system. So when the TGA has $1 trillion in it, that $1 trillion is not in the banking system, but it used to be in the banking system before the financial crisis.
The issue is not the amount, but the massive movements on Tax Days (four per year), where hundreds of billions of dollars can leave the banking system in a day or two and get sucked up by the Fed. This is a gigantic sucking sound of cash. If the government invests the excess cash in the repo market, it’s returning the cash to the financial system and earning interest on it, and there won’t be any liquidity drain on tax days.
Moving the cash to the repo market would kind of reconstitute the system they had before the Financial Crisis.
Agree. Need to bring back QT badly to deflate the huge stock market bubble, which is completely out of control, seen in the 500%-1000% stock gain in semiconductor and memory stocks in just one month.
No can do
need to keep printing worthless fiat $dollars
it’s like asking grifters in CONgress to stop spending
I have long proposed that the obese Fed balance sheet was the source of the endless bid propelling the stock market into valuations that really can’t be rationally justified
But then again neither can be love the most powerful
Here we go, as we have read with caution for years. It will be interesting to see how long the equity euphoria continues.
Well, since AI is going to be a deflationary “sure thing” (after the initial inflationary thingy), I guess everyone should load up on 30 year 5% Treasury securities and sit back and watch prices fall as your dollar gains purchasing power.
Who has ever seen deflation?
The FED sees it everywhere.
It has been valiantly fighting it for 50 years.
March – October 2009
There is deflation and inflation going on all the time, depending on what sector or product you’re examining. Prices drop on lots of things. In Japan, there was a lot of deflation in real estate and stocks for years. But if your talking about persistent deflation that goes on for years ….. we haven’t seen that since the 1930s.
If the Treasury market believed inflation were about to rage higher, the yield curve would be steeper in the 1-3 year range.
Per the graph above, the Treasury market is currently only pricing in one 0.25% rate hike in the next year, and another the year after that.
That could reflect a bond market in denial, lagging pathetically behind the rising inflation curve – a rerun of what already happened in fall of 2021.
Or the bond market could be right … it’s also forecasting a massive inflation-crushing event sometime in the next few years.
The inflation breakeven analysis (from the Treasury and TIPS yield curves) shows expected “5-year average” inflation is currently only 2.7%. That is below the current inflation rate!
The expected inflation drops even lower for longer timeframes; average inflation is only supposed to be 2.2% over the next 30 years.
For the 5-year inflation average to actually be 2.7%, inflation has to fall pretty soon and pretty hard. A “run-hot” scenario would not bring the average inflation rate back below 3% over 5 years.
Disclosures: My book is partly hedged against a run-hot scenario. I have 3% positions in both VTIP (0-2 year TIPS ETF) and LTPZ (long-term TIPS ETF) in a tax-deferred account. I’m not convinced that the trigger point for a 2022-style bond-market plunge has arrived just yet. But I agree the Treasury market is lagging inflation once again, just as it did in 2021-2022, and the Fed is lagging as well.
So where to invest at this point when everything overvalued and t-bills paying less than inflation rate?
Index funds, yes I’m serious
Yes, invest in QQQ and SPY right as they are going to IPO Spacex (whom actually loses money) at 2 trillion dollars and force it in to these ETFs at the peak of the AI bubble while inflation is running rampant and they will be forced to raise rates. Sounds like a absolutely great idea.
LA Renter
Indeed, my question as well. And gold seems a little wobbly and higher rates are not good for gold, or stocks.
So with the Fed “behind the curve”, slow to raise but always quick to cut…what to do?
Markets create wealth…but also destroy wealth.
There are actually still ……talking heads on financial networks calling for cuts this year. Mind boggling.
Take those auction results and use them as a hinge……10 yr 4.46 and 30 yr 5.04….as long as those purchasers are under water, the bond market is in trouble.
Now, add in more treasury auctions and huge IPOs coming.
Things are fragile. (and of course there are the geo political concerns)
Howdy LA Renter. CASH is King. YOU will control your future then.
Howdy Bubba!
I have a lot of pennies. Some are rolled up, and others are just loose in plastic bags. With the penny being discontinued, what is your advice as to what I should do with them. I also have other coins such as nickels, dimes and quarters. I always appreciate your insightful financial tips and outlook. Thanks, from one autist to another. We are all truly kinds in control of our future.
Go ask Warren Buffett.
Google this article
“We May Soon Find Out Why Warren Buffett and Berkshire Hathaway Have Almost $400 Billion in Cash”
Warren Buffet recommends a S&P 500 index fund. Says on average it outperforms all else.
Even at these current valuations? The Buffett Indicator (Market Cap to GDP) is at 231.4%. Not great for the value investor.
Google this article
“We May Soon Find Out Why Warren Buffett and Berkshire Hathaway Have Almost $400 Billion in Cash”
VT. You can’t beat the market consistently, even if you know it’s overvalued.
I wouldn’t touch government debt if you’re still working
On the contrary, when the market is THIS overvalued, one CAN consistently beat the market over time – by avoiding it entirely until after it crashes.
Most people are unable to do this in practice because of “fear of missing out” (like last 4 weeks) or (for financial advisors) “risk of losing clients”.
The only other times when the market was this overvalued were 1999 and 1929. The outcome this time will be no different, it’s just a question of how much longer the market bounces around before it falls 50%.
^^^This is the question.
Ths issue is relative wealth. If most people invest in the stock market and their wealth goes up 20% annually because of this bubble, by staying in tbills, you’re poorer. On the other hand if the bubble implodes you’re richer…
Not financial advice, but I personally think the consumer and most non AI companies will suffer as CEOs salivate at the idea of ai cutting costs by replacing workers. Burry had an interesting blog post recently about basically nothing being cheap right now from a valuation standpoint but also if you’re not an AI company, despite good earnings you’re gonna get crushed. The market is only interested in AI. It’s a bubble, but when it implodes is anyone’s guess.
six month treasuries. American long term bonds are in danger of becoming considered toxic, with an increased likelihood of defaulting.
Are we great again?
Folks ,a bit off topic but financial so going with it.
Many here work on their own vehicles for fun and to save some monies like me.
I have noticed at big box stores where I get me oil(synth)the shelves getting a bit empty,same with grease/brake fluid etc. so I stocked for a bunch of oil changes for me beasts along with other supplies,many companies saying there will be less deliveries soon of stuff of this nature.
I hope things work out and supply remains steady but this is the first time in decades of working on me beasts have seen such s drop in shelf stock.
Apparently because of Hormuz transit issues feed stocks for full synthetic oil are reduced so diy’ers will be paying more to do their own vehicle maintenance.
Nah. Retailers have been cutting back on inventory for long time. Inventory is very costly and capital intensive, and inventory management is the science of reducing inventory to a minimum but still have enough at any one moment to meet demand, and now AI is being added to the inventory management software, and it’s producing results, meaning leaner inventories, but enough inventories. That’s happening everywhere. That’s all that is.
This just leaked from Autozone to managers:
…” So what new challenge are we facing?
In the interest of total transparency there’s zero benefit in mincing words:
Due to the unfolding situation in the Middle East, we’re facing the largest supply shortage of lubricating fluids in the modern history of America.
Realistic, middle-of-the-road estimates are for our average available supply in this product category to drop by 40%.”
And just above that he said: “That’s why I’m not worried by what we’re facing today.”
Mr. Wolf writes: “Fed is behind the curve.” In electrical power grids for over a century, engineers have known the importance of synchronization to the grid. The entire engineering discipline of “Controls” is based upon synchronization and feedback. There is a wealth of mathematics devoted to the controls discipline.
The Federal Reserve can say what they want, but to hundreds of thousands if not millions of scientists and engineers around the globe, the Federal Reserve is not properly managing (controlling) the world’s Reserve currency either through accident or design. It is as obvious as a Surgeon watching a witch doctor doing some kind of ritual to “fix” an internal medicine problem. Truly any engineers can see it, there isn’t even any mathematics coming out of the Federal Reserve; it is all based on the feels of random FOMC people, half that unashamedly have nothing to do with Representative government.
The FED has mathematical models, dynamic systems with feedback similar to engineering control systems. The problem is that the delays involved in monetary policy response are long and variable, which means there is no timely feedback. So this might be a misapplication of modeling. Imagine if you changed your thermostat setpoint but it took 2 years to measure any change in temperature. It just doesn’t work.
“Long and variable lags” is witch-doctor language for “we don’t really understand”.
The reality is that the controls don’t actually work the way any of the witch doctors think that they do.
In fact, there may be no controls at all; the system auto-regulates, and the witch doctors are merely there to do what the market demands while providing a narrative to soothe the anxious.
The longer-term rates don’t dance to the Fed’s tune, and they rarely change the shorter-term rates without the market having signaled readiness in advance.
Gary
Love the analogy…….the surgeon and the witch doctor.
The “surgeon” is the Taylor Rule, the “witch doctor” is the Fed.
We desperately need a hard rail monetary policy.
But you make one grand assumption…….that the Fed is “honestly” attempting to control inflation. It sure doesnt look that way.
One need only to look at a chart of the accumulated increases in the inflation indexes……pick one.
One could ask is the chart a victory OVER inflation or a victory for promoting inflation? One rarely sees this chart….the chart that is essentially the straws on the camel’s back (the average American).
This gas price condition we are in could be THE LOG on the camel’s back.
But if the scientists and engineers feel that way, why do they still vote for the uniparty, which deficit spends and supports the Fed?
Nothing to see here, it’s transitory.
Inflation trade ftw?
Or bond buyers, fool me once, fool on you, fool me twice, fool on you, fool me thrice, fool on you, fool me four times… this time fool on me? It only took 15 years haha.
At this point I’ve resigned myself to not knowing what’ll happen, I’ve no idea which is harder, the rock or the hard place, so investing in both.
I think it’s possible that at least part of yesterday’s steep selloff in the bond market was due to the US’s weakness displayed at the China summit. Just possible.
Howdy Folks. Higher Inflation for some of US is just fine…Some Sober Sailors will find greater discounts as we spend more and more..Bring on the inflation FED and Govern ment. I do not care what you do…
Debt-Free-Bubba,
I to am debt free, If I can’t pay with cash I do not purchase.
I want rates to go through the ceiling.
Real estate and consumer goods will get pummeled creating fantastic deals for non-debtors.
Have a fantastic weekend 🍻
I’m a saver also but I want the dollar’s value to be stable, not decrease with time.
Fed minute May 20. Inflation is higher in Germany and Japan than in
the US. US 30Y Bond 52 weeks range: 4.52% to 5.15%. Stable. Germany 1Y range: 2.88% to 3.67%. Japan 1Y range: 2.83% to 4%. The spread: US 30Y minus Japan 30Y: 1.13%. US 30Y minus German 30Y: 1.46%. Fed min: no change. Gravity between the US and Germany
prevents US 30Y from rising too much, even during high inflation. They can rise in unison.
“Inflation is higher in Germany and Japan than in the US.”
Nonsense.
Inflation in the US: 3.8%
Inflation in Germany: 2.9%
Inflation in Japan: 1.5%
Canada 2.4% inflation
2-Year Bond: ~2.96%
3-Year Bond: ~3.05%
5-Year Bond: ~3.23%
10-Year Bond: ~3.53%
20-Year Bond: ~3.90%
I was half-expecting him to say the Germinal bombed Pearl Harbor.
I see you haven’t switched over to Warsh’s preferred trimmed mean PCE yet, which is at 2.4% … just keep trimming all the outliers until there’s no inflation left in the measure. What could possibly go wrong?
That’s not what he said. The internet BS has polluted your brain. He said he would look at all inflation indices to see the underlying trends, including the Cleveland Fed’s 16% Trimmed-Mean CPI and the Dallas Fed’s Trimmed Mean PCE. He never once said that he wants to shift the measure for the Fed’s target to the Dallas Fed’s trimmed mean PCE.
And he said that he wants better inflation indices that track “a billion prices.” Better inflation indices would be most welcome. CPI sucks. 26% of CPI is OER, and OER is a shitty lazy way of trying to capture inflation that homeowners face. The health insurance component of CPI is absurd, and I discussed it here many times. Better inflation indices would be most welcome, but that’s not what the Fed can do, it’s what the BLS or the BEA would have to do.
But the existing trimmed mean indices (such as the Cleveland Fed’s 16% Trimmed-Mean CPI and the Dallas Fed’s Trimmed Mean PCE) are not new, and they don’t track anything. They just use the PCE price index and remove the outliers up or down. Some people say that this process reveals the trends better than core measures. But no one uses them to measure the LEVEL of inflation, just the underlying trends. Huge difference.
“New issues being so much larger than the issues they replace is one of the dynamics by which the total pile of Treasury notes (2 year to 10 year) and Treasury bonds (20 year and 30 year) increases constantly even as the Treasury Department says that it is not further increasing the auction sizes.”
Why is Treasury saying it is not while they do?
While I agree with Wolf on a lot of his analysis, my perspectivie is that the bond market is in knee jerk mode right now to the daily news on the price of oil and the war in Iran in general. There is enough big and small money that speculates on the bond market, day trading included, that I think the impact of “bond investors” concerned about the interest they are getting today and how it will impact their portfolio in 10 or 5 years or even next year is a lesser impact at this present time.
Wolf, I think you have mentioned in the past you like TIPS for retirement accounts. If you have a take related to recent Treasury yield increases, what are your thoughts for the 10 year TIPS auction this coming Thursday in the current inflation climate?
Sure, if you want TIPS, they look OK now. Currently the 10-year TIPS yield is 2.07%. I doubt that they will go through the auction at that yield, it will likely be lower. but assume that’s what you get: You’ll get a coupon interest payment representing 2.07% of the purchase price plus the inflation protection based on CPI (CPI is currently 3.8% but will fluctuate). So you add those two together, and it looks pretty good. But the inflation protection amount varies over time with CPI.
If you have them in your IRA account, you will see them fluctuate with market prices. So if yields rise from here on out, their market value will fall, and you will see that. If you hold to maturity, it won’t make any difference. But you’ll have to get used to looking at a red figure for a while. If yields fall, that line will show a gain.
In July 2012 Mario Draghi did “whatever it takes” to save the (PIGS) European banks and the Euro. He raided other people bank accounts in Germany to save Greece, Portugal, Spain and Italy. The Irish were bk.
The German 10Y sank to negative territory. JP tried to lift it by raising rates, but in Xmas 2018 he gave up. During the pandemic the German 10Y sank deeper, until Q1 2022. It popped up vertically to 3% in Oct 2023. In early 2022 Russia invaded Ukraine. Since Oct 2023 the German 10Y is rising in a low slog up during Ukraine war and the closure of
Hormuz strait. TNX: 1M Mar flip.
@wolf – How does one calclulate if real rates for tbills (1 year or less) are negative ? Do you simply subtract investment rate from cpi (which i guess is mostly understated) ? I am not going to take long duration for sure because it will be devalued severely.
I guess the only way out is through stocks ?
“Real” interest rates are kind of in the eyes of the beholder. But yes, you take the T-bill yield (for example 3.7%) and subtract the annual rate of inflation of your choice, such as CPI, core CPI, PCE, core PCE, the GDP deflator, your local inflation rate, or your personal inflation rate, or whatever.
You cannot compare T-bills and stocks. The first is risk-free, the second is very risky. Risk-free means by definition very low returns; high risk means potential of big gains and big losses.
The article wasn’t about the basis trade. It was about the rapidly changing bond yields, but I think the basis trade connects to this in that Friday really look like somebody was trying to be the first one out the door and closing their basis trade selling their middle duration bonds and buying back the swaps. On one hand closing these positions makes it more attractive for someone else to buy in and take their place but on the other hand, it looks like someone’s going for the door because it’s you like the point out: he who panics first panics best.
It’s also fairly common for the bond market to try and challenge new Fed chairs at the start of their terms so it’s probably not the best time to be heavily levered on a bet going one particular direction over the next month.
Slow and orderly unwinding is probably fine for the market, but those that are last might have a little bit of trouble making a profit on their trade
I went by my “Gas Station from Hell today”. The price is $6/gallon for regular. The Drunken sailors were lined up topping off their tanks. There was a gas line!!!! Jimmy Carter is rolling in his grave.
Likely get higher, imho. Regardless of what is said by pols and players, until insurance companies feel okay about Hormuz ship safety oil shortages will increase until the market adjusts to the supply reduction. Price rise should then work its magic.
The Fed has been behind the curve for decades, encouraging asset price inflation under the mistaken assumption it doesn’t matter.
What would happen if they stopped offering bonds with durations longer than 5 years? There is obviously still plenty of demand for 5 years and less, I don’t see what they would have to lose?
They’ve been talking about increasing the share of T-bills, but haven’t effectively done that yet. Increasing the short end and eliminating the long end adds some instability to the system because shorter maturities have to be refinanced sooner, and so you have more and bigger auctions. There is a balance in everything.
In addition, there isn’t that much demand for 5-year debt from institutional investors, such as life insurers and pension funds that need long-term predictable assets. So the yield of the 5-year debt would rise to reflect that lack of demand for such massive quantities of new 5-year debt.
Googl, MSFT, AMZN… internet cables underwater, on the Hormuz strait seabed, which connect the trade and the banking system between Europe, the Gulf states and India, are under threat.
What defines the “Internet” is that traffic gets broken up into small packets of data and routed whichever way across a huge global physical network, and then at the destination it gets reassembled. If one line gets cut, it automatically goes via another line. There are not many major locations that depend on only one fiberoptic cable.
In his December 5, 2010 60 Minutes interview, Bernanke was asked whether the Federal Reserve could act quickly enough to stop inflation if it began to accelerate. His response:
“We could raise interest rates in 15 minutes if we have to.”
“…there really is no problem with raising rates, tightening monetary policy, slowing the economy, reducing inflation, at the appropriate time.”
The problem with raising rates is that it would cause a recession. The proper template is the 1966 Interest Rate Adjustment Act. You drain reserves and activate monetary savings / stimulate velocity. Driving the banks out of the savings business does not reduce the size of the payment’s system.
Since October 2025 our means-of-payment money supply has increased by 1.161 trillion. Inflation was the inevitable consequence.