But this dynamic makes it harder for young people to find a job.
By Wolf Richter for WOLF STREET.
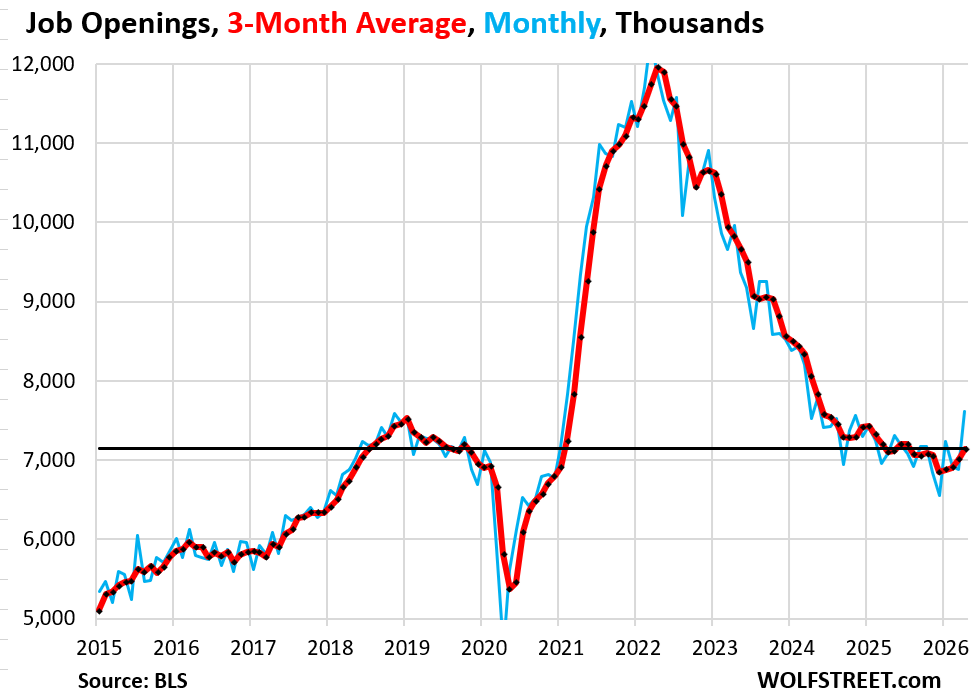
The spike in job openings in April, reported today by the Bureau of Labor Statistics, was somewhat hefty, to say the least: They jumped by 731,000 in April to 7.62 million openings, the most since May 2024. There had been declines in the prior two months and a spike in January. So we don’t get tangled up in month-to-month squiggles.
But the three-month average jumped too, by 125,000, following the jump in March (+112,000) and the smaller increases in the prior two months. The three-month average has now increased for four months in a row and has changed direction and is now at the highest level since July – and that is meaningful (red line in the chart).
This Job Openings and Labor Turnover Survey (JOLTS) of 21,000 business locations adds more color to the labor market in April. On May 8, the preliminary jobs report for April had already drawn a rough sketch of a weirdly decent labor market, with low unemployment, low supply of labor due to the crackdown on illegal immigration, a very high prime-age participation rate, and moderate but sufficient job creation (+115,000, second month in a row of gains).
These job openings are not some fake jobs posted online. They’re based on surveys of HR departments. A job is open only if it meets all three conditions, according to the BLS:
- A specific position exists, and there is work available for that position.
- The job could start within 30 days.
- The employer is actively recruiting workers from outside the establishment to fill the position.
Excluded are positions open only to internal transfers, promotions, demotions, or recall from layoffs; positions for which employees have been hired but have not yet started; and positions to be filled by employees of temporary help agencies, employee leasing companies, outside contractors, or consultants.
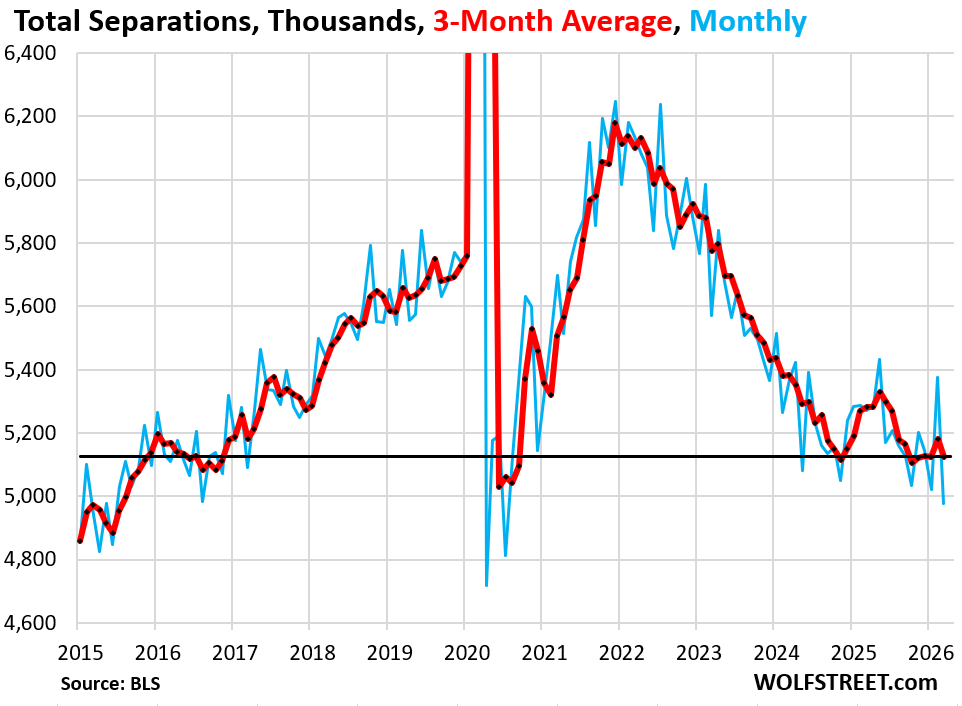
JOLTS, as the name says, is a “labor turnover” measure – not a job creation measure (the jobs report released in May did that): How many people quit their jobs, how many were fired or laid off, how many retired, died, or separated for other reasons, how many job openings those people left behind, and how many people were hired to fill those job openings.
Total separations – voluntary or not – have been very low. They plunged in April to 4.98 million, the lowest since the lockdown months, and before then the lowest since 2015 (blue in the chart).
The three-month average dropped to 5.13 million, and has been in this range since November (red).
Total separations consist of voluntary quits (60% of total separations), layoffs and discharges (34% of total separations), and retirements and other separations (6% of total separations). More on them in a moment.
This low rate of separations shows that an unusual equilibrium has spread over the US labor market, which is efficient for employers since they have to fill fewer newly vacant jobs, and save on the costs of the learning curves that new hires have to climb.
But the lower turnover makes it hard for young workers to slip into a newly vacated slot.
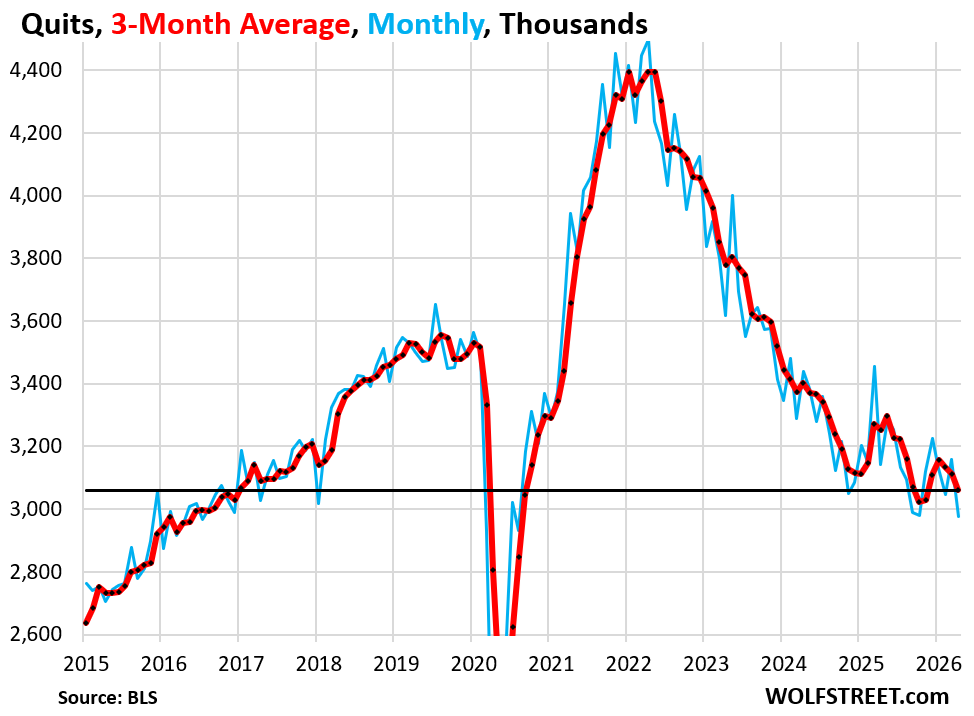
Voluntary quits dropped in April after the jump in March, to 2.98 million, the lowest since September (blue in the chart below). The three-month average fell to 3.06 million (red).
These are people who quit their jobs voluntarily, such as to take a better job somewhere else, but do not include people who retired, died, etc., who are tracked separately.
Quits are the biggest source of the labor market turnover and account for 60% of total separations.
Fewer quits means fewer job openings left behind, and therefore fewer hires to fill those newly vacated jobs.
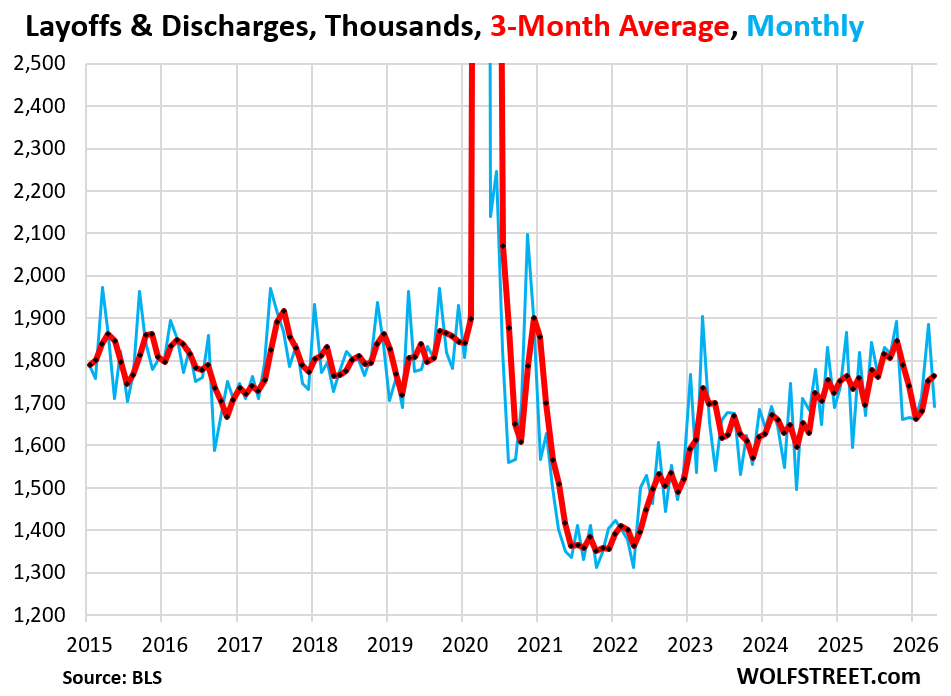
Layoffs & discharges fell by 192,000 in April from March to 1.69 million. The three-month average ticked up to 1.73 million. These levels are at the lower end of the range of the prepandemic years, so normal.
Layoffs and discharges accounted for 34% of all separations. Getting fired for a variety of reasons, or for no reason, is a standard characteristic of the US labor market.
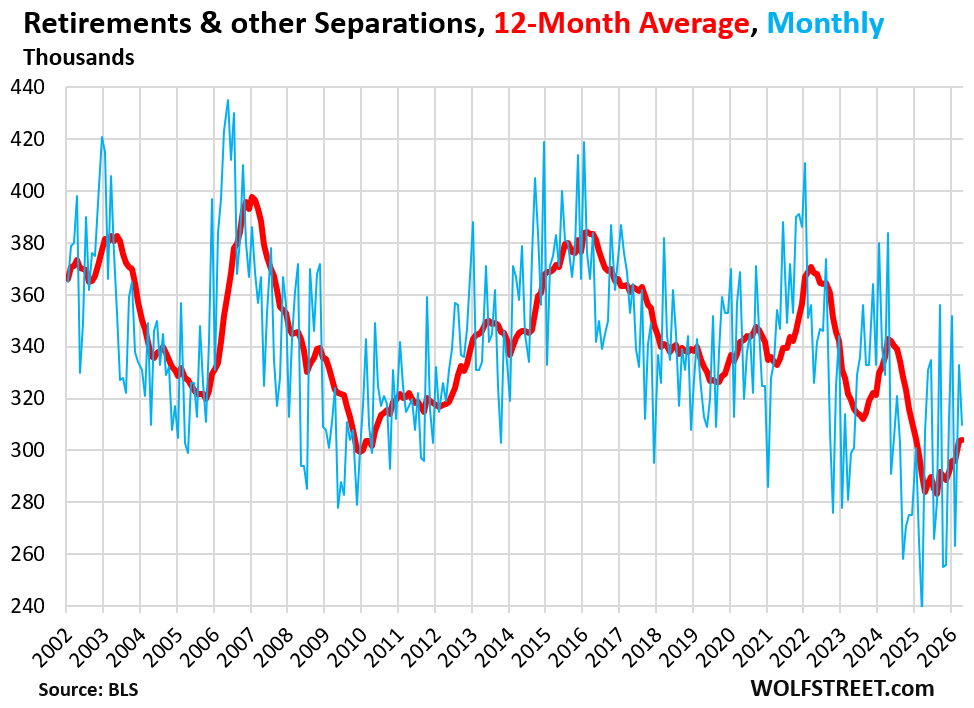
Retirements and other separations (including deaths, etc.) declined to 310,000 in April. The 12-month average, which irons out the huge month-to-month squiggles, remained unchanged at 304,000 in April, after having come up from the 25-year low last year.
We’re looking at the dynamics of the huge wave of boomer retirements that started a decade ago. Mid-boomers are now 70, and the youngest boomers are now 60, and the majority of boomer retirements is now in the past.
Retirements and other separations account for about 6% of total separations.
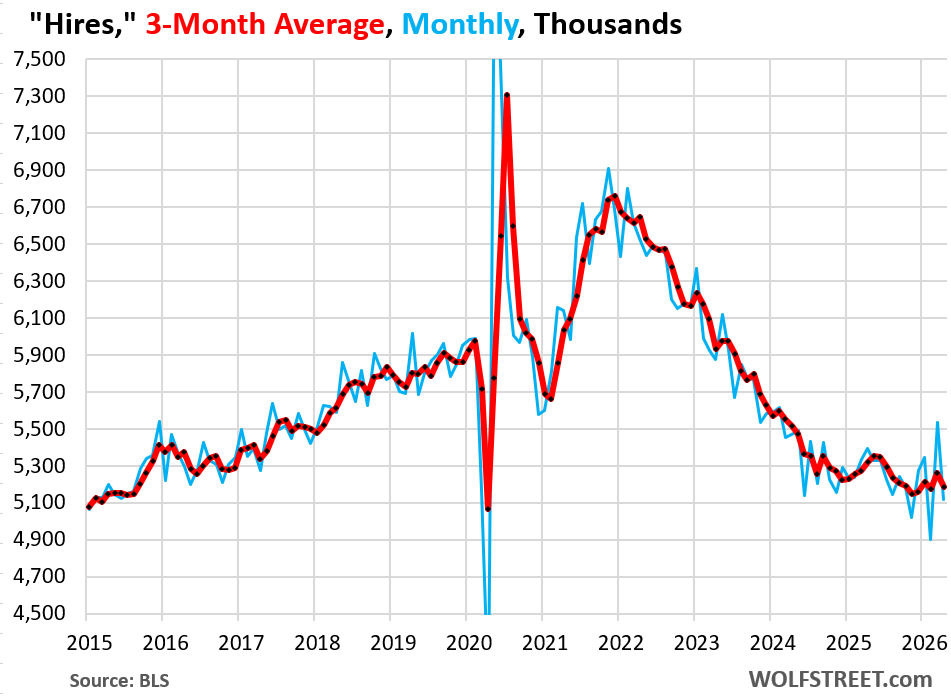
The number of hires dropped in April by 419,000 from March, to 5.12 million hires, after the spike in March, the drop in February, the increase in January…
The number of Hires is mostly a function of total separations. Nearly all of these 5.12 hires filled slots left behind by the 4.98 million total separations in April. But 138,000 more were hired than separated, so by this calculus, they were added to nonfarm payrolls.
The jobs report for April, whose preliminary data was released on May 8, showed 115,000 jobs were added to nonfarm payrolls. The revision of the April nonfarm payrolls will be released on Friday, along with the preliminary May figures.
The three-month average dipped to 5.18 million hires. These are low levels of hires. But with so few total separations, there are fewer job openings left behind, and less need to hire people to fill those openings.
Enjoy reading WOLF STREET and want to support it? You can donate. I appreciate it immensely. Click on the mug to find out how:

![]()
My guess is that we’re in another time of uncertainty re labor needs, along with the factors Wolf lays out. Especially the reduction of immigration labor, which may be good for the native born worker but not great for the economy or social security…that road leads to a European / Japanese aging of the overall population.
As an aside, one of the ironies of recent economics is that looking back, no administration probably did more for the gas producers than the Biden administration to rapidly scale up our LNG production, and no administration probably did worse for fossil fuels than the Trump administration in causing a potentially perpetual world-wide carbon tax (aka crypto tolls to pass the Strait of Hormuz aka “environmental fee”).
May we someday not live in such interesting times! I’m tired, Wolf.
Amen!
No kidding. Trump has done more than anyone to drive home the need for the world to transition to renewables. Solar energy doesn’t pass through the Straight of Hormuz. If our president ever realizes that his real talent is getting the opposite of what he wants, then we might actually be in trouble.
Nuclear buddy
Riiight, THAT’S why Iran is enriching uranium!
For… energy!
Trump admin has driven up oil prices, which is great for the fossil fuel industry profits. Also gutted renewable energy incentives, eliminating competition against fossil fuels, and is tying policies, including foreign policy, to the promotion of oil, gas, and coal and the demotion of renewables. Current admin is wholely behind propping up oil and gas.
MW: Trump taps Pulte for a top intelligence job. This makes an IPO for Fannie and Freddie look even more unlikely.
FMCC -4.17%
FNMA -5.12%
But for now, he is still Fannie’s and Freddie’s boss, and just the acting DNI until a permanent candidate can be found. Obviously, acting could become permanent, and that would be a hoot, having Pulte in change of Intelligence — but thankfully, the DNI doesn’t control the intelligence agencies, they have their own bosses, and they don’t report to the DNI.
There is zero chance Pulte could ever get confirmed in the Senate. There are still enough Republican Senators who care about intelligence over partisanship. Plus throw in the lame duck Senators Trump stabbed in the back (Tillis, Kennedy, and Coryrn) and there is no way such a controversial pick like Pulte could get confirmed.
Just saw on social media: “Actually, it would be pretty easy to be in charge of national intelligence because we don’t have any.”
Nice article and interesting results. It is early innings but I am curious to see how AI changes the employment composition longer term. On the one hand, a lot of jobs are going to be lost or reduced due to the efficiency of AI. On the other hand, there are a lot of new jobs being created because of AI. The to-be-built data centers and corresponding to-be-built power facilities need to be constructed, maintained and serviced for decades or longer – by humans (at least for the foreseeable future). The job growth is likely tilted towards those who are building, operating and maintaining those assets, which requires highly skilled craft persons, requiring a commensurate compensation. We are at the beginning stages of an industrial revolution (AI/Datacenters/Power Facilities/Vehicles (ICE or EV) with FSD/etc.), built by humans.
Might turn out that the AI apocalypse won’t happen, except to the Indians and liberals who work at BigTech.
As AI becomes cheaper it could dramatically reduce most white collar jobs. 1 person can now do the job of 5. It’s either less workers for same job or keep workers and they produce dramatically more. Hard to know what the corporate overloads will decide. Some easy replacements besides tech with current technology:
1. Accounting/finance/analytics
2. Realtors
3. Non trial lawyers
4. Therapists
5. Social media management
6. Data entry/repetitive task type roles
7. Financial advisors
Slightly further in the future (4-5 years)
1. Personal trainers
2. Walgreens type pharmacists
3. General practice doctors
Again not saying 100% replacement but maybe we need 1 person for every 5. What’s saving non tech jobs isn’t that the technology can’t do, it’s that adoption is slow, getting non tech people to understand how to use it us slow and challenging.
Saying this as someone who uses it daily at work and also uses it daily in life.
My fav recent example is my PT had not been able to fix an injury. I gave chatgpt a very detailed analysis of what had happened, what hurt, type of pain, most painful movements. It said it likely one of 3 things. It then walked me through a self eval and said which one it most likely was. I went back and took the info to my PT and she did some tests and goes yeah that’s definitely your problem, how’d you figure that out?
That’s not AI. People have been researching medical issues on the Internet for decades now.
AI helped me to undiagnose a problem wrongly diagnosed by two doctors (including a specialist). AI suggested a more precise test to confirm. I did the test and voila – normal result. Had to go to a third doctor (second specialist) to clear me.
except ai may get more expensive when the loss leaders have to make do rai me. Then companies and individuals might not find the juice worth the squeeze. I have my popcorn out.
IMHO – radiologists are on the top-10 to be replaced. There are literally 200 startups developing software that will identify anomolies in medical images, to identify tumors.
Having worked for GE Healthcare, which makes MRIs, I have no doubt that the first FDA approved devices will be on the market in the next few years (FDA is a slow but good process).
and in 15 years, people will be getting MRIs every quarter and finding stage 1 and stage 2 cancer, and even w/o better therapies, be able to stop most cancers w/o chemo.
I worked for GE Healthcare for about 8 years, in their early stage tech development. I don’t work in medical devices any more.
Some of the recent (& possibly future) oddness in the labor market may be related to people adjusting to new work requirements for those receiving government benefits. There’s a new work requirement for many people for SNAP food benefits.
Per CBS News, “to get food assistance, people ages 18–64 without dependent children under age 14 must participate in qualifying work, volunteer or training activities for at least 20 hours per week” with exceptions for students, pregnant women and people with certain disabilities.
And it sounds like changes are also in the works for Medicaid eligibility down the road.
I don’t think this applies here. These data here are from HR departments, not household surveys.
This is nothing that an army of Indian H1B talent can’t fix.
Love the sarcasm.
Yeah, we invented the computer industry, but we’re just lost without Indians to teach us how to make them work.
In all fairness, zero (nothing) was invented in India. Probably something else I’m not aware of. I’m just not an expert on Indian inventions.
I was being sarcastic.
Those on H1B will not get a green card. They will be out of the labor force. No severance packages for WFH contractors.
This is not true. I was on H1B and H1Bs get severance packages and they are getting their green cards although wait time is long for H1Bs from India.
Also, Indian H1Bs are much cheaper than hiring US Citizens hence tech cos prefer them.
They are not cheaper any more. By law, if you hire a H1B visa, you must offer equivalent US wages. The trouble is no one has been enforcing it. Trump is cracking down on the tech companies by requiring them to pay equivalent wages and proving they can not find a qualified US citizen.
Most Indian H1B’s are computer programmers. Companies are cutting back on hiring CS majors due to Claude AI. A lot of these H1B type jobs will be going away.
We are already seeing the effects of the crackdown on illegal immigration. Previously, if I need someone to assist me with quantum electrodynamics computations, I could drive to Home Depot where they hang out, and I would have my pick from 3-4 PhD’s. With the crackdown, all that is left are uneducated lawn care and day laborers.
You honestly think anyone’s going to enforce that law? Have you read about how elaborate these multi-visa frauds are? Residential houses for registered companies with 15 employees and 10 of them are remote in Bangalore?
By law?!? No way bro.
Curious if there’s info that shows or indicates the categories of the job openings. Such as how many of the openings are for relatively unskilled health care positions–to care for those millions of aging boomers with significant health problems. And how many of the openings are AI-related. And how many are for the types of jobs that immigrants no longer in the U.S. had held.
You’re making up stuff. By far the biggest gainer in April was Professional & Business Services, where a lot of tech companies are situated. These are highly paid jobs, such as AI related, but this is a huge category with all kinds of activities, from Architects to Zinfandel consultants.
The figures are month-to-month changes in April from March. I’m not a fan of month-to-month squiggles, and don’t get too excited about month-to-month squiggles, and use 3-month average (red lines in the charts). But these are the month-to-month squiggles:
Is there not a historical co-relation between low job openings and recessions ?
Falling Quits sometimes precedes a recession but not always. Otherwise JOLTS doesn’t predict much. The survey processing is too slow compared to other employment metrics.
1. How can you say “low?” Look at the #1 chart in the article, which goes back to 2015! Job openings are NOT low. They’re relative HIGH, they’re near the peak just before the pandemic, which had been a tight labor market. But they came off the lockdown effect when 30 million people were let go and then companies had trouble rehiring them.
2. This chart goes all the back to the beginning of the data. You can see how low it went during the Great Recession and following the 2001 recession. Job openings are now about three TIMES as high as during the Great Recession.
Three more employment related observations:
The weekly count of Continuing Claims has been trending back down after being elevated for about a year.
The annual run-rate for Federal payroll tax withholding is up 6% year-over-year.
U-6 unemployment/underemployment is mildly elevated from the Post-COVID low but has stabilized since January.
Seems like maybe the bottom leg on the “K-shaped” meme has begun shrinking?
Wolf, can you clarify a possible subcondition (for lack of a better term) of condition 2 of JOLTS? Does that mean that, every month, BLS eliminates job openings that are older than 30 days? For instance, if Acme Company had a job opening for an accountant on April 1, but had not filled the position by the time May rolled around, BLS would remove that point from the data since the job opening was past the 30 days point? Or is condition 2 solely in place to eliminate job openings that are so far in the future, they’re not worth relying on as potential data?
No, that’s not what that means. It means that the job opening must offer work in 30 days or less.
In other words, if the company says, we want to fill the position of Chef de Cuisine when our current Chef de Cuisine retires in six months (November30 ) and is looking to hire someone now but won’t let them start working until December 1, then this would not count as a job opening. It must be a real job that is available in 30 days or less.
If they cannot find the right person for that job, and the work is available but the search drags out for months with all the usual setbacks along the way, and the work continues to be available, then this is a job opening throughout that time until it’s filled.
That makes sense. I’ve encountered social media posts claiming companies put up fake job postings (for what conspiratorial reason, I have no clue). While I empathize with the people struggling to find jobs who need a strawman to target, the three JOLTS conditions seem to lay that particular theory to rest. I appreciate the response, as always.
Christian,I also wondered that and came to conclusion if any folks offering “false job” openings probably scammers of some sort and perhaps folks trying to get a lot of personal info. to sell perhaps to marketers etc.
Some folks ask for a lot of personal info. before even talking to you,would guess could possibly also lead to identity theft perhaps.
Thats why I loved the trades,usually just talked on the phone,was told where to show up and time,work for a day and take it from there.
There are companies like mine that put up ads, collect resumes and don’t get back to applicants for a long time, we end up not filling roles for 6 months sometimes. Only when a GC forces them due to contract do we onboard someone new within a week. I believe it is all due to dysfunction, but these would be some “ghost” jobs for those applicants 😆.
Not sure how many badly run offices there like ours though
Seba,
You’re not even in the US but Canada.
Seems like an anomaly to have job openings explode relatively and quits way down. Perhaps this will be more clear with future numbers or revisions.
Look at the bold red lines, that’s the three-month average, and that’s the trend.
Many people seem to be whistling in the dark concerning AI.
While the rather unsophisticated crap that business are trying to shoe horn in to reduce the number of workers is still a companie’s wet dream, every year AI gets smarter and smarter. People do not.
While businessmen are growing disillusioned because they are greedily trying to force overhyped trash there is no question AI is gonna come on more and more powerfully.
There are going to be some major benefits to society, it’s certainly possible that the L’s will swamp the W’s.
All depends on your point of view.