The free-money hangover is getting worked off.
By Wolf Richter for WOLF STREET.
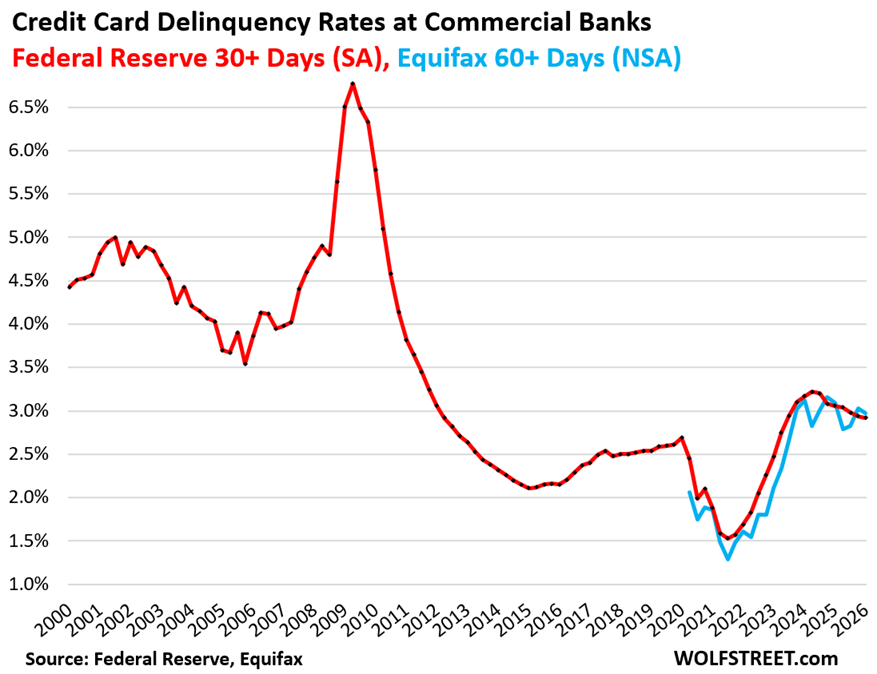
During the Free-Money era, credit card delinquency rates had dropped to record super-low levels. But when the free money ended, delinquency rates rose out of that trough, and overshot a little but still remained relatively moderate within the 25-year context of the data. And then, two years ago, the free-money hangover started to get worked off, and delinquency rates started declining again, and the trend has continued.
The 30-plus days delinquency rate on credit cards issued by all commercial banks declined to 2.92% in Q1, seasonally adjusted (SA, red in the chart), the lowest since Q2 2023, and down from 3.06% a year ago, and from 3.17% two years ago, according to the Federal Reserve, based on regulatory reports filed by all commercial banks. This includes credit cards by subprime-rated cardholders.
The 60-plus days delinquency rate by all credit cards, including private label credit cards (such as store cards), and subprime credit cards, declined to 2.97%, not seasonally adjusted, at the end of Q1, down from 3.09% a year ago, and down from 3.12% two years ago, according to Equifax whose data only goes back to June 2020 (NSA, blue line).
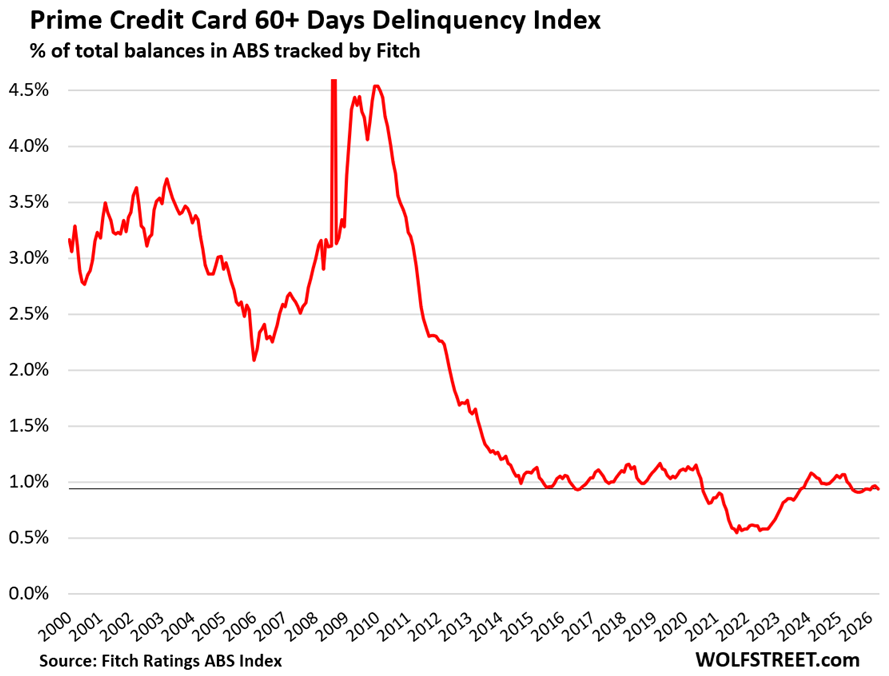
For prime-rated cardholders, the 60-plus days delinquency rate dipped to 0.94%, according to data from Fitch Ratings, which tracks the performance of Asset Backed Securities (ABS) backed by prime credit card balances.
The rate is below the low points before the pandemic and has been in this range for about a year, after coming down from the free-money hangover in the two years before, when it had gone as high as 1.07%, which was still lower than the highs in the Good Times years of 2017-2019.
Credit card balances: a measure of spending, not of borrowing.
Credit card balances are statement balances before payments are made. They’re a measure of spending, not a measure of borrowing. Most of these charges get paid off every month by due date and never accrue interest.
Over $5 trillion get paid for via credit cards every year. Credit cards are the dominant consumer payments method, largely replacing checks and cash. Debit cards are the second most popular payment method. Watchers of the economy keep an eye on credit card balances as an indication of consumer spending growth.
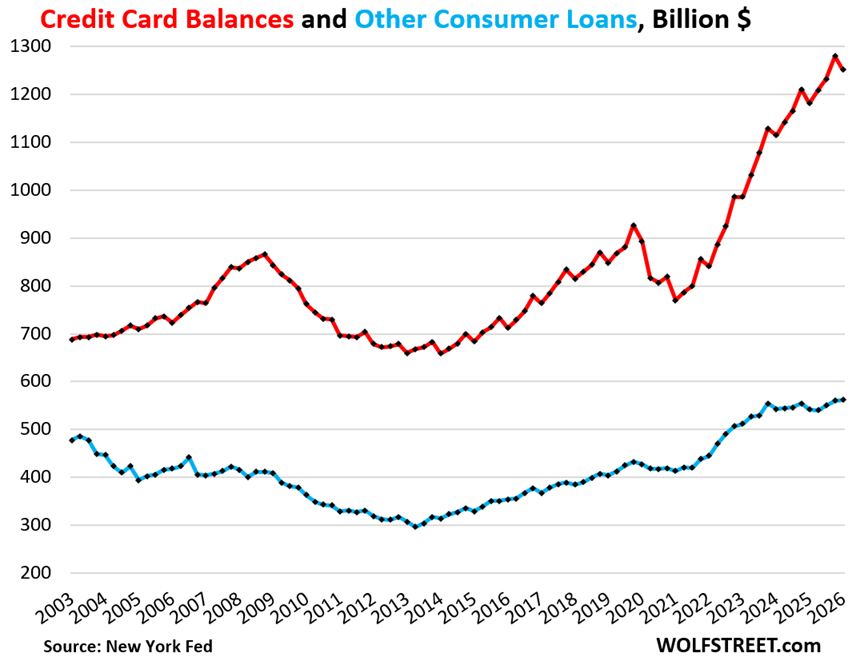
Credit card balances (red line in the chart below) dipped by $28 billion (-2.2%) in Q1 from Q4 – along seasonal trends after the holiday spending spree in Q4 – to $1.25 trillion, according to data from the New York Fed’s Household Debt and Credit report based on Equifax data.
Year-over-year, credit card balances rose by $70 billion, or by 5.9%, on growth in consumer spending and price increases. The data confirms that spending growth was solid but not spectacular.
“Other” consumer loans including BNPL (blue line) was essentially unchanged in Q1 from Q4 and rose by 3.7% year-over-year, roughly in line with inflation, to $562 billion.
This category includes personal loans, Buy-Now-Pay-Later (BNPL) loans, payday loans, etc., and many of these balances, except current BNPL balances, accrue interest.
What’s astonishing is that these other consumer loans have barely risen over the past 23 years, despite population growth, income growth, spending growth, 83% CPI inflation, and the arrival of BNPL loans.
The revolving-credit-to-income ratio.
Credit card balances (red in the chart above) and “other” consumer debt (blue above) combined – so total revolving consumer credit – dipped in Q1 from Q4 by 26 billion to $1.81 trillion. The dip was in line with seasonal patterns. Year-over-year, revolving consumer credit rose by 5.2%.
The debt-to-income ratio is a classic way of evaluating the burden of a debt. With households, we can use the debt-to-disposable-income ratio.
Disposable income (Bureau of Economic Analysis) consists of after-tax wages, plus income from interest, dividends, rentals, farm income, small business income, transfer payments from the government, etc.
But it excludes capital gains, which is where the wealthy make most of their money. Excluded are thereby income from stock-based compensation plans and capital appreciation where billionaires make their billions.
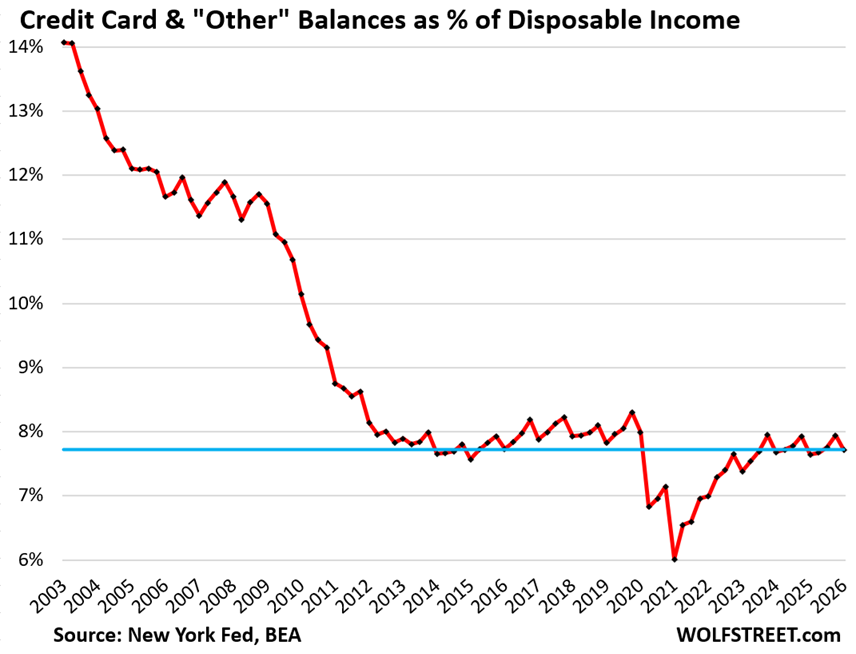
The ratio of revolving credit balances to disposable income in Q1 dipped to 7.72%, below where it had been during the Good Times before the pandemic.
During the pandemic, the ratio plunged as credit card balances dropped because travel, eating out, drinking out, and other activities were curtailed, and people couldn’t use their credit cards for them, while disposable income shot up amid an absurd flow of government payments directly to consumers.
The ratio emerged from that trough in 2022 but has remained below where it had been in the years before the pandemic and is very low in a 23-year context.
Before the Financial Crisis, Americans really did have a lot of credit card debt in relationship to their incomes, which caused some havoc during the unemployment crisis that followed. But that’s not the case now.
Unused credit rises to a record.
Banks make money on the swipe fees they earn every time a customer uses their credit card to pay. The merchant pays the swipe fees. So banks and their affiliate partners, such as airlines, are trying aggressively to get people to set up new credit card accounts, and they offer kickbacks to their customers to use the card, such as 1% or 2% cash-back or miles or whatever.
In addition, banks make large amounts of money on the annual fees they charge for some of their credit cards, and some of these fixed fees can be hundreds of dollars per year.
And it works, as Americans keep opening new accounts including for premium cards with high annual fees.
In addition, banks increased credit limits on some existing cards to encourage more spending and more swipe fees.
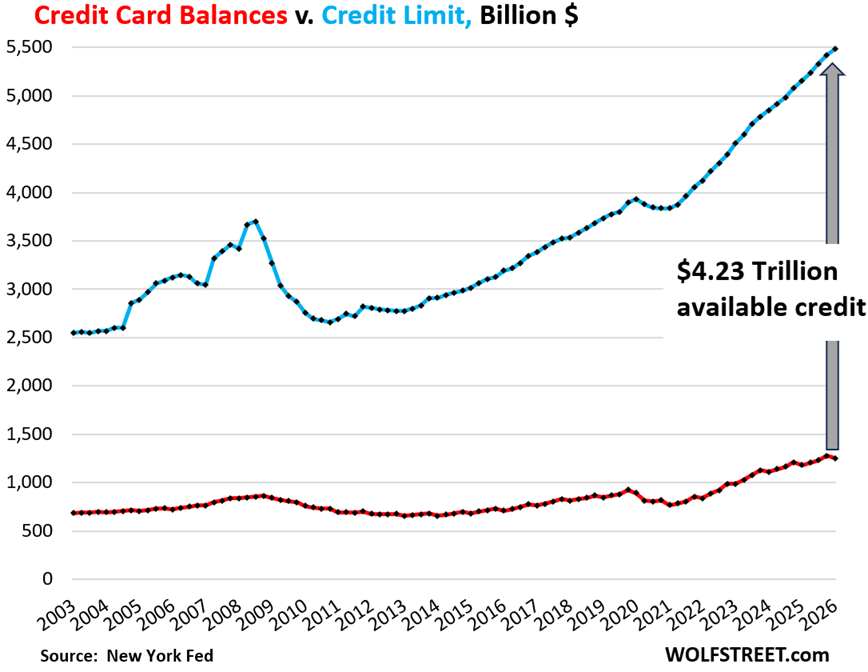
And it shows: The aggregate credit limit rose by $60 billion in Q1 from Q4, to a record $5.5 trillion (blue in the chart below), outgrowing balances which dipped by $28 billion over the same period (red).
And the available unused credit — the difference between the two — has soared from record to record, and in Q1 reached $4.23 trillion (gray arrow). So Americans are “maxed out on their credit cards?”
Third-party collections wobble along at record lows.
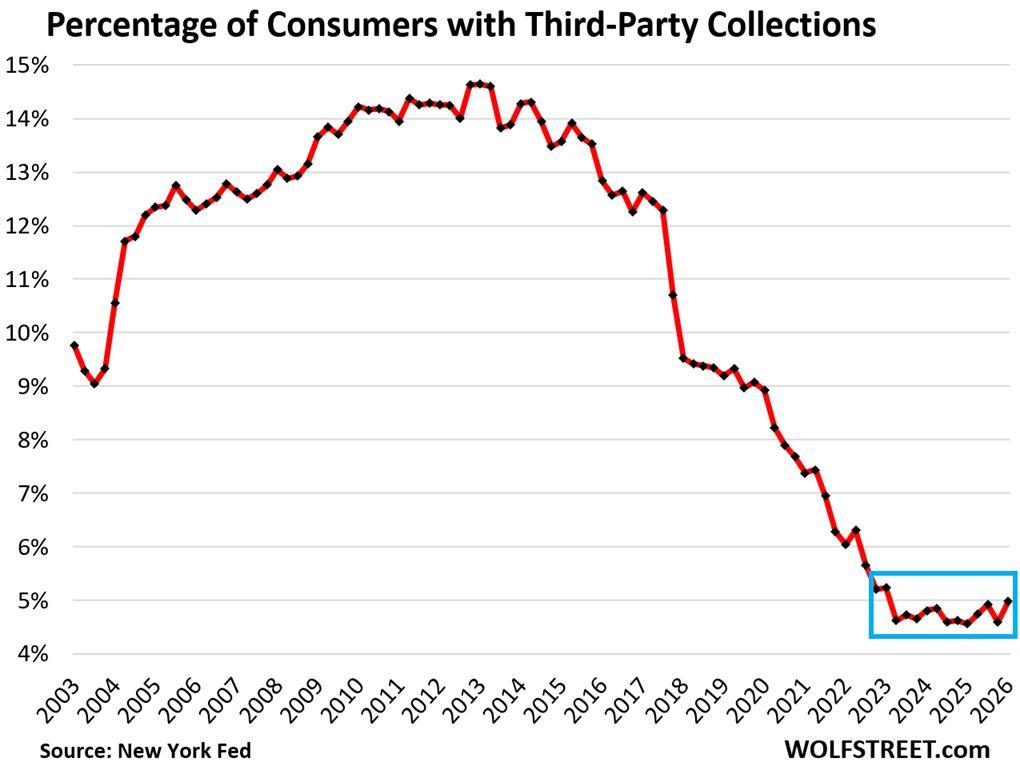
A third-party collection entry is made into a consumer’s credit history when the lender reports to the credit bureaus, such as Equifax, that it sold the delinquent loan, such as credit card debt, to a collection agency for cents on the dollar. At that point, the bank washes its hands off it. The New York Fed obtained this third-party collections data through its partnership with Equifax.
The percentage of consumers with third-party collection entries on their credit reports has been creeping along rock bottom for over three years, in the 5% range, down from 14% after the employment crisis that came with the Great Recession. Large-scale job losses eventually lead to large waves of hopelessly delinquent credit card debt getting sent to collection agencies.
In case you missed it, this rounds off my four-part quarterly analysis of consumer debt and credit:
Enjoy reading WOLF STREET and want to support it? You can donate. I appreciate it immensely. Click on the mug to find out how:

![]()
First time commenter here. I’m in my mid 30’s and until I found your site about a two years ago I knew nothing about how the US economy actually worked. Wolf, thanks for all your work to actually explain what this data means!
My observation, and you’ve said this many times, is that the US consumer is doing just fine, but the drunken sailor’s in Washington seems to enjoy playing with fire. At some point something is going to break (large AI elephant in the room).
My question is this: Are Americans managing their CC debt well because it carries the highest interest rates, but beginning take out lower interest rate HELOCs to deal with the rising financial pressures? Your previous article noted a slight rise in that type of debt.
JMac,
Go talk to successful members of your family who were working or successfully navigated companies through the 1970’s. Interest rates are going up, but unfortunately, this time in a country with 120% Debt:GDP. This really is uncharted water for America. The purchasing power of the dollar will decrease substantially, it has to, it’s a mathematical certainty. The question is how much? Will it be a Japan-style outcome or an Argentina-style outcome, or a Soviet Union style outcome? Regardless, prepare now.
how do you know that purchasing power of dollar will decrease really?
You aren’t serious right? This is the MATH when you have 40 trillion in debt that needs to be serviced and 12 trillion that needs to be rolled over. America cannot default. The Fed will print the currency to buy the debt that needs to be issued. This is made worse by the Iran war and tax cuts.
Purchasing power of the dollar has been decreasing since 1913.
It’s not a hard prediction to make.
I’m wondering do things like affirm factor into this?
Is that BNPL? It is mentioned in the article.
Well, there’s also the fact that at 20+% interest rates, anyone who cannot manage their CC debt well goes bankrupt very rapidly. The debts are cancelled, their credit is ruined, and then the majority of the people left over to be represented in these charts are the ones who did not blow up their CC bills.
Some with bad spending habits and mediocre credit manage to hang on for years, paying lots of interest and very little principle, and dodging calls from collectors.
Those with good credit can get much lower rates than 20% on purchases. They can further avoid paying that by rolling it over into one of those “balance transfer” offers with an even lower rate.
Consumers are more than fine. They always use home equity for various things. HELOCs are up because it’s cheaper than cash-out refi.
Does a delinquency rate metric that combines the delinquencies of credit cards recognized in the balance sheets of commercial banks and the delinquencies of credit cards that have been packaged into ABS exist?
Yes, first chart, blue line = delinquency rate of ALL credit cards.
What? No “frying pan” highlight or reference? Reminds me of detective Joe Friday, “just the facts”…
Like a special frying pan with two long handles. Not a classic frying pan anymore.
Dutch Oven? LOL.
So it seems that everyone benefited from years of cheap money, not just the rich.
Free money is the best money 🤣
Yeah…..
I do not necessarily agree with it…
But if one does not take advantage of the cards handed, then he will be hosed.
Playing the cards handed, not the cards wished.
Is the growth in credit card balances compared to flat other consumer loans because many credit cards now have either some balance transfer option (0% for 12 mo or whatever) or a BNPL option for a credit purchase? No need for a separate loan if its all within your credit system. Feel like I get multiple emails or letters each week offering these to me through existing credit lines, but I don’t know how many of the sailors partake.
No, you don’t understand what the data is based on. The credit card balances are based on the exact balances that banks report to the credit bureaus as credit card balances by CC account number and name. The BNPL balances are reported by the BNPL companies as BNPL balances by customer name and account number. Same with personal loans reported by banks to the credit bureaus by customer name and account number.
If you transfer $10,000 from your Visa card to your MC, it will lower the reported balance of your Visa card by $10,000 and increase the balance of your MC by $10,000 with zero impact on your personal total credit card balances, and with zero impact on total US credit card balances.
If you pay off a $500 BNPL loan with your Visa card, it will lower the reported balance of your BNPL account by $500 and increase the balance of your Visa card by $500 with zero impact on your personal total debt credit, and with zero impact on total US revolving debt. All it will do is shift $500 from “other consumer loan balances” to “credit card balances.”
Check your credit report, and you will see the detailed data by account that this is based on.
@JMac44 You will learn more reading what Wolf writes than reading anything in the mainstream media (and learn even more from the commenters who often have interesting personal or regional views on the economy). It has been 30 years since I was in my “mid 30’s” and over the past 30 years there have been people who have been telling me that something big is going to break nonstop. My advice to you is to avoid the people who say we are doomed, find a job that AI won’t replace, avoid debt and adjust your life so you make more than you spend every month and invest the difference.
Great advice, and in particular the last sentence. Actually, the whole comment was bang on. After the high interest regime of late 70s and early 80s I vowed to be in as much control as possible. No debt, no debt, no debt, and that might mean saying no about things that probably aren’t that important, anyway.
Wolf, is that photo in the Wolf Street Paywall ad today 1) Wolf as Humpty Dumpty taking a great fall; or 2) Kung Fu Wolf shattering a brik wall with his bare hands?
This is scene 5 in a 6-scene series. You may have missed the prior four. Each scene only runs 2-3 days. I will re-run the series. I think they’re hilarious. I hope people get a smile out of the series. I’m now working on a new series. I’m having a blast doing this stuff. And I hope it adds some entertainment to the sour mood here.
Wolf, does the increase in 90-day delinquencies worry you at all? And have housing costs expanded dramatically as a percentage of disposable income? I’d be curious to see housing + credit cards combined compared to 2008-2009.
You’re citing bullshit concocted by morons for morons. what you’re referring to is an annual transition rate that the NY Fed extrapolates and that idiot bloggers out there misrepresent as “delinquency rate,” to pollute people’s brains with clickbait lies, including your brain.
Anyone calling the NY Fed’s transition rate a “delinquency rate” is an effing liar.
So no, I’m not worried about bullshit. I’m worried about the condition of the human brain that loves to eat bullshit 24/7.
The New York Fed has no such thing. Everything it offers that is 90-days is a transition rate. Read its Data Dictionary.
“We may have gone from a saving glut to not enough savings.” — Jamie Dimon, JPMorgan CEO
What we have is dis-savings.
There is a lot of saving going on, but it’s mostly not going to savings accounts and CDs at banks, it’s going into 401ks.
Sure. Also, depending on a person’s income, it may make more sense to hold the cash liquidity portion of a portfolio, aka, an “emergency fund”, in a Roth IRA. Some stock ETFs can be very tax efficient.
In the financial independence community there is a debate about whether a person should keep a large emergency fund in a bank account or if people can just tap their credit sources in the event of an emergency and then pay the loans off as soon as the emergency is over.
When I see people expanding their available credit, I think about record-low consumer confidence and high job loss anxiety. Maybe people are prepping for a period of income loss, when they cannot or will not save up a traditional emergency fund to cover that contingency?
Of course, there are also immediate incentives to increasing one’s credit lines. A couple years ago, I prostituted out my credit score to get sign-on bonuses on over a dozen cards. Instead of going down, my credit score went UP to about 820, largely because I had such a low percentage of available credit that was being utilized.
I not only made a couple thousand bucks, but I also increased my credit score, which makes my insurance cheaper. So I’m a big contributor to the balances vs. credit limits chart. I can say it was profitable.
Statistics are interesting in a k shaped economy the upper part offsets the lower part so it’s hard to say. I think some people are struggling and some are doing great.
As for credit, times have changed. I don’t carry a balance on my credit cards but I have around $80k of credit available to me, because if there’s no fee why close them?
Most people I know in HCOL cities feel poor regardless of income. The boomers though they’re doing great.
Overall growing wealth divide is good for some and not got others
Sounds like this “financial independence community” is maybe not as independent as they think? lol
The denominator means more than the numerator ever will.
Not being a dill hole….
Just trying to do something good with the insanity that is handed.
Speaking of credit, the SEC removed the 25k margin equity requirement for pattern day trading. I think a whole new generation of traders that has never seen a bear market is about to learn how painful margin calls can really be.
Either that or the SEC just confirmed that the stock market will never fall again.
The US stock market truly looks unstoppable today and imo the reason why is that Goldman and other wall st banks have 3 mega Ipos to launch:
Anthropic, open ai and space x.
After those launch, look out below.
If we look at govt., business and consumers as the three financial entities that compose the US economy don’t we have massive debt, very large debt and modest debt, respectively.
The dirt removed that is now the hole I call debt went somewhere (not equally). Consumers; which given the imbalance and resulting hazard doesn’t that make consumer wealth somewhat of an illusion?
When does this imbalance become *a real problem* for all?
I wonder what the debt as a percent of disposable income might look like if you had a version of that graph with the top 1%, 5%, and 10% of earners removed. Is that data available and do you think it might tell a different story than “everything is fine”?
They’re already removed, as explained in the article: Disposable income does not include capital gains, and that’s where the wealthy make nearly all their money.
I saw that, but there is a pretty wide income disparity among people even without capital gains, no? Or is there just no chance it could have a significant impact on the ratio?
1. Sure there is an income disparity. Get used to it, dude. But people earning millions or hundreds of millions from their stock compensation plans, capital appreciation, etc. are excluded from disposable income. Those would be the ones that distort the figures.
The median married-couple income in the US = $120,000 (census data). That means half of the married couple households make more and half make less. There are going to be some that make $40k, and some that make 400k. But you don’t get the massive distortion that capital gains produce.
2. LOW-INCOME PEOPLE HAVE VERY LITTLE DEBT BECAUSE THEY DON’T QUALIFY FOR IT. Many of them don’t even have credit cards at all, because they don’t qualify. They have to make do with debit cards. But the young high-income dentist that went into it over his head to furnish his new house has $200,000 on his credit cards. The CC balances of higher-income people is driving up the numbers because they’re the ones that actually have high credit limits because they qualify for them. I discussed this a million times.
Thanks Wolf!