Americans and their Debts: Student loans that suddenly have to be repaid again fueled overall delinquency rates.
By Wolf Richter for WOLF STREET.
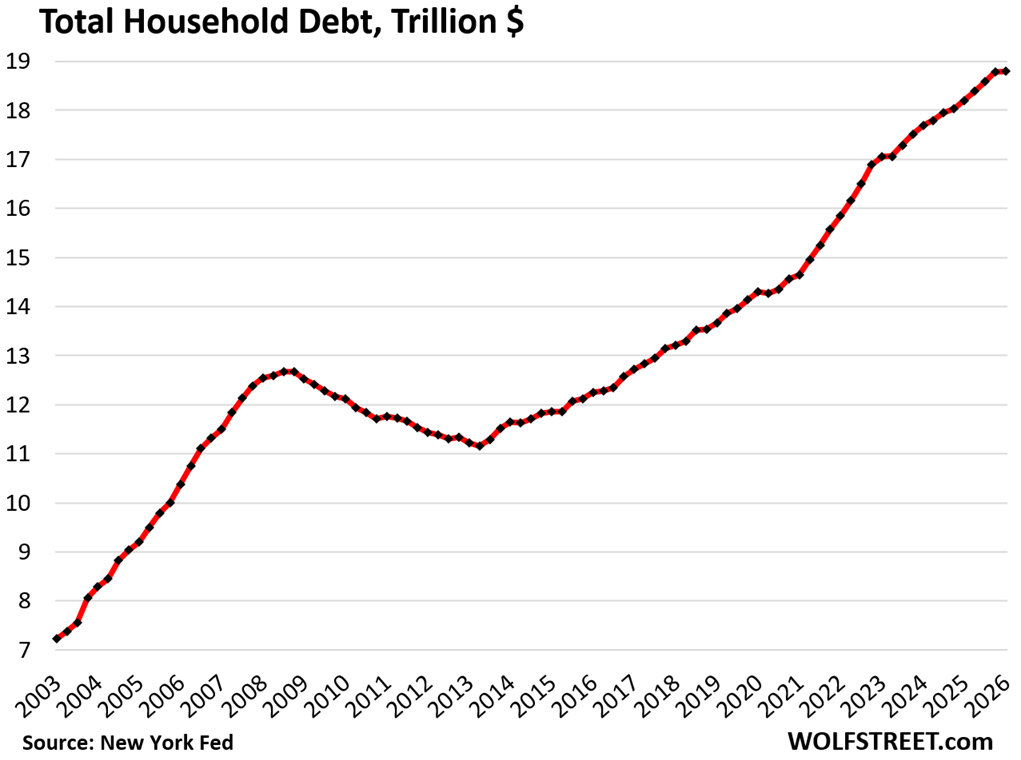
Total household debt outstanding in Q1 – mortgages, HELOCs, student loans, auto loans, credit card balances, and other consumer loans such as personal loans and BNPL loans – was nearly unchanged compared to the prior quarter, at $18.79 trillion, according to the Household Debt and Credit Report from the New York Fed today, which obtained this data via its partnership with Equifax. Year-over-year, household debt rose by 3.2%, or by $591 billion.
Compared to the prior quarter: HELOC balances jumped, auto loan balances rose, credit card balances fell, mortgage balances edged up, and student loan balances were essentially unchanged.
But the number of households has grown over the years, and the income per household has grown on average, and total household income has grown faster than total household debt, and the burden of this debt on that income has declined over the years.
The burden of the debt.
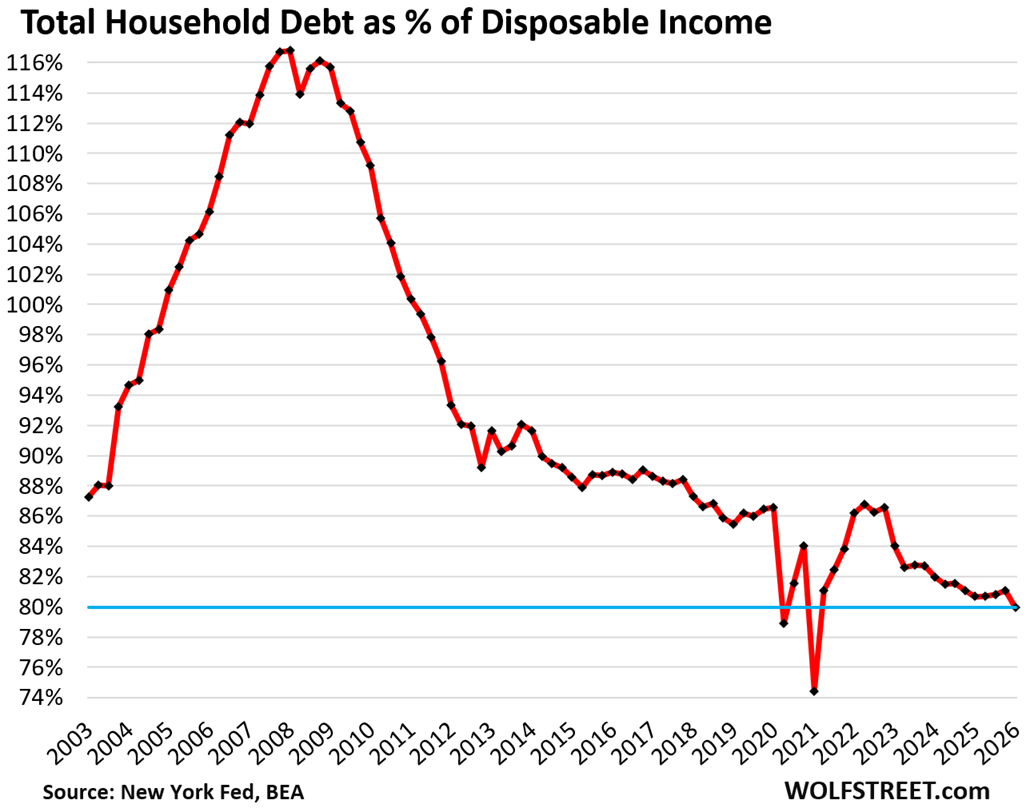
The debt-to-income ratio is one of the standard ways of measuring the burden of a debt. With households, an appropriate income measure is “disposable income,” released by the Bureau of Economic Analysis.
Disposable income is essentially the monthly after-tax income consumers have available to spend for their costs of living, to service their debts, and to save and invest.
It consists of after-tax wages, plus income from interest, dividends, rentals, farm income, small business income, transfer payments from the government, etc.
But it excludes capital gains, which is where the wealthy make most of their money. Excluded are thereby income from stock-based compensation plans and capital appreciation where billionaires make their billions.
The debt-to-disposable income ratio in Q1 dropped to 79.9%, as disposable income rose to a record while debt balances essentially remained unchanged.
This ratio was the lowest in the data going back to 2003, except for two quarters during the stimulus era, when disposable income was bloated out of all proportion by massive government handouts, including the stimulus checks, PPP loans, and numerous other programs.
Consumers are working and earning record amounts of disposable income, and their aggregate balance sheet is in good shape: 65% own their own homes, and about 40% of them own their homes free and clear, while another big portion has only a relatively small balance left on their mortgages. Over 60% of households have at least some equities, and their prices have exploded. And they hold precious metals and cryptos and are sitting on $5 trillion in money market funds plus a pile of CDs.
In other words, the balance sheet of the economic entity of American households is in good shape – unlike some other economic entities that are massively overleveraged, such as certain corners of finance, parts of Corporate America, and of course the federal government; that’s where the leverage and risks are, not with households this time around.
But that wasn’t always the case. Leading up to the Financial Crisis, consumers were highly leveraged and they were piling on debt, and when the debt-to-disposable-income ratio went over 115%, the whole thing began to implode.
Defaulted student loans fuel the overall delinquency rate.
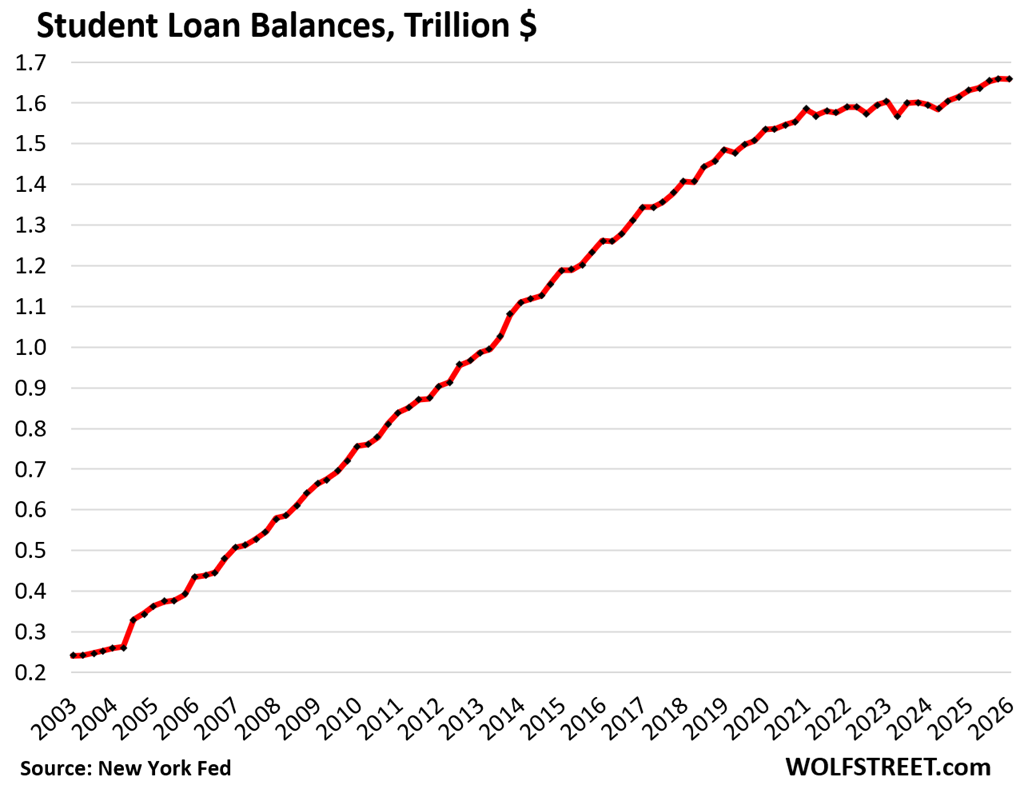
Student loan balances were roughly unchanged in Q1 compared to the prior quarter, at $1.66 trillion, and up by 1.7% year-over-year.
This chart is a visual representation of two decades of bad government policy.

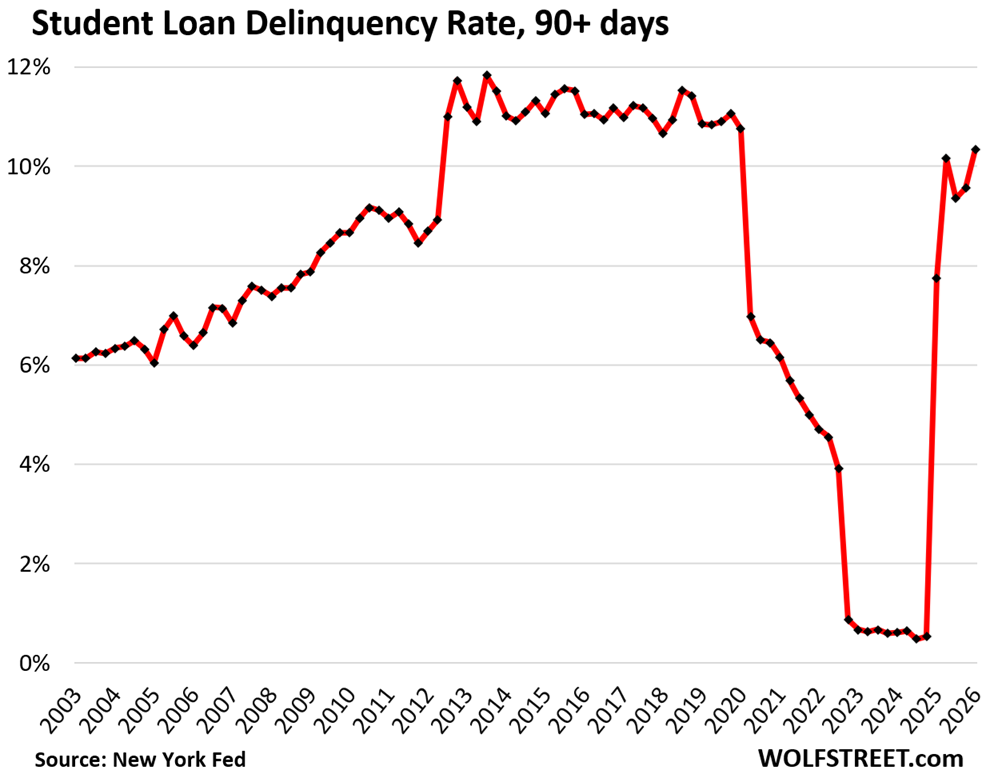
The 90-plus day student loan delinquency rate rose in Q1 to 10.3%, back where it had been before the pandemic, according to the NY Fed’s report today.
In 2025, federal student loans that had been covered by the government’s forbearance policies since 2020 came out of forbearance. During the government’s forbearance program, borrowers didn’t need to make payments, and their loans weren’t counted as delinquent, as if they didn’t owe this money. But that ended in 2025, and those federal student loans suddenly showed up on credit reports again, and delinquency rates exploded.
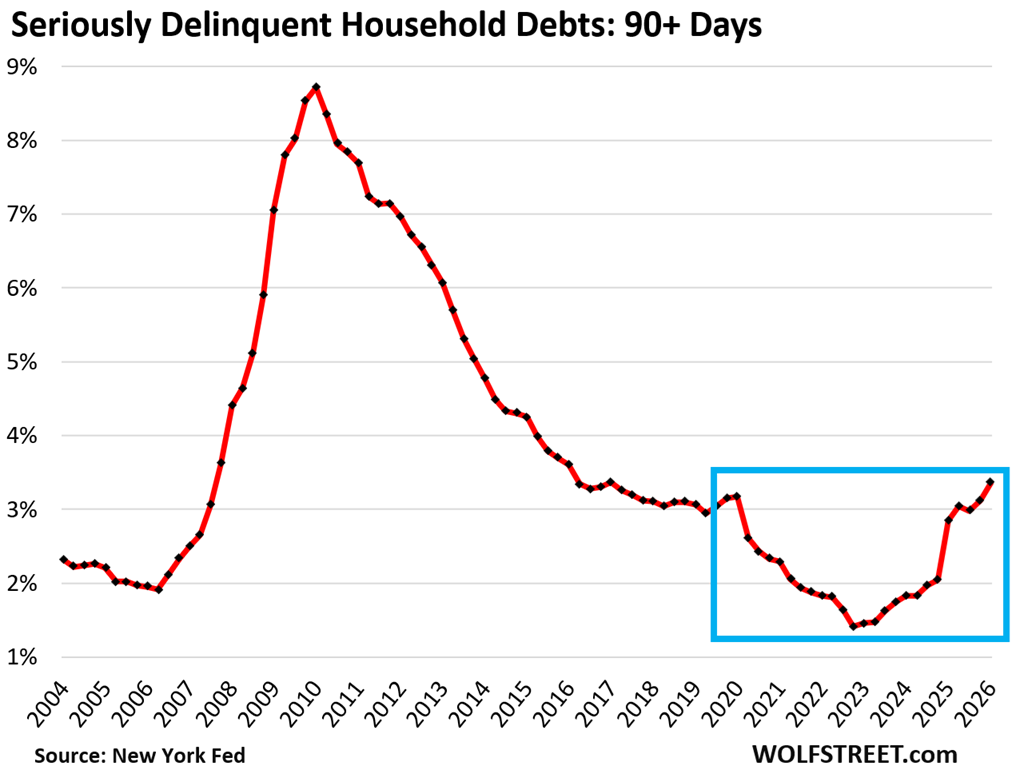
The overall 90-day delinquency rate got whacked by student loans and rose to 3.36%, the highest since before the free-money pandemic.
This is the amount of the total debt ($18.79 trillion) that was 90 days delinquent at the end of Q1, amounting to $631 billion (delinquency rate = delinquent amount divided by the amount of the debt).
While the 90-plus day delinquency rate for student loans was 10.3%, it was 0.95% for HELOCs and 1.09% for mortgages.
All of the delinquency rates are coming out of the pandemic free-money trough and are reverting to the levels of the pre-pandemic years (I will discuss those loan categories in separate articles over the next few days).
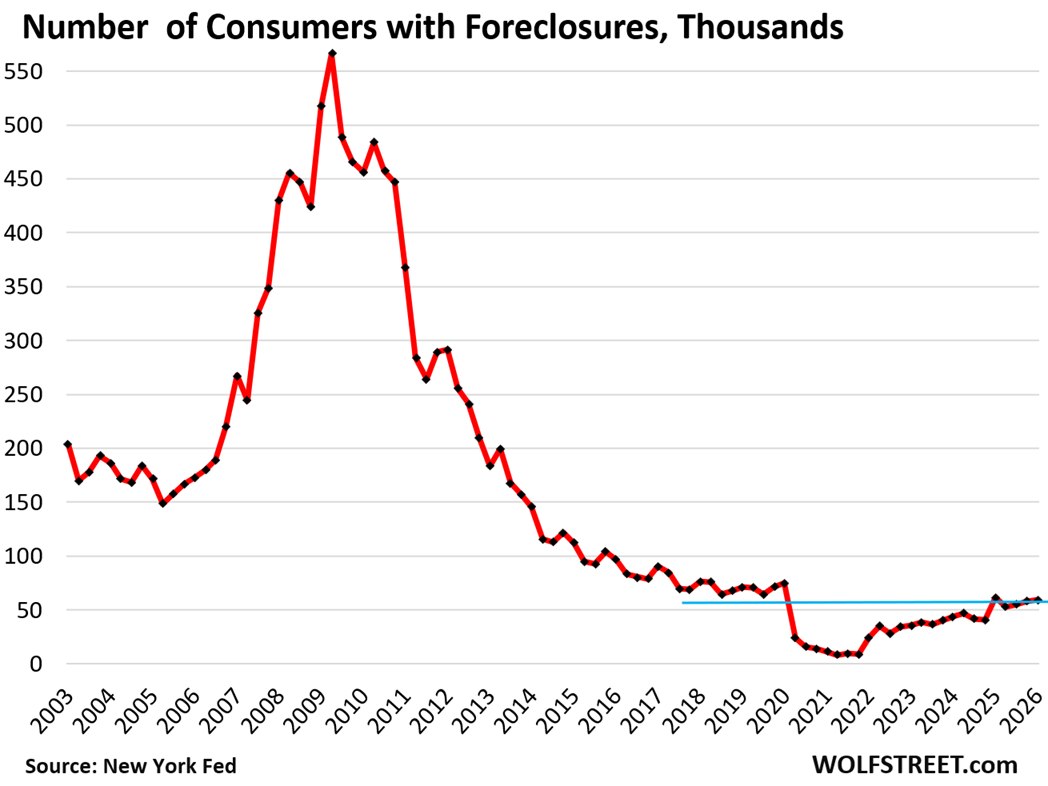
Foreclosures edged up further from the near-zero levels during the era of mortgage forbearance, when foreclosures were essentially impossible.
The number of consumers with foreclosures in Q1 of 59,160 was still below the low end of the Good Times in 2018-2019, and far below the number of foreclosures in prior years.
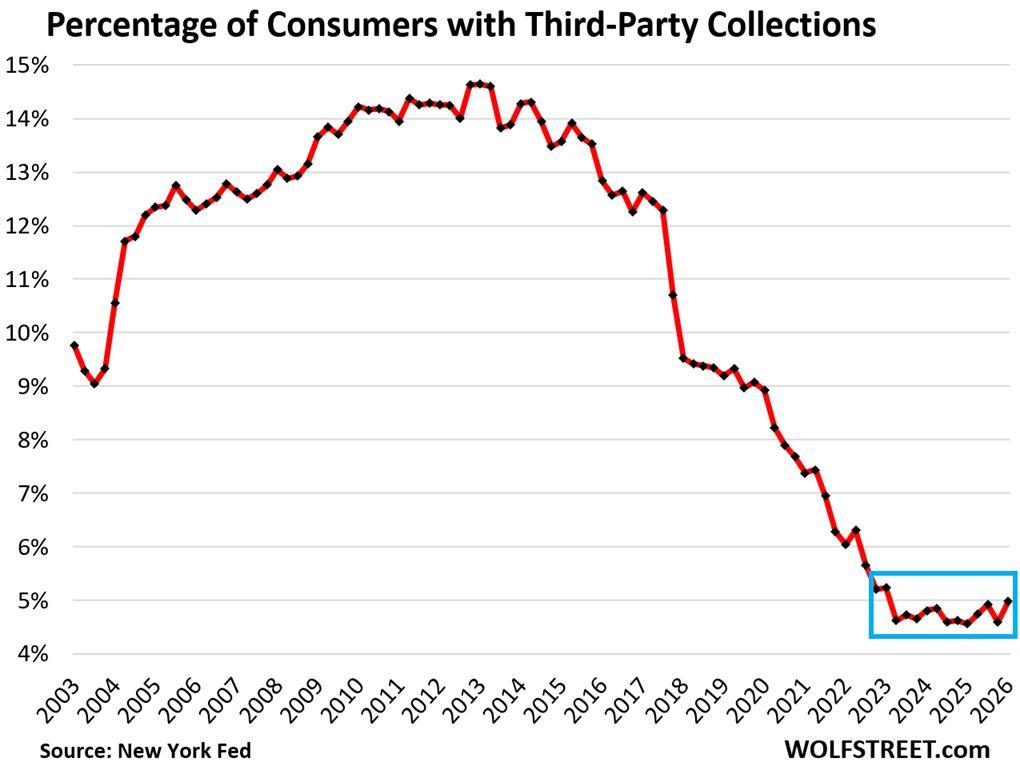
Third-party collections bounced off rock-bottom. The percentage of consumers with third-party collection entries on their credit reports rose to 5.0%, after having hit rock-bottom in Q4.
In 2013, as a result of the Great Recession and the unemployment crisis, over 14% of consumers had third-party collection entries on their credit reports.
A third-party collection entry is made into a consumer’s credit history when the lender reports to the credit bureaus, such as Equifax, that it sold the delinquent loan, such as credit card debt, to a collection agency for cents on the dollar. The New York Fed obtained this third-party collections data in anonymized form through its partnership with Equifax.
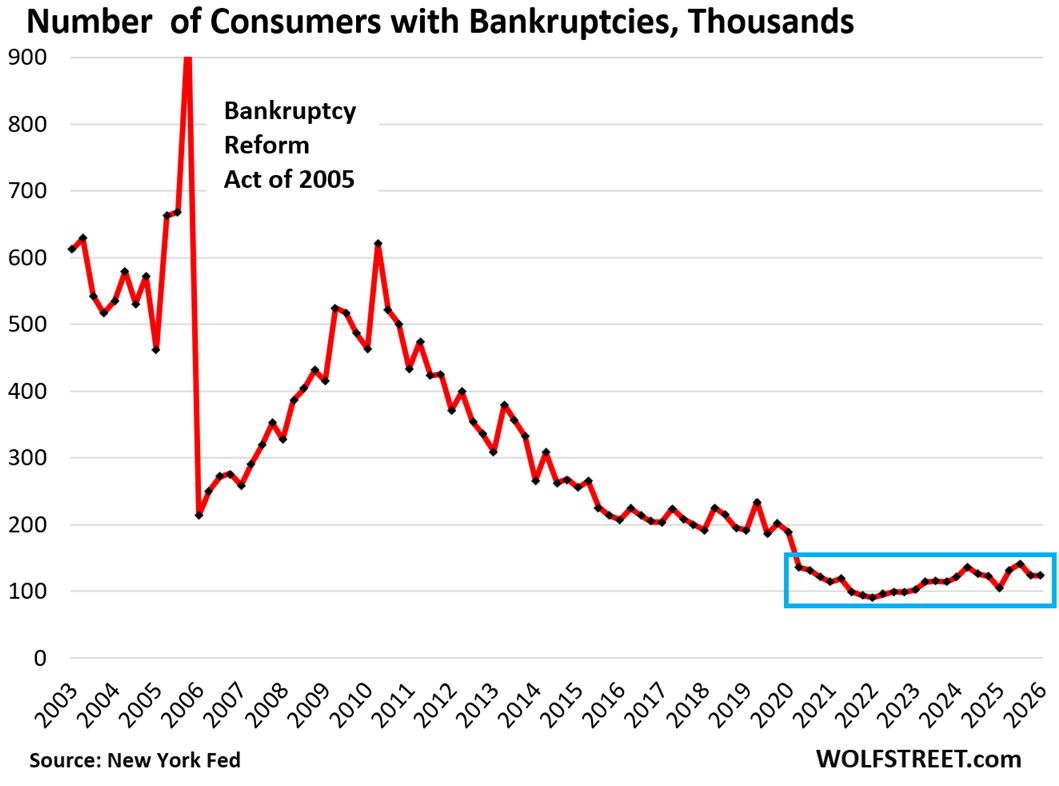
Bankruptcies near rock-bottom. The number of consumers with bankruptcy filings edged up to 124,020 in Q1, far below the low end of the Good Times before the free-money pandemic, which had also been historically low.
I will discuss housing debt, credit card debt, and auto debt in three separate articles over the next few days. Next one up is housing debt.
And in case you missed it: Weirdest U.S. Labor Market I’ve Ever Seen: Supply of Labor Shrinks Further while Private-Sector Jobs Grow
Enjoy reading WOLF STREET and want to support it? You can donate. I appreciate it immensely. Click on the mug to find out how:

![]()
Looks like the consumers are in great shape. Job growth steady. Inflation keeps creeping higher. Let’s go FED, raise the rates 50bps is a good start.
Wolf made it clear that capital gains were excluded from disposable income. It’s pretty reasonable to conclude that capital losses are also excluded from disposable income.
I also doubt the characterization of consumers as being in good shape, but that’s not the reason why I think that.
Since the average consumer is in good shape, is it possible the fed just lets the economy run hot and slowly burns down (real) debt with 3% inflation? That seems to be the plan, and gets lots of derision, but what if things aren’t catastrophic and it actually works?
Sure it’s possible. It’s the plan!
The problem is they’ll never really let it burn down the real dent, because they’ll just keep stacking on more debt since the world hasn’t ended at this level of debt/GDP. They’ll never really do anything about it until it’s obvious (to congress and the majority of constituents) and too late.
Inflation is a choice. As Bernanke admitted, the Fed could stop inflation in an instant if it wanted.
Just how do you think the Federal Reserve could do that?
Finally, yes inflation is deliberately caused by the US government and is much higher than they report. They never intend to stop it; it makes their debt worthless.
Auto loans’ seriously delinquent rate is at an all time high (balance) although the new seriously delinquent flow has stabilized in the last 2 years. Close to the same thing with credit cards, seriously delinquent rate is close to the record of the GFC, but flow into seriuously delinquent has stabilized in the last 2 years.
Does anyone have any insights on this?
“Auto loans’ seriously delinquent rate is at an all time high”
That’s completely wrong. You’re probably citing some braindead blogger that was looking at the NY Fed’s “Transition into delinquency rate” which is NOT a delinquency rate but an annual flow that some on-loan researcher over there concocted years ago and that the idiotic media and braindead bloggers mispresent as a “delinquency rate,” and that no one really knows what it represents.
1. Subprime auto loan delinquency is at all-time highs at around 6.8%, but subprime is only a small part of auto loans handled largely by subprime-specialized dealers and lenders, some of which blew up last year, which I covered here in detail (yellow line, Fitch).
Prime delinquency rate for auto loans is at 0.42%, which is historically low (blue line, Fitch).
Equifax publishes monthly data for overall auto loan delinquency rates, but only going back to 2020 (red line), but 2020 was the near-0% trough of the free-money pandemic. Delinquency rates before the pandemic were roughly where they’re now, and far higher during the Great Recession.
I discuss this extensively and in detail in my auto-loan articles. You need read them. Next one coming up in a few days.
Great time to be high income or high capital American!
Bad time to be a poor.
None of this is surprising.
Is there a good time to be poor??
You can see the data I’m referring to in the excel file of the report: https://www.newyorkfed.org/microeconomics/hhdc/background.html
Page 12 in the excel file.
read my f**king comment: “…the NY Fed’s “Transition into delinquency rate” which is NOT a delinquency rate but an annual flow that some on-loan researcher over there concocted years ago and that the idiotic media and braindead bloggers mispresent as a “delinquency rate,” and that no one really knows what it represents.
I give you the actual delinquency rates.
Again, the Fed does NOT only publish a “flow”, read the report. You can check the data dictionary for the definitions and what variables they publish: https://www.newyorkfed.org/medialibrary/interactives/householdcredit/data/pdf/data_dictionary_HHDC.pdf
You didn’t even read the document you linked, but you keep trolling my site with your ignorant BS. READ THE DOCUMENT YOU LINKED. It says toward the bottom, verbatim:
“New (seriously) delinquent balances and transition rates. New (seriously) delinquent balance reported in each loan category. For mortgages, this is based on the balance of each account at the time it enters (serious) delinquency, while for other loan types it is based on the net increase in the aggregate (seriously) delinquent balance for all accounts of that loan type belonging to an individual. Transition rates. The transition rate is the new (seriously) delinquent balance, expressed as a percent of the previous quarter’s balance that was not (seriously) delinquent.”
In other words: only mortgage delinquency rates are NOT transition rates but actual delinquency rates. The other categories — credit cards and auto loans — are expressed in transition rates.
Which is exactly what I told you at the beginning, and you’re still wasting my time with your BS.
Look, your ignorance is your problem. Your polluting your brain on the internet is your problem. Your laziness is your problem. But by trolling me with your ignorant BS, you’re making them my problem. Life is too short to waste it on your BS. Adios forevermore.
Why Buffett sitting on record cash then if consumers are in good shape? What is your explanation of this?
Hi Sam,
In my thirty-plus years in the oil patch I worked for literally dozens of different bosses. Your post reminded me of something the best one once told me:
“Never ask a question in a public unless you already know the answer.”
Buffett isn’t at all worried about consumers. He sees that stock prices are inflated out the wazoo and that there will be buying opportunities for those with cash after they come down a lot.
What do you explain also the record low consumer sentiment and low savings rate? If most people are thriving why the disconnect?
1. As I already mentioned in the comments here: Consumer sentiment surveys are BS. “… it’s split this way: Democrat-leaning consumers feeling shitty and Republican-leaning consumers feeling good, which totally flipped after the election, though Republican-leaning consumers lost a little of their euphoria recently. These consumer surveys are worthless as far as the economy is concerned. But they’re a gauge of political sentiment. Dig a little deeper into the numbers and you’ll see.”
2. The savings rate is positive, so people are earning more than they’re spending. That’s what that means.
3. The savings rate does not include the huge amounts of money consumers make in capital gains on stocks (60% own some stocks), homes (65% of households own their own home), etc.
4. The savings rate = 3.6%, it was lower before, and it was higher before, but it doesn’t include income from capital gains. Why save your salary, if your stock options are making you rich?
My guy. It’s literally the same answer Wolf gave above. If I could count on my hand how many articles over the years claim Buffet is once again sitting on record cash I would have a few thousand fingers.
Cuz stocks cost too much. He’s a growth and value investor. Think Costco, Coca Cola
Costco is a friggin $1020 a share, buffet wants it at $500. When Joe blow the Costco fan just got crushed in the next financial meltdown and needs cash, he sells to buffet who gets a 2 for 1 deal. Then in 6 years Costco is at $3000 a share.
Buffett sells and makes $2500 a share. Bingo bango.
He waits for the tide to go out (financial meltdown) to see who’s swimming naked (financially exposed).
Simple answer; he expects stocks to crash and wants to buy them at lower prices.
Do not rush The Great Vulture.
Just note him circling above. Waiting.
Just an FYI approximately about $180B of that is required for the insurance business to keep in cash. Still about $225B+ that is dry powder.
With the UM Consumer Sentiment Survey @ 49.8 in April 2026, this reading is lower than 2008 @ 55.3. This is without a doubt a bifurcated / K-Shaped economy. The top 40% or so are powering the economy forward. It’s just unbelievable that there aren’t more obvious signs of the economy buckling.
🤣 no, it’s split this way: Democrat-leaning consumers feeling shitty and Republican-leaning consumers feeling good, which totally flipped after the election, though Republican-leaning consumers lost a little of their euphoria resently. These consumer surveys are worthless as far as the economy is concerned. But they’re a gauge of political sentiment. Dig a little deeper into the numbers and you’ll see.
1) Most boomers and Gen X own mortgage homes, but 2025 grads cannot find a job.
2) After the 2005 bankruptcy act it’s hard to file chapters 7,11 and 13.
Before 90+ delinquency u can settle with the c/c banks for lower payments and extended terms. After 90+ days collection agencies will call u 5 times a day, threaten u with penalties, interest and prison to make a buck. After 90+ days u have to be reeducated: take a financial course with the good guys who will offer u a settlement with the banks.
3) If u wrote a $100K checks to your kid 90 days before filing BK it belongs to the estate, to be distributed between the creditors.
If u sold your $50K car to a friend or a kid for $25K 6 months before filing it’s a fraud. If u sold your house two years before filing with the intent to defraud, delay or hinder creditors, two years before bk it’s a crime under the federal law and longer under some states law. The proceeds will be distributed between the creditors and u can go to jail. 4) Europe and Asia are running out of jet fuel and oil. We supply them with oil, jet fuel and LNG. When those factories and data ctr will be ready millennials and zoomers, in a shrunken labor force, can find high paying jobs ==> pay student loans, get married and feed a family. Higher inflation deflates: cash, bonds, commercial RE, foreign stocks, mortgage free homes and gov debt.
“1) Most boomers and Gen X own mortgage homes, but 2025 grads cannot find a job”.
I think your second point is a supply-and-demand issue. I read somewhere that 2,167,569 people graduated from college in the US in 2025 with bachelor’s degrees.
I really doubt that the market needs and can absorb that many people who have both mismatched skill sets and no relevant work experience.
Yep. Don’t worry, considering other supply/demand dynamics, especially around food/energy, in the coming feudal system people will either be trillionaires or sharecroppers. Their will be considerable more of the latter, so people are about to get a lot of work experience…
Hedge accordingly.
“there” not “their” What the heck, is AI changing text? Pretty sure I wrote the former…
Kevin, do your job: lower rates to kickstart bank’s lending. The Y/Y PPI is only 6%. Stay put for 3/4 years to steepen the yield curve, to collect higher payroll and income taxes from millennials and zoomers and deflate gov debt with negative rates. The radical environmentalists and the radical libertarians are threatening the Fed.
I would rather him tell Congress to get their fiscal house in order. And it might not be a bad idea to raise the corporate tax rate a bit, say 25%. And while we’re at it, close a good handful of loopholes.
Corporate profits & their tax rates are inversely related. We could significantly close the budget deficit by going after waste, fraud and taking in a reasonable amount more in corporate taxes. In 2022, corporate taxes only accounted for 6.5% of all revenue which is crazy low. It should be three times that.
I know you’re a smart guy, Michael, but we’re not going to inflate out way out of this debt spiral. There’s no way that’s going to happen, especially with AI job loses looming in the next 3-5 years at most.
Exactly. The DEBT/GDP was about the same after WWII. At a minimum, the tax structure will need to be returned to the same scale. Politically unpopular, but necessary. It’s that or hyperinflation. None of this is personal, its just MATH.
Another good reason to own gold bars, coins or jewelry; you can give it to somebody before bankruptcy and nobody knows about it.
so us boomers do have mortgages, mine will disappear soon enough
though I’m looking at buying a couple more rentals(using the 1 payment plan of course)
our 25 year old just finished her masters and now works for banner hospital, other 28 year old is FINISHING his NEW HOME – paid cash for most of it and makes living wage(NO COLLEGE just trade skills) and 3rd is one of youngest finance managers for city – turned down budget manager position since its political(age 31)
did I mention that both college educated kids PAID FOR THEIR OWN SCHOOLING and have $0 student loan debt because they WORKED while going to school —- and NO WE DID NOT PAY for THEIR education other than they lived at home while attending
SO, the consumer is on solid footing. Time to raise those rates Mr. Warsh, if you don’t, Mr Market is going make you look like the corrupt idiot you really are…
Jump you f%$kers!
Everyone around me keeps telling me “the economy isn’t well”. This is all while the people I work with, my immediate family members, the extended family members I see on a weekly basis, and my neighbors are all making the most money they’ve ever made so far in their lives.
Spending hasn’t stopped. Neighbors next door, married couple with two kids in college, just upgraded two of their cars. Another neighbor, 74 year old living at home with his wife, both retired, just bought a Ford Ranger. Why? Just because he liked it. He doesn’t need it.
Neighbor across the street, 76 year old, retired, wife passed away about 3 years ago, just purchased a brand spanking new Mercedes S580. That’s his weekend car. Daily car is a Cadillac.
Went to brunch for mother’s day this past Sunday. All tables full, line to get in. Took a stroll down the shopping center after brunch. Stores are packed, sidewalks are full of people.
I mean the amount of money is relative.
Right now many people straight out of college in CO are making $90-100k. So like making $120k or $150k a year here doesn’t mean what it used to.
I make more money than I did back in 2018 (the peak of my earnings before I changed careers), however back then I was in the top 5-10% of earners state wide. Now making $50k more than back then I’m only in the top 20% and am poorer.
That’s inflation.
Correct, hence the widening wealth gap, as the “poverty line” increases and those below it fall into the “indentured servant” category or homeless etc. Allowing bad corporations to actually fail with deflation of their assets fixes this. Unfortunately, the bankers and financiers will do anything, and I do mean anything, to prevent deflation. These people are closest to the printer and have vast sums of paper wealth, so it makes sense. But think about that for a second, currency is created in an instant, with minimal work. How hard does the average person have to actually labor (work) for their currency? The things everyone absolutely needs to survive require real work and energy to produce, yet we allow ourselves to be slaves to a regime of monetary /financial system that few have access to and a currency requires no real work to call into existence. The slip back to feudalism should come as no surprise, not should the disconnect between Wall Street, government, and the real economy.
I mean that was also the case in late 2007 and most of 2008. I had 2 uncles who were very pro America who would call any negative news about the economy fake news and cite that as an example the economy was fine.
I’m not suggesting the rumblings in the economy are fake news. Just providing perspective which is what is all about on this site, at least for me.
The charts show households are in great financial condition despite the rumblings. I would agree based on what I see around me.
@Wolf I’m curious what would these charts looks like if the top 15% and bottom 15% of earners were removed?
It’s hard to tell from aggregate data and we know the upper part of the K is doing great. Also the lower part is always struggling.
1. Much of the top 15% in terms of disposable income are already removed because disposable income does not include capital gains, and capital gains is where people with money make most of their money. They also have the most debt because borrowing against your assets, instead of selling them, is a huge tax savings strategy.
2. Poor people (bottom 15%) have hardly any debt at all because they don’t qualify for it. Most of the debt is with high-income people because that’s where the money is. Why is that so hard to gasp? Do you think a minimum wage worker can get a $3 million mortgage?
3. Why the F**K does it even matter??? This is about the overall economy, and everyone is in that economy. If you want to shed tears about the poor, go to a social justice warrior blog.
I have posted this answer about a million times.
This is a similar sentiment to “it works until it doesn’t”
Yes, debt and inflation and social inequality can work for a long time.
Not forever, Wolf.
@Wolf
What actually happens to the 90+ non-dischargeable student debt?
Never ending balance accumulation appears to be the case, with a default notice issued after 270days and then entry into an immediate (court not required) garnishment etc. procedure per llm land. Yikes!
For regular debt, the recovery rate is very low once 90+ days is hit, but at least there is a well known mechanism and path for people to take the significant hit and look to re-build.
Do the people who own multiple 4 or 5 homes outright skew the 65% of people who own their homes?
No, that’s not how that is measured. The definition is of households that own the home they LIVE IN. And 65% of households own the home they LIVE IN.
Wolf,
Thanks as always for your objective insight into the consumer debt issue as opposed to the brain-dead clickbait stuff we get elsewhere. This alone is worth my annual subscription / donation.
@wolf Ive been reading your articles for a long time and love the content, but have never commented. I would be interested to see how these charts play out demographically by age group and could imagine the story that would tell would be interesting in itself… as will the comments from people who don’t understand “person A has had 20 years longer to build assets and equity compared to person B”.
So thanks for reading my articles “for a long time,” and reading the comments, so you know what RTGDFA means, it’s what you should do before you comment 🤣🤣🤣
All this data here is HOUSEHOLDS. A household is defined as whoever lives at this address, whether single or three-generation family. So your suggestion that the data “by age group” would yada-yada-yada is just BS because this is household data not individual data.
Better raise those rates Mr. Warsh!!!
LOL!
Jump you f$&kers!
I’m not sure that I would characterize consumers as in good shape with those debt-to-disposable-income ratios.
The primary reason why I think this is simple: consumers typically have few sources of income, typically their jobs. If they lose their jobs, then they will default or be forced to sell off assets to clear their debts. A debt to income ratio of 70-80% is still too high for consumers to comfortably be able to pay off their debts by selling assets, particularly when asset prices come back down to earth. Consumers can’t simply cut expenses as deeply as a corporation or government can, for instance, because a good portion of those expenses are necessary for them to live.
Corporations and governments have options to save cash far above and beyond what an average consumer can. They can cut jobs. They can reduce wages or other benefits. They can slash other expenses. They can raise prices or raise taxes. A corporate debt crisis or a government debt crisis will become a consumer debt crisis in short order because of this, and indeed will be much harder on consumers than on corporations or government.
This isn’t to say that corporations and governments are in good shape (because they’re not), but simply comparing the debt to income ratio doesn’t capture the full story of the dynamics of the debt, and therefore consumers are in far more vulnerable positions with far less debt to income than corporations or governments are. I wouldn’t say that American consumers are in good financial shape until their debt-to-disposable-income ratios are less than half of what it is now.
I think we’re all so used to major turmoil that leveling out is just boring. YAWN but it’s not gang busters and it’s not in the toilet so we’re just reaching for anecdotal reasons for ours and our neighbors personal circumstances. Food will get more expensive in this country and some others but honestly – just grow some of your own and eat a little less. The pyramid scheme of every major economy is going through the throws of reaching towards balance. America still has a lot going in it’s favor. Media influence is nauseating at this point. I wish Gen A would grab a couple hundred wheel chairs and roll into the halls of Congress and demand that anyone 62 or older sit down and get out – they are useless in shaping any corner of this economy that will work well for the future. Change is inevitable and it’s moving at a speed that few can navigate. Balance is boring but I’m up for it.