
Trend reversal started a year ago. Services inflation stuck at high rate for a year. Now prices of food, energy, computers & software (inflationary AI boom), and gold jewelry (gold price spike) all surged.
By Wolf Richter for WOLF STREET.
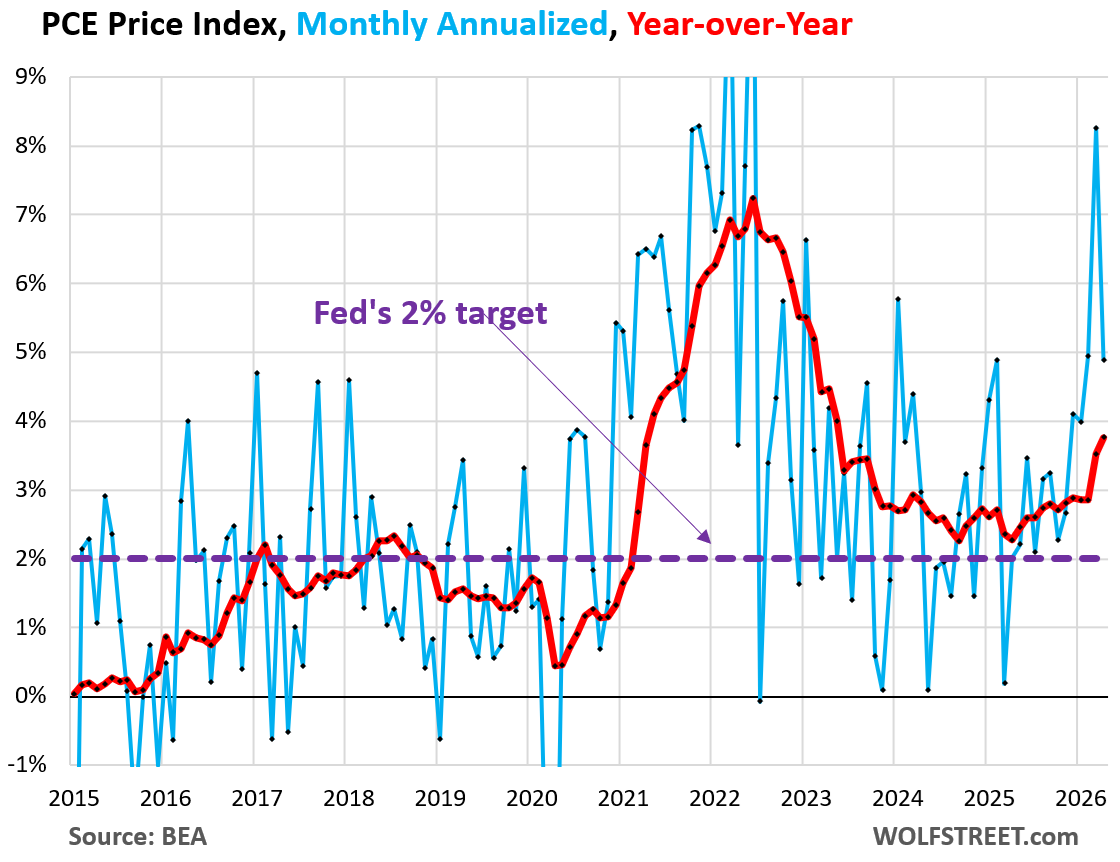
The all-items PCE price index jumped by 0.40% in April from March (+4.9% annualized), on top of the 0.66% spike (8.3% annualized) in the prior month, which had been the worst spike since mid-2022 (blue line in the chart below). Year-over-year, the PCE price index jumped by 3.8%, the worst since May 2023 (red line).
This all-items PCE price index is the yardstick the Fed favors for its 2% inflation target (dotted purple line). And at 3.8%, it is now nearly double the target of 2%, and has been moving away from it since May 2025, with big month-to-month price surges in December, January, and February, before the war and before the energy price spike. The energy price spike came on top of it in March and April.
Food prices have begun to surge. The AI boom is driving up prices of semiconductors, and thereby of computers. Software subscription prices are surging because providers (Microsoft, Alphabet, et al.) have increased their prices after including AI into the package. So far, AI has been inflationary. And services inflation has been stuck at a high rate for an entire year without any improvement.
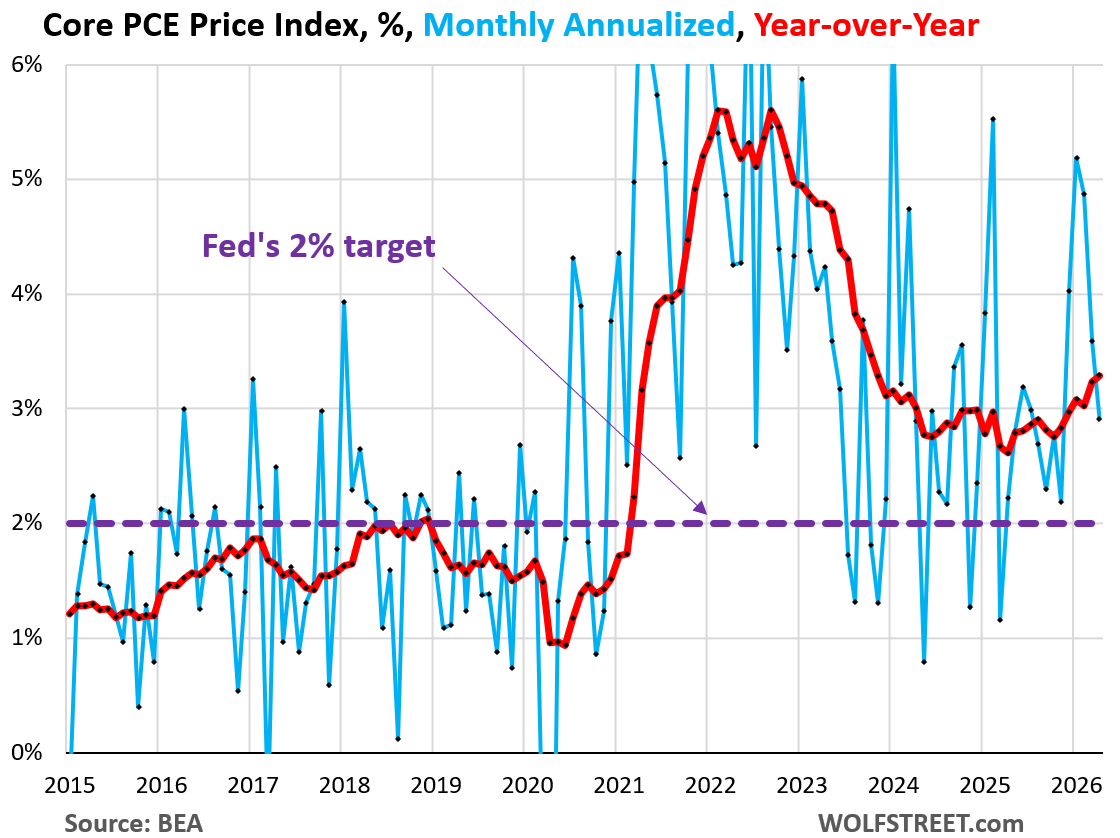
The core PCE price index, which excludes energy and food, rose by 0.24% in April from March, or +2.9% annualized, after four months in a row of 3.6% to 5.2% annualized increases (blue in the chart below).
The year-over-year core PCE price index rose by 3.3%, the worst since November 2023 (red in the chart).
The Fed’s target for this core PCE inflation measure is 2.0% (dotted purple line). And being a “core” measure, it does not include the gasoline price spike and the now surging food prices.
Core PCE inflation never even got close to the Fed’s 2% target, but bottomed out at 2.6% in April 2025 and has been moving away from the target ever since. It has been above target for over five years as well.

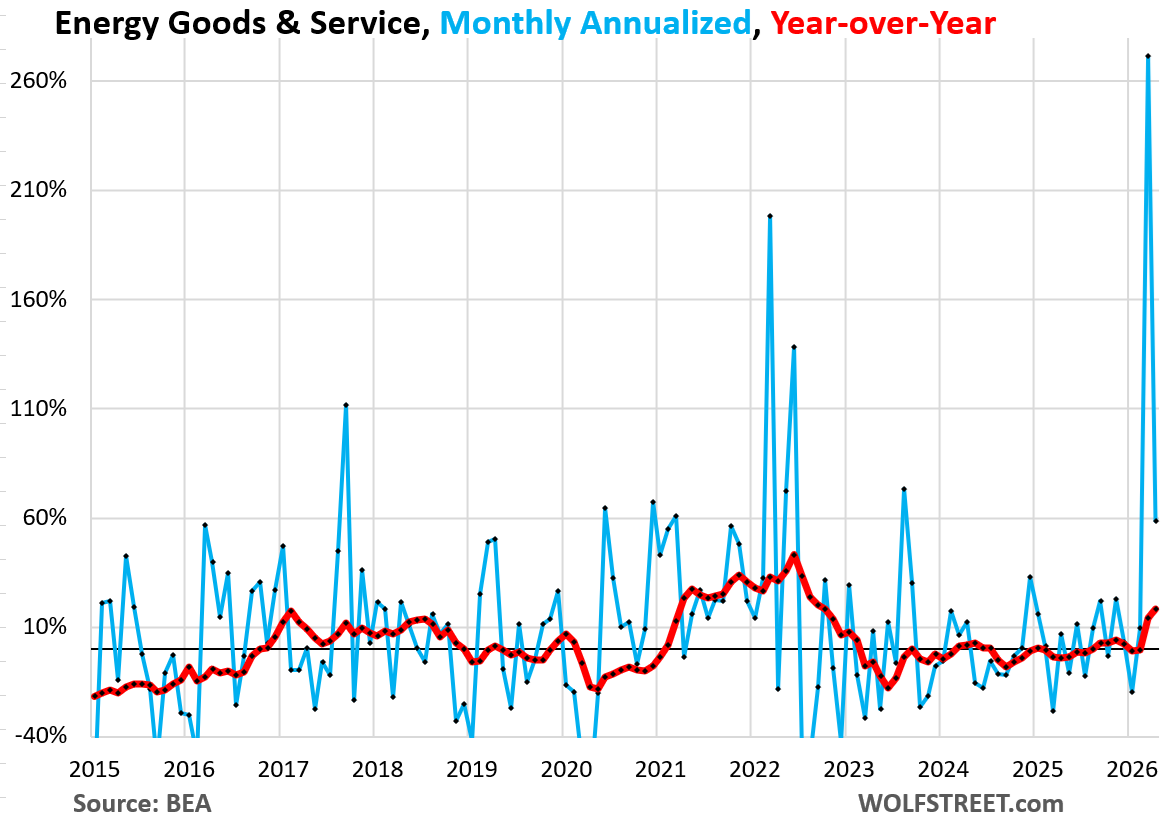
The energy PCE price index jumped by 3.9% in April from March on top of the historic 11.6% spike in the prior month.
This pushed the year-over-year increase to +18.3%, up from a negative reading in February.
The US is the largest crude oil and petroleum products producer in the world, a large exporter of crude oil and petroleum products, including gasoline and diesel, and gets very little crude oil from the Strait of Hormuz and doesn’t need any of it. Gasoline prices started spiking in March though the gas in the tanks at gas stations or at refineries or in transit had been purchased earlier at the low prices that had prevailed at the time, and that price spike went straight to profit margins of gasoline retailers, refiners, and oil companies, at the expense of consumers. This is what inflation is all about: companies jack up prices because they can (“pricing power”).
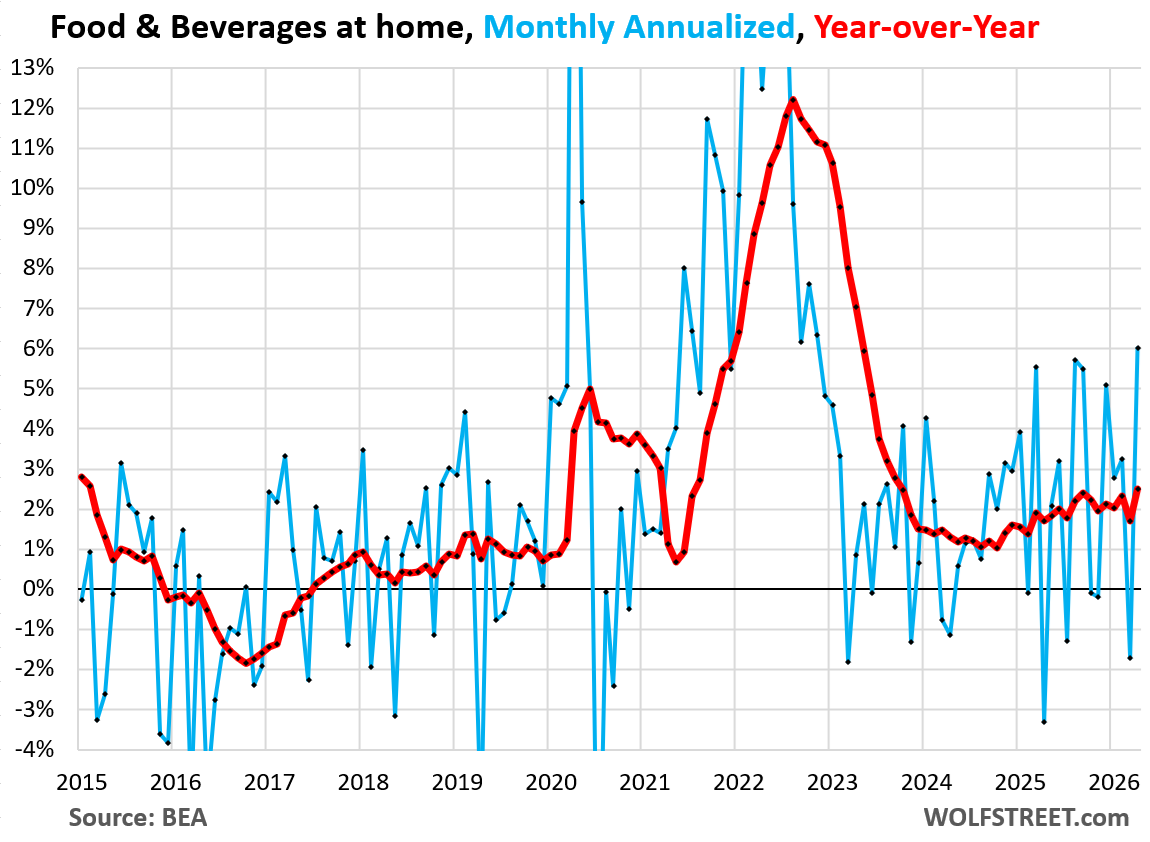
Food prices jumped by 0.49% in April from March (+6.0% annualized).
This pushed the year-over-year increase to +2.5%, the worst increase since September 2023 (red). My charts for prices of beef, chicken, eggs, coffee, dairy, fruit & veggies, and other foods are here.
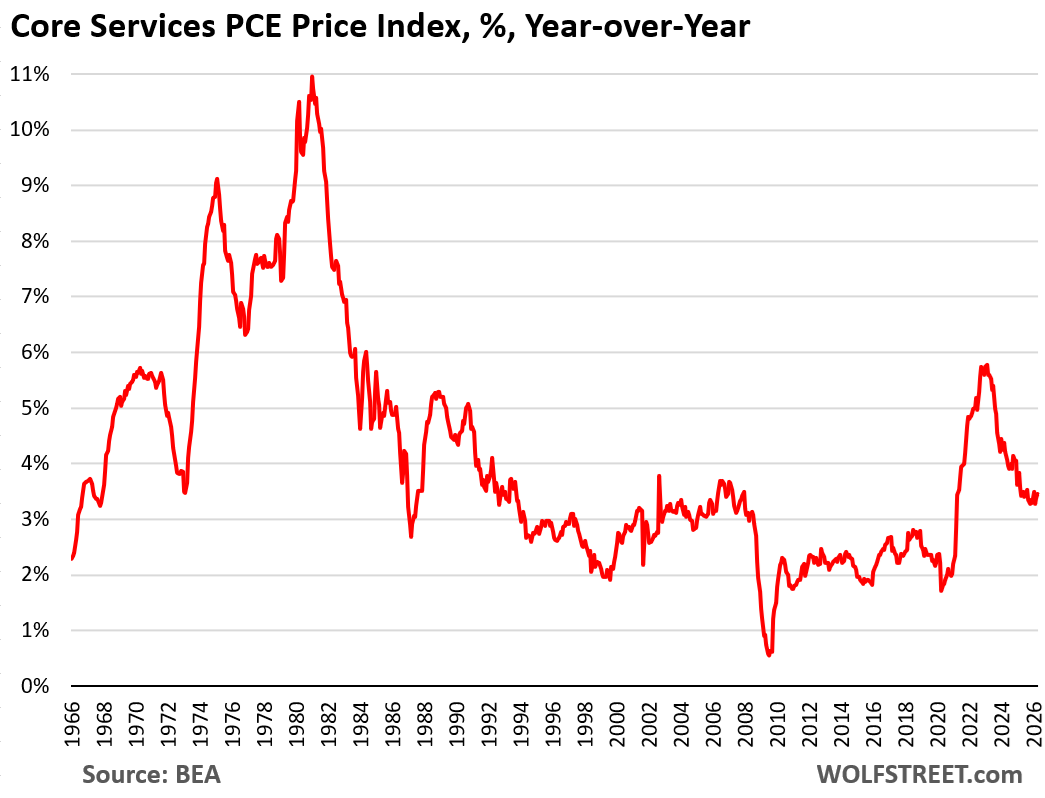
Core services, which account for about 60% of the PCE price index, rose by 0.22% in April from March (+2.7% annualized).
Year-over-year, it rose by 3.5% and has been in this range for an entire year without any improvement.
Core services are where inflation has been consistently high for the past year, after coming down from the surge in 2021 through early 2023. To give a historic perspective on this level of services inflation, here is the 60-year chart.
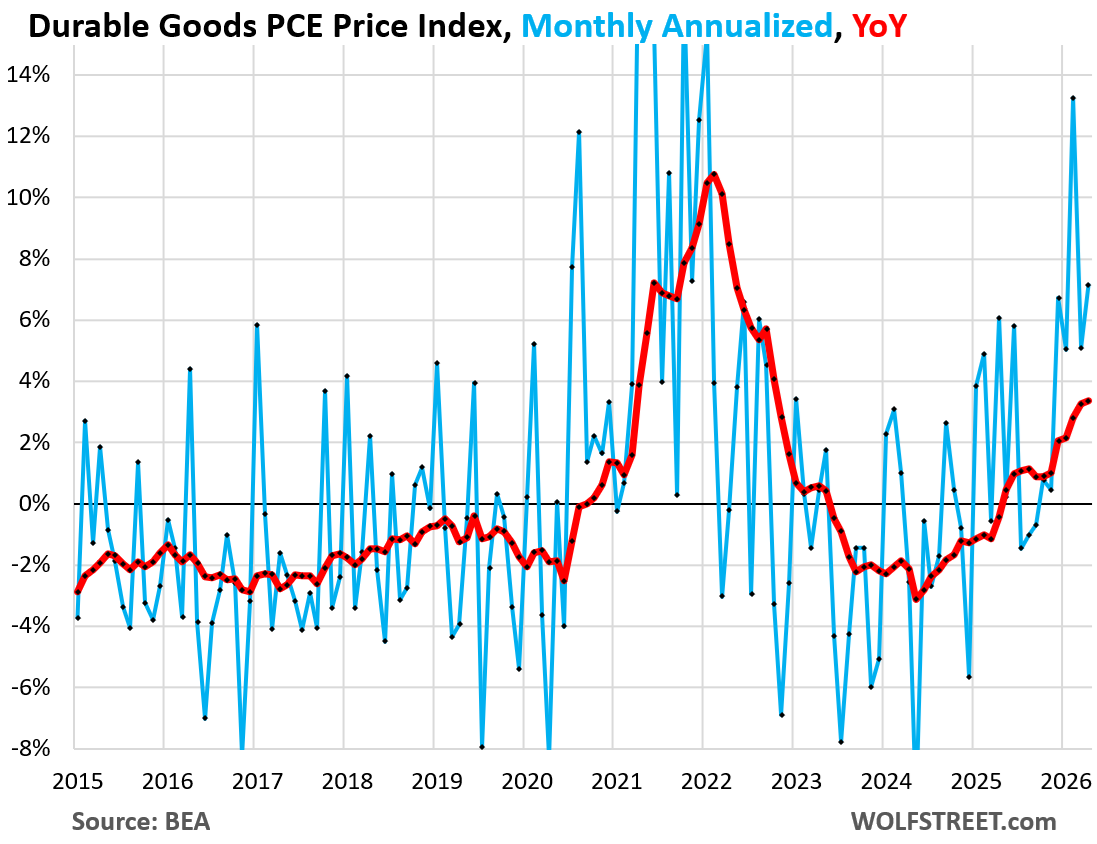
Durable goods prices jumped month to month by 0.58% (+7.2% annualized), driven by massive spikes in prices of:
- Computers and software (+3.7% month to month not annualized) due to the spike in chip prices and software subscriptions, thank you inflationary AI boom;
- Jewelry prices (+3.7% month to month not annualized) as the earlier price spike of gold gets passed on step by step.
Many major categories had month-to-month declines, were unchanged, or had only small increases: Motor vehicles & parts (-0.1%); Sporting equipment, supplies, guns, ammo (-0.4%); Furniture and Furnishings (-0.3%); recreational books (-2.9%, dropped to 2019 price level); Appliances (unchanged); Motorcycles (unchanged); Phone & related communication equipment (+0.2% but -13% year-over-year).
Year-over-year, the PCE price index for durable goods rose by 3.4%, the worst since October 2022, having accelerated now for two years.
Enjoy reading WOLF STREET and want to support it? You can donate. I appreciate it immensely. Click on the mug to find out how:


so as soon as they started cutting, the predictable occurred. inflation flattened and started rising. this is why some folks were against cuts at that point; even though things appeared to be heading in the right direction. inflation had not been snuffed out yet.
how about next time it heads down “toward” 2%, waiting til it actually reaches or goes below 2% before cut
The thing is though, it’s not so predictable and the Fed has a long-term view. For years after the GFC, longer than the post-covid inflation, there was a problem getting inflation UP to the 2% target. See Kashkari’s 2017 Medium post “My Take on Inflation”.
Helicopter money and negative interest rates, and most frightening of all, Japan’s endless stagnation to the point of GDP PPP per Capita parity with Spain, is the real monster under the bed for the Fed. They all know they have the option to pull a Volker to bring inflation down, but the restarting of the stove once the flame is out is not so straightforward or any less dangerous socially.
But they didn’t need to go all-out Volker. They could simply not cut as much or as fast, especially when they saw inflation rise again.
Yeah, that 50 BP cut right before the election was both politically questionable and it seems to have been indicative of the Fed overcutting.
I wonder how constrained data center spending would be if the FFR was at 4.75%?
It was a reasonable choice given the numbers at the time, though I personally believe they could have waited a bit longer.
Not so predictable… long term view.
I question both of these premises.
Mainstreet seems to be well aware of the “inflation genie” phenomenon: it’s hard to get back in the bottle.
A historical (hysterical?) evaluation of the Fed suggests more a “rear view mirror” type driving. They have been navigating away from the last depression, for almost 100 years.
They are notorious for managing yesterday’s crisis, or turning a hyped up headline into the next one (see: transitory, and COVID).
I understand that each cycle, bubble and imbalanced budget presents a new look. I also understand that there are systems of systems that are made to rob the voters and make their handlers wealthy and comfortable.
The Fed has a uniquely unbridled and devastatingly unchecked position. Even publicly “elected” officials have not been representative of the people’s desires, since “ever”?
There is NO “2% target” in the Fed’s legal mandate.
They made that up.
They created the entire “inflation is too low” problem by believing that 2% inflation was a reasonable goal, instead of stable prices.
They “solved” the fake “inflation is too low” problem by creating too much credit and forcing interest rates below all historical precedents.
Now we face the consequences – inflation is far too high, and neither those who are in debt, nor those who own that debt, want to face the necessary pain.
We would have been much better off allowing inflation to float around 0-1% as it was, and managing the growth of the money supply to be consistent with long-term economic growth prospects … which IS the actual legal mandate of the Fed. (I pasted it in down thread.)
The Fed has now had 5 years of inflation above its bogus 2% target and you want to somehow give them credit for looking at the long term? First, they bought MBS for more than a year during the pandemic without any decrease in home prices, in fact, while home prices were rocketing. Then they gaslit the entire country for more than a year with near zero percent rates while inflation cooked at 8%+. Then they cut rates a full point while inflation was well above their bogus target, and now they sit on their hands while inflation is roaring higher for the last 12 months. Anyone else with this track record would be out on their a$$.
A year into the pandemic no one could be confident in how mild it ultimately was, whether more disruptive variants would emerge, etc. I’m sure the Fed would swallow higher mortgage rates and inflation vs not having tools for if a sharp global downturn occurred.
Debt bomb. Can’t raise rates because interest on debt is high. Legislature needs to cut spending and begin balancing the books.
Whether you like tariffs or not, it was a small effort (likely) to curb spending.
Rates are going up whether the FED likes it or not.
Including the FED Funds rate.
C
The cost of borrowing has to be at a level that curtails the activity.
Volker did it.
The Bernanke, Yellen, Powell triumvirate didnt have the “stones” to make this happen.
Congress has embraced the “small integer game” in which adding a number after the decimal on a billion dollar bill is not fully considered. ( ie $100 Million for each numerical increment)
A now we have suggestions of a $250 bill…….with a living person on the bill! Right after the demise of the penny.
And some say the Fed had trouble for years getting inflation up to 2%,
Who complained about that?
When things seem weird and non sequitar, one must reexamine the assumptions….and the first one that leaps to mind is ..
“Is the Fed really fighting inflation?” For the charts demonstrate otherwise.
Today’s current rates make interest payments higher than defense spending. Volcker did it when debt to dgp was in the 60s today it is over 120%! You’re right that they’re not fighting inflation rather kicking the can. Legislation is where spending lies. 2T deficits are the norm now. Let that sink in.
C wrote: “Legislature needs to cut spending and begin balancing the books.”
Nope. The legislature needs to start taxing the super rich at the same rates they were taxed back in the 1950’s.
No more of this “tax cuts for Billionaires solves everything” shuck n jive.
Tax success they say. Then investment slows down. Most that have millions don’t actually collect millions. I’ll level with you with using stocks as leverage to get loans.
Debt doom spiral unless we do not just cut. The solution: tax Cook Island and other foreign trust distributions, unsecured loans obtained by trust beneficiaries (to evade taxes), stock buybacks (to raise stock values instead of paying dividends which are taxable), and any benefits given by (trust controlled) companies to these trust fund babies. Estimates are they have evaded income taxation for many decades on over $100 trillions ($55 trillion British pounds, originally) via these PERPETUAL trusts– forbidden by US Laws.
Grump that’s kind of one dimensional thinking. It’s tons of factors.
Tariffs
Gov spending
Consumer spending , the K folks who no matter what say F everyone and these high prices I’m buying a corvette. If they stood on the picket lines with the broke people. The corvette price would go down.
Oil prices
Wars happening
Nativism happening
Welfare happening
Corporations raising prices
List goes on and on
Yeah, I might be wrong. But I could argue that all this recession avoidance/embracing inflation instead is 100 percent short term thinking.
Like recessions are temporary, and while they suck, the recovery is awesome.
Inflation as a means of enabling government largesse isn’t temporary and isn’t painless.
Wondering how the Fed Board will contort itself into a pretzel at its next meeting to justify not raising rates. This situation is bad and getting worse for non-plutocrats.
It’ll go like.
“We need to wait and see”
Or if they lower rates,
“The inflation we’re seeing is from something else”.
The stock market goes crazy for that one!
No cuts on the way because the memorandum of understanding will open the Strait of Hormuz. Markets will rally to infinity, inflation will fall to near zero followed by negative interest rates. Here’s to mania.
AI hallucination?
I’m going to start using the phrase “AI hallucination” to refer to people hallucinating *about* AI and its imaginary capabilities
I think the people most using AI are those most suffering from “Real Lack of Intelligence” or RLOI. I went to register the URL, but sadly, it is already taken.
Don’t get me wrong, there are certainly applications for AI. But, just like Elon Musk selling “full self-driving” cars ten years ago, the reality will never live up to the hype within the promised timeframe.
Greg, you’re really behind the times on this. Elon is a quack, but self driving is not a hoax. I regularly visit my family in Austin, Texas and about 25% of vehicles on the road are autonomous, from multiple providers, today.
The timelines might be off a bit, but AI will be AT LEAST as transformative as the Internet, and has a double-digit chance of being more important than foundational technologies like electrification, in our lifetimes.
To Willie McD,
You claim the 25% of the cars on the road in Austin TX are autonomous.
Really.
Have you gone insane ?
Austin has slightly less tha 2 million cars.
About 125 of those are autonomous.
Just another math illiterate tech geek.
AI can do some things very well. I use it every single day, but I don’t use it for business. I used it for gathering information. In time I think it will eliminate a lot of jobs. I’ve animated paintings and even wrote a song that was pretty good. It was called “Tariff King” and the lyrics were describing Donald Trump. I’ve never seen AI make a grammatical mistake. It will affect writers, lawyers who write motions and briefs for a living because one lawyer can do the work of 3 lawyers. AI is running customer service in some companies, and I got a call from a real estate agent about selling my house. There was a lot of back and forth and the agent was very responsive to my replies and questions. When I asked what the home market was like where that real estate agent was located, she said, “I’m sorry, but I don’t have a home.” I felt sorry for her, but then she said, “I’m a virtual assistant.” I was really fooled. I thought I was talking to a live person….her voice was great. She seemed very concerned. When the AI people figure out how to automate truck driving, taxis, Uber, etc., millions of driver jobs will be lost. Driverless big trucks are on the road in Texas now. America is on the cusp of insolvency with almost $40 trillion of federal debt. Interest costs on that debt will be $1.3 trillion this year, and we’ll borrow every dime of that and more. CBO projects a $60 trillion federal debt within 10 years. I’d like to know what’s going to happen to the tax base because everything that can be automated, will be automated. There’s a lot of anxiety out there as prices rise for real estate tax, insurance, medical care, cars, houses, condos, you name it.
@William McDonald I don’t live in Austin, so I can’t comment. However I will say that I know of what I speak when I tell you Elon Musk was claiming (and charging for) full self-driving on new 2016 Model S vehicles… which NEVER happened. I own a Model S and Model X, and my Model X won’t even open its rear gullwing doors if it “senses” that it is in a garage – regardless of the height of the garage ceiling or proximity to obstacles. Tesla has simply discontinued both models – after making claims for years that never materialized. AI is the same. Promises that will never materialize – because it is physically impossible for them to materialize – and certainly never within the promised timeline – blowing all valuations based on the time value of money out the window.
William McDonald says “25% of cars are fully self driving.”
Giggles AI result says:
Currently, the percentage of fully self-driving cars (Level 4 and Level 5 autonomy) on the road is effectively 0%. There are no certified, fully autonomous consumer vehicles available for purchase. Driverless technology is primarily limited to localized commercial robotaxi fleets and pilot programs
I will place my bets on significantly LESS than 25%, and at least slightly over 0% (I have heard of Waymo).
I think Greg’s point stands. The hype is, by definition, not the realistic target.
Oh you mean drinking the Kool Aid
I am describing the downtown Austin core of about 25 sqkm. You cannot be in this area and not have an autonomous vehicles, usually multiple, usually from many different providers, at any given moment. Yes this is the densest area on the country, but I’m telling you, it’s not fake, it’s not going to take 50 years to be ubiquitous.
If AI was successful in ONLY deploying autonomous driving over the next 10-20 years, it would justify the data center investment being made now.
Haha. Just delirious from the market Kool Aid.
👏👏👏👏👏
It is interesting to view the “Top Performers” in the NASDAQ each day. Today a company increased 199%. It only has 827,000 shares that are public float, but today over 149,000,000 shares were traded. Think about all the buying and selling there.
Meanwhile, Dell is up 39% after hours…adding $77 billion to its market cap in one evening.
Remember when dells were sold in malls with high pressure sales tactics?
Like you’d be walking to the food court for a chick Fila and some young punk wanted you to finance a 2k black dumb Dell computer.
Seems like a lose/lose for Fed. Raise rates and of course negative consequences for debt and economy and other things. Don’t raise rates and just another set of problems including bond market.
How can bringing down and snuffing out inflation be a bad thing for the economy?
Like the best economic times over my adult lifetime included low inflation.
Sometimes I think I must be taking crazy pills.
It’s not. My point is if you raise interest rates to do so there is a lot of very bad potential consequences as well. Higher cost of debt for government and businesses and individuals with of course the possibility of stock market suffering as people move to guaranteed return versus potential risk of steep downturn in stocks.
You might snuff out inflation but you might also trigger a recession.
Obviously a lot of long term solutions but not exactly how our country rolls.
Just glad not my job
The market says it’s nothing to worry about. VIX way down. Just today a lot stocks that are losing money, are way up, like Snowflake and Unusual Machines. FED will be cutting rates, all is good.
They’re not going to cut in this environment. Every single Fed speaker has said that by now. Quite a few have said they’re open to rate hikes if inflation doesn’t improve asap.
Agreed, but by the market reaction today seems to “looking through” as they say, all the current warning signs and be predicting all will be OK in a few months, including the war. I wish I wasn’t so “logical”, I’d be making a lot of money in the market. I have to ask myself, is it better to look at the facts or just trust that everything will be OK and stocks only go up.
The Treasury market sees multiple rate hikes.
Yeah. But it only takes the markets a couple sessions to correct, thankfully.
In order to diversify today, it seems we need a mix of investments including some speculative momentum stocks. Of course this makes no sense from a fundamental standpoint, but when the Fed is active in markets the fundamentals can be suppressed for decades, beyond one’s investment horizon.
I bought some BB a few weeks ago and made 80% already. The “market” is a Fed created Frankenstein.
The problem with “Fed speakers” is that when they short circuit you can’t return the f**ckers to the manufacturer….who is probably operating the manufacturing plant out in China anyways.
” if inflation doesn’t improve asap”
ASAP?
Dec 2026?
2027?
2028?
No matter what they say, these guys are going to have to be dragged, kicking and screaming, to raise rates, especially the new fellow who’s been put there to lower rates.
In the final analysis, the FEDites are gonna look after their own skins first of all.
As we’ve discussed here many times, the Fed does not want to trigger a recession, and given the fiscal situation, a recession would be a real problem. The Fed is on board with letting the economy run hot because that’s what the government and the Fed see as the least painful solution to the fiscal crisis. So it looks like that Fed felt good about 3% inflation, but doesn’t want it to go over 4%, and doesn’t want it to go much below 3%. They started cutting when it went below 3%, and now they’re talking about hiking as it’s heading toward 4%. That’s the deal.
If that’s the case, then they should officially announce that the target is 3% instead of pretending it’s 2%
Secretary of the Treasury has a solution to the whole inflation problem. The Treasury is proposing a new $250 bill with President Trump on it. This needs legislation so a living person can appear on the money and the administration is pursuing that legislation now. This fixes the money going down in value as this $250 bill will be the new $100; and with the penny gone, the way is clear for a $1,000 bill to be the new $100 and everything jumping one magnitude.
$250 is nada. The US used to have a $1,000 bill, but it was discontinued in the 1930s. Those that are still around are still legal tender, but they’re worth more as collector’s items.
Never try paying with an old $100 at a grocery store. The befuddled cashier will hold up the line looking for a non existent water mark.
Most people use credit or debit cards. Even though Trump’s likeness won’t be on a $250 because the law prevents it and security features take years to design, it’s just dumb news meant to upset people. I have a National Parks Pass with Trump on it and George Washington which I think makes no sense at all, but it sits in my car upside down. Out to sight out of mind. I’ve got bigger things to worry.
Cash is going extinct. People don’t know how to make change or handle money at all.
Big bills have their place, but we don’t make very good ones in the US.
If you want to put some real cash in your pocket I recommend the Swiss 1,000 franc note. $1 million worth makes a stack 6 inches tall and it only weighs ~2 pounds. Compare that to ~20 pounds and 3 and 1/2 feet when denominated in $100 bills. The $250s would be a lot easier to smuggle, no matter who they put on the front.
Dangit shoulda gotten Jpow to break my 1000 dollar bill, not sure this new guy would give me correct change.
My son just started working for Snowflake about two months ago.
Not sure about the losing money part. They’ve beat their estimated earnings the last 4 quarters.
In January, they reported a gross profit margin of 70%.
(Airvots) Portable Air Conditioner Stand Up Room Cooler Indoor AC Unit ( Windowless ) for Bedroom, Home & Office. $169
Wolf are these guys legit. Maybe pulling the trigger to get one for the wife menopause and upstairs holding heat in Colorado summer before bedtime. Please disregard if the advertisement is not associated with your page.
WolfReviews
Swamp coolers exist.
It will work if you run a dehumidifier in the same room. I mean, it will not not work.
Drunken Swamp Coolers
As others said, this has to be a swamp cooler, deceptively advertised as A/C. I recommend you pay a little more for a real window unit A/C. I’ve had great luck with Frigidaire, the smaller ones that can plug into a standard 15-amp outlet. I’m in the South and have central units, and some folks think I’m funny for having the window units too, but they are great for when:
– My wife has a hot flash and needs to cool a room in a hurry.
– The central unit craps out and I’m awaiting repair.
– Power is out and I can run the window unit off a generator.
In your neck of the woods, an attic fan would serve the purpose as well, but that would be more hassle.
Ironically, they probably could have been MORE aggressive in cuts before and still avoided a recession. Now they’ve put themselves in a little worse of a spot, with fewer options.
To a point. The bond market is already pricing in rate increases… whether the Fed takes them or not.
Thanks WR for these reports.
I have learnt a lot from your articles.
This is my understanding:
No matter how much the inflation goes up or increases, FED would never do anything to dent the asset markets of all kinds.
If FED is really serious, they’d have tamed this inflation which is way above their target for last 5 or so years.
As we’ve discussed here many times, the Fed does not want to trigger a recession, and given the fiscal situation, a recession would be a real problem. The Fed is on board with letting the economy run hot because that’s what the government and the Fed see as the least painful solution to the fiscal crisis. So it looks like that Fed felt good about 3% inflation, but doesn’t want it to go over 4%, and doesn’t want it to go much below 3%. They started cutting when it went below 3%, and now they’re talking about hiking as it’s heading toward 4%. That’s the deal.
2% is an arbitrary number some Australian pulled out his ass.
3% was considered too high but now perfectly acceptable.
who is to say that 4% won’t be considered just as palatable as 3% in a few month?
Thanks WR
Fed target rate is 2 percent but they implicitly moved it up to 3 percent because they felt good about 3 percent
What is stopping them to feel good about 4 percent in the near future .
They have means to control bond market since they own the printing press
Powell will go down in history with the worst Fed Chairs like Burns and Miller. what he did with rates seems like criminal insanity…………what is the median age of first time home buyers now, late 30s.
Powell is the worst FED chair in history, worse than Burns. He is an absolute DISGRACE. Bernanke is in the running, too, but Powell did more damage than perhaps any FED chair ever has.
Totally agree. With financial condition being so loose and Wall Street greed reaching the stratosphere, the Fed just stands by and does nothing. At the very minimum they should be doing QT. This is criminal.
He was the most dishonest Fed chair, continually touting a 2% inflation target while seeking 3-4%. Either that, or he was not competent in pursuing the mandate.
You’re never gonna like anybody here on out Depth. Lol!
Greenie and Bernanke were arguably worse than Powell because they were the architects of the Fed “grift” policies. I say that because they were far more ruthless towards the poor and middle class having crafted and set in motion the grift machine we now see. Powell was the clean up boy.
Powell has been proven to be the best fed chair for the rich and people who owns assets .
thanks wolf
PNC bank today is offering 5 month CD’s at 3.25%. When the Fed raises rates as I expect look for that rate to go up to 4%.
SC, my credit union is offering 3.84% 9 month CD. Been on hold on that rate and duration since January.
Mountains America credit Union is offering 4.2 APR on a 2-year CD.
Looking forward to a hefty rate increase to my I-Bonds purchased in 2000 and 2001.
Interest on national debt eating record 19% of federal revenue…
Feds Spend $5M to Coat Horse Statues in Gold…
Wolf any thoughts on how this will impact Canada we are so intertwined economically. FYI in case you are unaware BoC press conference sheepishly or reluctantly telling the media that many large hedge funds are saying that they “could cause several vulnerabilities to crystalize at once” … this reminds me of the UK GILT crisis and I believe Carney was the lead “miss” advisor on that.
Brief concerning presser release:
Here’s a reminder of the Fed’s actual legal mandate:
12 USC 225a: … the FOMC “SHALL maintain long run growth of the monetary and credit aggregates commensurate with the economy’s long run potential to increase production, SO AS to promote effectively the goals of maximum employment, stable prices and moderate long term interest rates.”
Note that the actual legal mandate is the “shall” part: credit supply growth commensurate with long term production growth.
I believe the Fed has failed on that mandate, credit was allowed to grow too fast. Three consequences were that
(1) long term interest rates undershot for many years,
(2) asset prices inflated into historically unprecedented wealth inequality, and
(3) consumer and housing inflation surged past any rational interpretation of “stable prices”.
Bonus: the term “stable prices” is much broader than “stable consumer prices”. Imagine a Fed that understood how to actually manage credit growth, so that rates stayed moderate… such a Fed would surely have done more to mitigate both the 2008 real estate bubble/crash and the 3 colossal stock market price bubbles of the past 30 years…
The error occurred in the early 60’s with the influx of Keynesian economists at the FED. They sought and succeeded in confusing money with liquid assets. Citicorp’s Walter Wriston led the way.
The FED has never applied double-entry bookkeeping on a national scale. They don’t know where money comes from let alone how it impacts the economy. MSB balances prior to 1980 are a prime example, as are MMMFs today.
This is what raising Reg. Q ceilings did:
WTF Happened In 1971?
Inflation has been going sideways for more than year now. We need to see how what Warsh says and does. Will Warsh even do the Press conference after June meeting is big question. Will FED stop doing SEP for 4 meetings? For Rate he has only one vote. But as Chair, he can stop SEP and Press conference right from June.
Time will tell if Warsh will stay true to his inflation hawkish speeches and stance. Start QT again and start reduction in balance sheet. Even in small quantities QT is good message to begin he is serious.
Right now the Fed BS is increasing by $20-40B a month. So reversing that to say $30B a month in QT would be a strong statement and might start popping some bubbles.
Sandeep,
Not “sideway” but “accelerating” for a year.
Ol’B
Nope, right now as of mid-May, it’s increasing at a new rate of about $10 billion a month through mid-June. It increased by about $40 billion a month through mid-April Tax Day, and then they cut that to about $25 billion through mid-May, and since mid-May they cut the pace further to $10 billion through mid-June. In June, they will announce the new pace, if any, through mid-July. The cycle goes from mid-month to mid-month, all of it preannounced.
Wolf, do you have a recent article that outlines what asset classes the Fed is loading up the BS on?
The Fed is SHEDDING MBS and is replacing them with T-bills. In the current mid-May to mid-June period, it is also adding $10 billion in T-bills. Everything else roughly stays where it is.
Warsh is counting on productivity to hold down inflation, like during Greenspan’s Great Moderation.
I think the 6 month inflation rates are my favorite for analysis. Looking back a full year is too much ancient history. Wolf can your charts be (easily) modified to look at the increases over the last 6 months?
Nosing over the BEA interactive charts, the last six months are looking pretty bad…
I post 6-month inflation charts from time to time when there is a change in trend that the year-over-year chart doesn’t yet show. But this trend changed a year ago, and so the year-over-year chart shows it very well, which is why I posted it.
The thing is, the Fed’s yardstick for the inflation target is not the 6-month index but the year-over-year index. And the 6-month is very volatile and noisy, as you can see in the chart below.
That’s a very disturbing chart, inflation is rising. I have serious doubts about what’s being counted and not counted. And the weightings are a problem. Diesel fuel prices are now quite high in California…over $7.00 a gallon…about $5.50 in other states. Everything moves by truck, so prices are rising. Broccoli that I buy regularly has gone up 50% over the last week to $3.00 a pound. Beef prices are the highest I’ve ever seen. I think we’re in a lot of trouble. There’s a lot of pressure on Trump to cave in on the Iran war, but he seems to like the blockade. I think 30% of America is living in an inflationary depression. There’s an astonishing amount of debt out there, which is pretty worrisome. Total debt in America is over $100 trillion. It’s a big number.
My “Gas Station from Hell” is still posting $6/gallon for regular. This was the price they had when crude went up to $118/barrel. The price of crude had dropped $30, but they have not dropped their gas price. I call that price gauging. Suckers are still lining up there paying the $6/gallon price. What the f%ck is going on??
We had a sudden landing, then our onboard flight system malfunctioned and were headed back to space now 🚀
Hahahaha. LMAO. Shows us where that increase in GDP is really coming from.
Increased GDP!!! “Yeah, right, OK.” 😜
Bullshit. GDP is adjusted for this inflation, you goofball. Not adjusted for inflation, “current dollar” GDP in Q1 jumped by 5.1% downwardly revised today from 5.6%.
How much of that GDP is from the building of data centers for AI? How much is borrowed money for government spending? I’m skeptical of numbers coming out of the Trump administration. He’s fired hundreds of thousands of federal workers who have tenure. It will take them years to get their jobs back or get compensation. Trump and his minions are at war with the truth. We’re in the worst housing market in decades. The average car costs $50,000. Are interest costs embedded in the CPI or other inflation metrics? Houses may average $500,000, but most of the payments go to interest costs. I’m 80 years old. I remember when a bottle of Coke out a machine was 5 cents. I remember when 3 Musketeers bars were 5 cents and too big to finish. I remember when gasoline was 23.9 cents a gallon. I remember when Presidents didn’t impose high tariffs so they could lower them in return for a personal lucrative business deal, a 747 from a prince, a gold bar from Switzerland or outright illegal cash deals. For what it’s worth, I think we’re pretty f*cked in America right now and I expect things to get worse.
Jeff K ; yes, we all remember that but, in the late 50s ( which is when 3 Musketeer bars were 5c and coke came out of the sliding machine cooler for a nickel the minimum wage was maybe $1/hr. ( if there even was a minimum wage then ) ; I stacked hay in the summer for a penny a bale which equated to $10 / day in a 10 hr day so, everything has adjusted. In any event the avg American’s standard of living has materially improved since then.
I remember before Trump got elected 3 Musketeer bars were 5 cents!
“How much of that GDP is from the building of data centers for AI?”
Well, total current dollar GDP in Q1 was $31.9 trillion annual rate. So you can figure how much AI spending might be in this figure.
But yes, AI spending is driving some of the growth. It’s a big deal — corporate money getting plowed into economic activity.
You should then remember a time before GATT and NAFTA then. Back when the Democratic Party supported tariffs because they supported labor.
Thank you for mentioning the firing of tenured federal workers. Many were fired in violation of the law. RIF rules were not followed. Their recourse is to sue and wait years for a resolution. Apparently one man can abolish the civil sevice system, and he did, thus far without consequence.
The scoreboard reads
Wolf 100
Harry, no Harry 0
Even if Iran and US reach a peace deal and the strait of Hormuz opens (a big IF), the crude oil price won’t go back to 70 until 2030 (see oil futures market). The supply shock will linger for years to come. Better pray AI magic will increase productivity tremendously to starve off the incoming inflation.
Until AI magic includes harvesting corn or raising beef cattle, I’ll assume food inflation is here to stay. As far as I can tell “AI productivity” just means “job losses” – not any actual cuts in prices anywhere. And “job losses” so far has meant “cut jobs now… figure out AI productivity gains (if any) later”.
Wolf, regarding this in the above piece:
“The US… gets very little crude oil from the Strait of Hormuz and doesn’t need any of it.”
Doesn’t CA import Saudi crude? Is some that via the strait?
California refineries buy crude oil wherever it’s the cheapest, including by oil train from US producing regions, by tanker from Alaska, or from Saudi Arabia, or before 2022 from Russia, or wherever around the world…
Then they refine it and export a portion of the gasoline, diesel, jet fuel, and other products to Mexico and further south. It’s a big profitable business. The Gulf Coast refineries are doing exactly the same.
Gasoline consumption in CA has been plunging for years due to more efficient ICE vehicles, including hybrids, and more recently the surge of EVs in the fleet.
What else are those refineries going to do with their idle capacity?
US exports of gasoline, diesel, jet fuel, and other petroleum products is a huge business.
I acquired an EV in March. I was given $10K by the local air quality district to turn in one of my 20+ year-old cars for demolition. I couldn’t pass up the deal and bought one of the least expensive EVs, 2027 Chevrolet Bolt for net $25K.
Gas prices in northern CA are well past $6/gallon. I switched to time-of-use electricity rates from horrible PG&E, so I pay $0.23/kWh instead of $0.41/kWh, if I charge between midnight and 3 PM. I did a calculation about cost per mile (only gas versus electrical costs) and it was cheaper with an EV as long as gas was above $4/gallon at $0.41/kWh. With my cheaper rate and the higher cost of gas, the EV is much less per mile. Most people around here have Tesla EVs, but there are more and more other brands appearing.
I find it hilarious that the current administration stacked the house against solar and EVs, and the Hormuz Strait just turned that policy on its head. In my opinion, between that fiasco and the data center build outs, the writing is on the wall as far as costs go. Build out your solar because the utility companies are NOT in your favor.
I purchased an EV last year also and did your same analysis for my area.
My home electric rate is low($0.11/KW hour) so compared to a 25mpg ICE vehicle, the equivalent is about $1/gallon. However, charging at a charging station at the going local rate ($.59-$.69 + fees and taxes) is equivalent to $6-$7/gallon. Our local gas prices are around $4.30/gallon regular.
I bought an EV to replace a 16 year old ICE car.
Our use model convinced me to buy an EV(along with some environmental concerns even though our electricity is mostly generated currently with natural gas and coal.) As long as my daily driving stays below the 270 mile range, I can charge cheaply at home. If I have to use a charging station, I pay more than an equivalent ICE car.
Our use model is 99% in this range. We almost never drive beyond 270 miles in one day. (That is 4 hours at 65mph). After 8 months of EV ownership, I’ve never used a commercial charging station.
The other consideration I had when buying an EV over just keeping the 16 year old ICE car was the savings vs just keeping my reliable ICE car for several more years.
I drive about 10K miles per year. The savings in gas comes out to about $1200-$1500/year.
Is it worth buying $25k-35k EV to save $1500/year in gas?
It is not an obvious decision. Your results will vary.
Like a recent little sign I saw posted at an intersection said:
“How’s that MAGA thing working out for you?”
Was that across from the learing center?
Warsh intends to use a trimmed mean and median PCE. Not the current core PCE, which should give him lot’s of wiggle room.
Is that like excluding services from the Services PCE?
I’m so tired of this internet BS getting spread here. That’s not what Warsh said. He said that he will look at all inflation indices, including the Dallas Fed’s, to see the underlying trends — and that is not new because the Fed has always looked at its own indices also, such as the Dallas Fed’s index. And he said that he would like an improved inflation index (from the BLS or the BEA) based on a “billion prices” collected with modern methods, and I don’t have a problem with an improved inflation index based on modern methods. Our inflation indices are flawed, especially the component of OER and the health insurance CPI.
Re “Warsh intends…”
You’re not a mind-reader. So you don’t know. Neither do any of the internet pundits.
Warsh is in a political role. That means that anything he says, is said for some effect, but it tells you nothing about what he actually thinks or intends.
You have to watch what they do – especially when they don’t advertise it – and ignore what they say.
Wasn’t Warsh saying that we don’t need to worry about inflation because AI is going to be deflationary? He’s talking about productivity, but if the AI bubble pops and tanks the economy then that could also be deflationary. I guess it’s possible that he’s going to be right in one way or another, and might want to at least hold off on rate hikes because of that. The only inflationary driver that might not self-correct that way is the energy shock, and you’re not going to fix that by raising rates. Judging by the fact that we’re having the xAI IPO now, and potentially an OpenAI IPO soon, where they’re trying to dump all of this onto the index funds, we might not have to wait long to find out.
I suppose the other wildcard is how long Warsh can go without actually lowering rates before he gets indicted.
What Warsh said was that AI is initially in-flationary as demand pressures will cause prices to rise, but that it might be de-flationary longer term due to productivity gains. He conceded that the second phase is speculation because no one knows how this will turn out.
According to oil expert Art Berman, who was interviewed yesterday by ret Col Daniel Davis (YouTube), the U.S. is a net energy exporter, but a net petroleum importer, to the tune of 2.5 million bpd. Incidental to the main point of your article, but an interesting discussion.
That’s BS because the US refineries — including those on the West Coast and California — import crude oil to refine it and export petroleum products, such as gasoline, jet fuel, etc. The US is a HUGE net exporter of petroleum products.
What else are refineries supposed to do, given the long-term decline of gasoline consumption in the US?
https://wolfstreet.com/2026/03/03/oil-jumps-but-its-not-the-1970s-anymore-us-crude-oil-production-hits-record-net-exports-soar-imports-decline-further/
I asked Google AI a detailed question asking who was correct, and the unsurprising answer is you both are. I’m only quoting the summary:
“Both Art Berman and Wolf Richter are technically correct, because they are talking about two entirely different metrics. Art Berman is referring strictly to crude oil (unrefined petroleum pulled out of the ground), while Wolf Richter is looking at the combined total of crude oil plus refined petroleum products (gasoline, diesel, jet fuel, and propane).”
P.S. I should have said “net crude oil importer” vs “net petroleum importer” in my initial post.
Don’t outsource judgment of truth to an “AI”
The problem with asking Google AI anything is that it will often be wrong… and now you don’t know it.
Wolf is correct – and Art Berman is not – because of the INTENT of the commentary. Art Berman should have stopped at “Net Energy Exporter”. Do we care where the energy is coming from as long as we export more than we consume? Most people do not understand that oil refining is a much bigger business in the US than oil production is. It is capital intensive, requires a degree of technical sophistication, and many 2nd world countries do not have the means to create their own refining infrastructure. So they sell us their cheap oil which we turn into expensive petroleum products and sell for $$$. People read that we import raw petroleum and their collective heads blow up – because they think it means we aren’t / don’t have the means to be “energy dependent” (whatever that means).
Regardless, the price of oil will help oil investors and hurt consumers. I own Shell stock, but as a consumer, I drive less when the price of gas is high. Trying to save some money for groceries…
obviously the Iran operation is responsible to the current temporary blip. We will see once a deal is made and crude oil drops how sticky any of the temp inflation is.
Personal Income of 0.0% was concerning. Was that solely due to massive one-time subsidies the prior month to farmers?
It was fine. There was a $60 billion “annualized rate” drop (not actual drop, divide that by 12 to get a feel for the actual drop) in farm income month-to-month because of the subsidies getting paid last month. Compared to 3 months ago farm income was up. But all other forms on income, including wages and salaries were up by a normal-sh percentage of about 0.25% month to month. Year-over-year, wages & salaries were up by 3.5%, so OK.
The problem is that inflation is now running a little faster than wage increases.
GDP revised down and uncomfortably high inflation. Solid economy that clearly works for everyone
I’ve been trying to understand why doesn’t this sort of relationship count as a mild recession. I know the definition of recession is negative GDP growth for a handful of quarters, while unemployment and similar metrics also play a role.
But if you are getting roughly 2% GDP growth and annual CPI runs at around 4% for at least a few months, isn’t this practically the same as having a negative 2% growth rate?
The overall economy is still growing, nominally, but doesn’t money losing its value faster than that mean the economy is shrinking in real terms? Or count as stagflation lite?
“But if you are getting roughly 2% GDP growth and annual CPI runs at around 4% for at least a few months, isn’t this practically the same as having a negative 2% growth rate?”
BS. GDP growth that you cite is already adjusted for this inflation, you goofball. Not adjusted for inflation, “current dollar” GDP in Q1 jumped by 5.1%, downwardly revised yesterday from 5.6% growth.
I do not understand how people who have commented here for a while have apparently NEVER read a single GDP article here on this site!!! Every singe article here every quarter when GDP is released explains this. RTGDFA and I mean it.
Thanks, Wolf. (For my first scolding as well; it didn’t take long, this was actually only my 3rd comment or so.)
I do try to read your articles carefully , but some stuff still goes over my head easily. I doubt I’ll ever forget this one, though *grins*
I also did try researching this before posting, but I didn’t get clear answers (aside from LLM nonsense). I wiill redouble my efforts.
The next Fed rate decision is on 17 June and it’s a “dot plot” month. The committee members will have to stand up and be counted.
Many people here said the Fed should not have cut rates in Dec. because the data was unreliable. It is hard to avoid the conclusion that the Fed cut in Dec. out of fear of a Trump attack. The irony is that anyone suggesting a rate rise now to correct that mistake will feel a much stronger blast from Trump this time around.
Fed Governor Bowman today:
“But Bowman said adjusting policy to offset energy-driven inflation surges has proven ineffective.
“Reacting to temporarily elevated energy price inflation would add unwarranted policy restraint, weighing unnecessarily on economic activity and labor market conditions,” the policymaker said at a conference in Reykjavík, Iceland.
Bowman added that research shows that when reacting to temporary energy shocks, “policy should not be overly aggressive.””
Right. It’s only okay to haphazardly “react” in the opposite direction.
You need to read her whole speech. It was a pivot from her cut-rates-now-and-by-a-lot last fall to let’s-wait-a-little-and-see-before-we-HIKE.
Please resume QT
Weren’t people talking of a soft landing 2 years ago? Or is it like one of those Alitalia flights where the landing can turn into a rollercoaster ride any moment with passengers fearing their life?
BTW I don’t know what’s the share of various categories in the computer & software inflation, but certain items retailers can’t move are selling at surprisingly low prices. Like those webcams & headsets everyone was after during the work-from-home craze are now pennies. I wouldn’t be surprised to see buy 1 get 2 deals popping up for accessories if customers who bought those with new PCs stay away longer.
Even businesses are delaying orders and the Windows 10 EoL event wasn’t the massive sales boom OEMs hoped for either. The weird nature of the AIflation is that prices are up, but it’s only about a dozen chipmakers benefiting. No idea what the world will do with all those AI GPUs if this thing pops…what’s their heating value?
Their idea of a soft landing is one where the average person gets a 2-3% raise, if they’re lucky, that doesn’t come close to paying for the massive increases in costs for the necessities of life.
Meanwhile, the oligopolist big corporations, especially big tech, make massive profits by consolidating a larger and larger share of the economy, and use those profits to spend money on AI infrastructure, all of which the benefits go to the top 10% or so.
This isn’t the way to run a society.
per IMF, usa GDP has 38% of government spending in it. if those bombs dropping are productive, i guess that’s kewl. /sarc
wait a minute…
1. that 38% is total government spending (including state and local) divided by GDP. That does not mean that they are 38% of GDP because interest payments and some other outlays don’t go into GDP.
2. Much of that 38% is state and local governments (teachers, first responders, state universities and colleges, etc.). Federal government spending is small compared to state and local government spending.
3. Total government consumption and investment that actually goes into GDP was $4.0 trillion annual rate in Q1 = 16.5% share of GDP.
The idea of an arbitrary inflation target including the Yellen/Bernanke 2% target was and is a fool’s errand. It’s an unnecessary and unnatural form of price manipulation, isn’t it?
Eerily analogous to the Fed’s full employment mandate. Is a Labor Force Participation Rate or LFPR) for the “prime-age” workforce (ages 25–54) is currently 83.8% full employment?
Of course observations without solutions including mine are just noise. So here’s two changes the incoming Fed chair might consider.
First, streamline the institution. There is absolutely no earthly reason the Fed should employ 400 PhD economists.
Secondly, expand the FOMC’s quiet period from the current twelve days to 24/7 to encompass the entire year.
You need to think like I did living and working in Latin America. Inflation often reached 100 percent a year.
Buy food and goods now before you are paid at the end of the month because inflation will put the price up a lot by then.
Do not save any cash, it loses its purchasing power rapidly in a year.
Keep your cash money in a hard currency, gold/silver coins, Swiss Franks, etc.
Buy assets like old cars, useful machinery, etc. Anything that can be sold quickly when you need cash.
Inflation is not an easy thing to deal with for the government or for citizens. It just got worse and worse before the currency collapsed and a new government started a new currency. Then the same process started over again like in Argentina. Fortunately, today is better, sometimes.
There is a huge difference between 4% inflation and 100% inflation 🤣
Yep, as many people, smarter then me, have pointed out, the second wave of inflation is just getting started. It’s the summer of 73 again, but this time with 120% DEBT/GDP…
Go ahead Warsh, raise those rates you corrupt MF, I triple dog dare you.
Inflation cannot occur unless fueled by a chronic increase in the volume and/or velocity of money. A chronic increase in means-of-payment money cannot occur unless the FED permits it.
The commercial banks are credit creators. The non-banks are credit transmitters. Lending/investing by the DFIs expands both the volume and the velocity of new money. Lending by the NBFIs increases the turnover of existing deposits (a transfer of ownership), within the commercial banking system.
Dr. Scott Sumner says the FDIC should be abolished entirely.
Another banker shill. Banks need to go back to just being banks again. Abolish the FDIC? WTF? How about we allow bad behavior and bad management to actually fail? Maybe prosecute some fraud?
You fight stagflation by draining bank reserves while driving the banks out of the savings business (aka The 1966 Interest Rate Adjustment Act)
This does not reduce the size of the payments system. The NBFIs are the DFIs customers.
Driving the banks out of the savings business makes them more profitable and increases the supply of loan-funds in the long-term market for the nonbanks.
This was the first “credit crunch” and there was an interest rate inversion with no recession and inflation fell. Real interest rates rose for saver-holders.
Fed Inflate-O-Meter: 1884 Days and counting!
As Wolf noted in the article, using the Fed’s preferred inflation measure (year over year change in the Core PCE price index), inflation has been over 2% since April 2021. That’s 1884 days as of today.
(Maybe this and other economic Fail-O-Meters could become a running theme here, sort of like the Imploded Stocks?)
You can only jawbone so much. A quarter percent hike at the next
meeting would change the narrative
and possibly help prevent much larger
hikes later.
Wolf, you know my facination with the NFCI. Financial conditions have been getting looser and looser back to Oct ’22.
I mean if the Fed was serious about reigning in inflation, why haven’t they tightened things down?
It’s like they want to feed the speculation in the markets and the inflation caused by asset appreciation, by not tightening.
I guess they are keeping the economy afloat (no recessions on our watch) to spare the rath of Donald the Orange Demented One (DODO).
Did the Japanese force feed you wasabi for a whole week (ancient Japanese torture tactic)? In your responses, you seem a little grumpy. 😠
How is inflation in Japan? Saw a couple short vids about some families of 4 or 5 living in Tokyo in 300-600 sf apartments. Very cramped quarters.
If they had 600 sf in Tokyo, they had a mansion 🤣
What’s the price of beef in Japan?
My Guess $100/LB??
Nah. Unless you buy some extra-special stuff. The US may by now have the most expensive beef in the world.
My vote is to hike a quarter next month just to see Bessent’s head spin as he babbles and turns into Alice in wonderland the White Rabbit. (. Overall, the White Rabbit seems to shift back and forth between pompous behaviour toward his underlings, such as his servants, and grovelling, obsequious behaviour toward his superiors.)
and hear the DOJ say I’m under investigation.
SPX market cap reached $69.5 T. GDP: $31.8T. The ratio: 2.2. In the next few years SPX will be more diversified. The mag7 might lose, but the rest will gain much more, at their expense. GDP might rise to $35/ $37T and SPX market cap to $73T/$75T. The zoomers who study AI in community colleges and practice AI in factories during their 3rd and 4th year will benefit the most.
The high tech industry dumped tons of workers. During the Biden years Amazon doubled their headcount. Now they cut highly paid software engineers (not hardware). It’s FOMO. The highly paid boomers are retiring. They despised their grandchildren idiotic video games. They hate AI.
hate? I think we recall childhoods and prime years of our lives NOT coming home from school/ work and sitting holding a device or in front of a device…rather seeing /talking with and mingling w neighbors and people do you want more details/ the younger people that move in are not sociable/ dont say hello how are you what ya got going in your garden..come on over and play scrabble and cards etc..to be simplistic if that helps. kid next door 8 yrs old doesnt have a bike/ no walks …dad has to walk the dog alone. I’m glad i grew up when I did….I know the difference..its not hate . culture changes….how is this for the better?
“Federal Reserve Bank of Kansas City President Jeffrey Schmid has warned that the current global energy shock cannot simply be dismissed as transitory, given already-elevated baseline inflation. Speaking at a conference in Iceland, Schmid pointed out that inflation has stalled near 3% and remained above the Fed’s 2% target for a long time, making it challenging for the central bank to “look through’’ surging oil prices. Schmid has argued that current monetary policy may not be restrictive enough, reinforcing his hawkish stance on monetary policy. Schmid has suggested that the Fed may need to consider utilizing its balance sheet as an additional tool to cool down the economy.
“We’re not very restrictive at this stage and I think there’s some dialogue that we need to start considering what tools we have to really make it a little bit more restrictive depending on how the oil shock plays out in an environment of already high inflation,” the official said. ‘‘Maybe we look at the balance sheet again as another tool to…create some restriction,” he added, suggesting some sort of new drawdown in Fed holdings.”
“the gas in the tanks at gas stations or at refineries or in transit had been purchased earlier at the low prices that had prevailed at the time”
But those tanks need to be refilled at *current* prices.
Do you have stats on inventory levels that show the amount of drawdown?
1. Very little if anything gets bought by refiners in the spot market but with longer-term contracts.
2. in other industries with less pricing power, sellers cannot pass on price increases easily, and often only after prices of actual delivered goods have risen.
3. refiners don’t need crude coming through the Strait of Hormuz. They buy where it’s cheapest.
4. US is a huge exporter of refined petroleum products, including gasoline, diesel, and jet fuel. There was never any shortage in the US, but a glut that needs to be exported.
5. In the US, this was pure price gouging. Why? Because they could because consumers were cowed by the news and were willing to pay, and the industry colluded to maximize their profits, rather than compete with each other.
5. Look at the 3-2-1 crack spread, which is a theoretical measure of refiner gross profit margin (theoretical value of refiner product output minus value of crude oil input). It MORE THAN DOUBLED between Feb 20 and May 12, from around $25/bbl to about $60/bbl