
Plus in another 44 bigger cities, condo prices dropped by 7% to 14% so far, as the mindboggling Condo Bubble comes unglued.
By Wolf Richter for WOLF STREET.
The price drops are getting relentlessly steeper: In 24 bigger markets, prices of mid-tier condos through April have dropped by 15% to 33% from their respective peaks between 2021 and 2024.
Each of the markets is shown in a chart below: 24 mindboggling charts, depicting breath-taking price explosions, especially from mid-2020 to mid-2022, exceeding 50%, 60%, or even 70% in just two years in some cities. In the 10 years to the peak, prices had soared by 180% to 350% in these markets. And these bubbles have started to deflate.
In 2 of the cities, prices of mid-tier condos dropped by over 30%. In five other markets, prices dropped by 20% to 28%. In another 3 cities, prices dropped by 19%. These are starting to be substantial declines over a multiyear period.
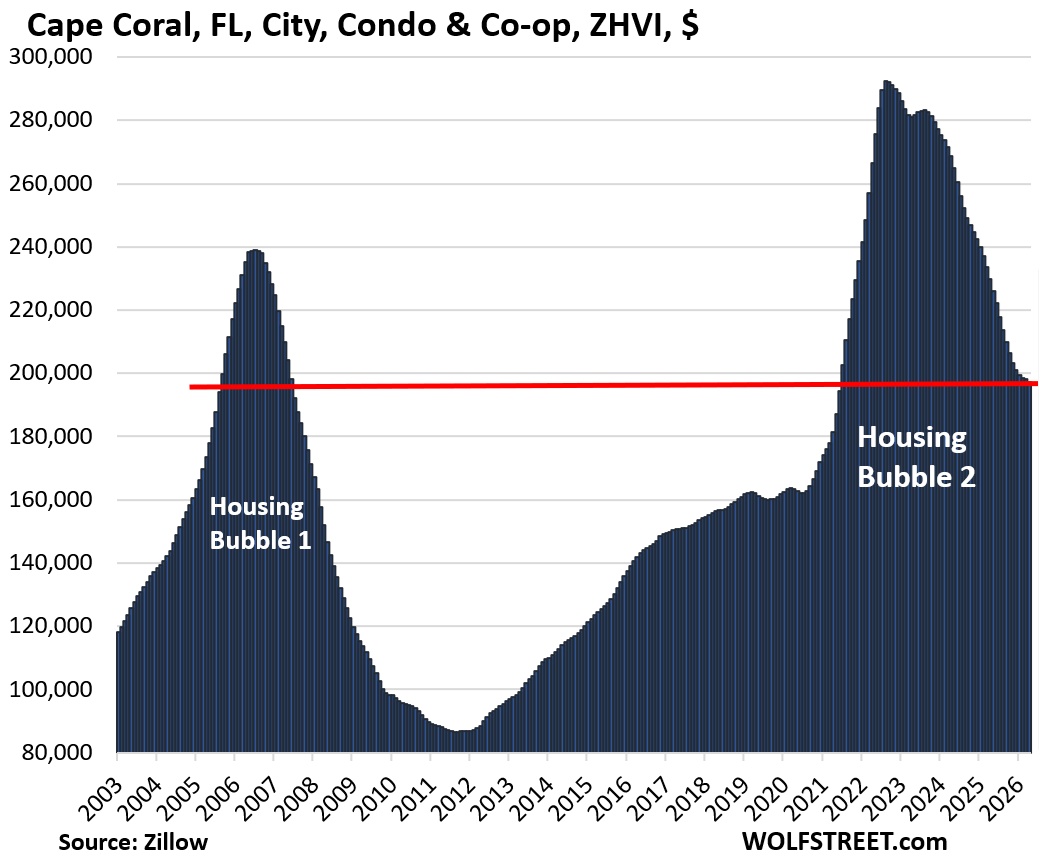
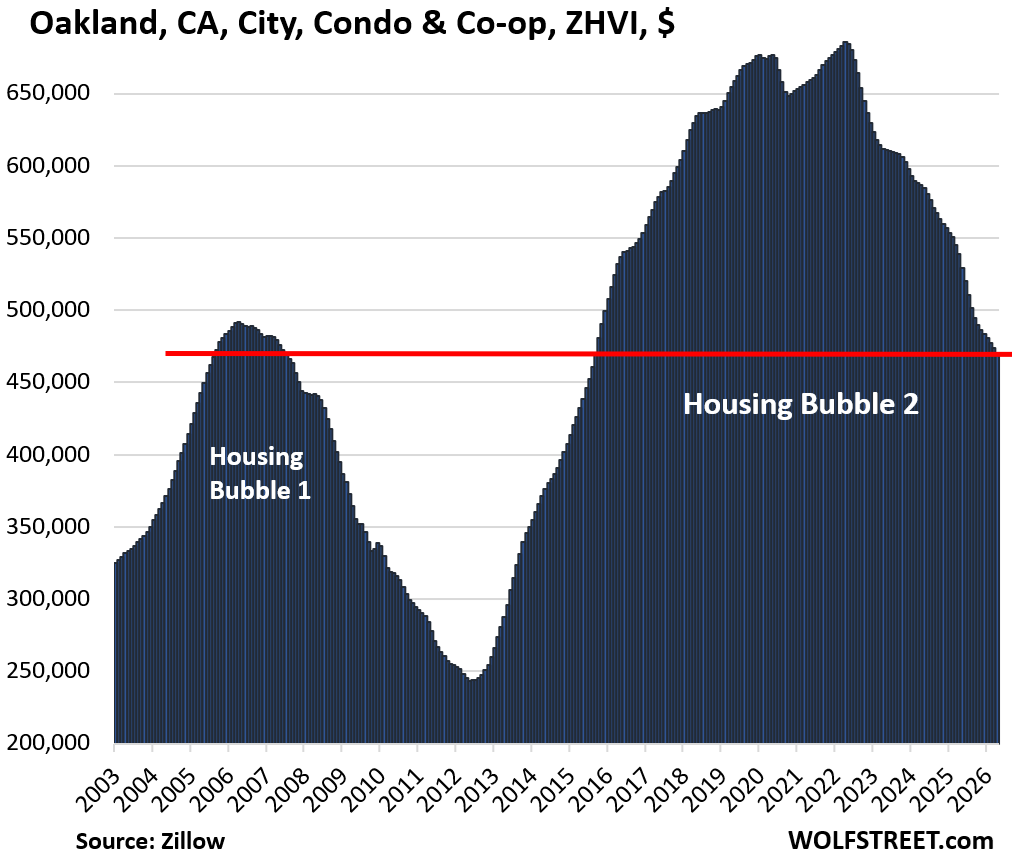
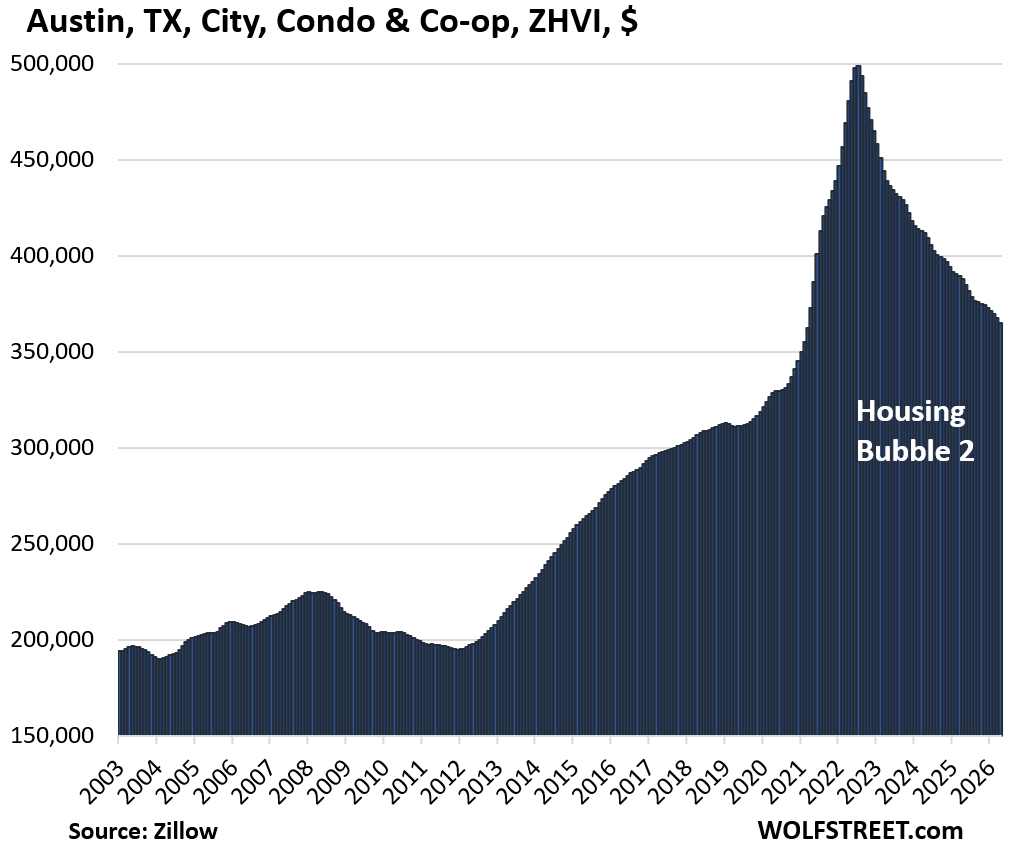
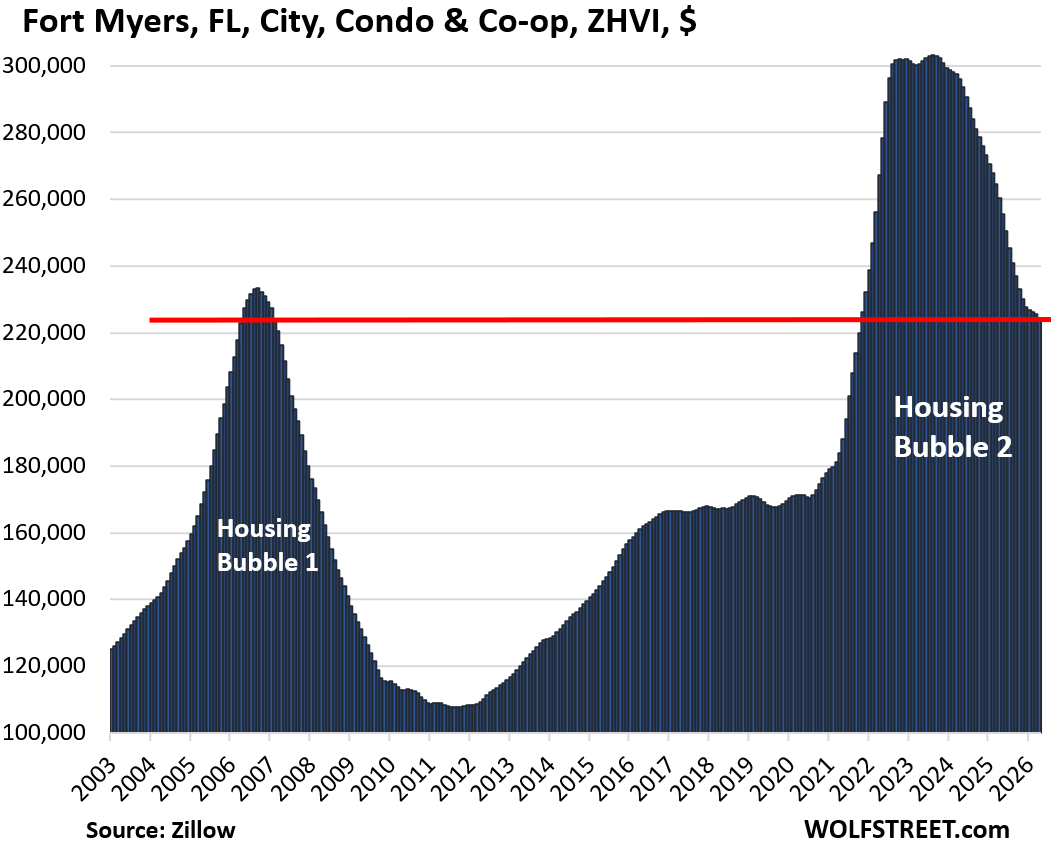
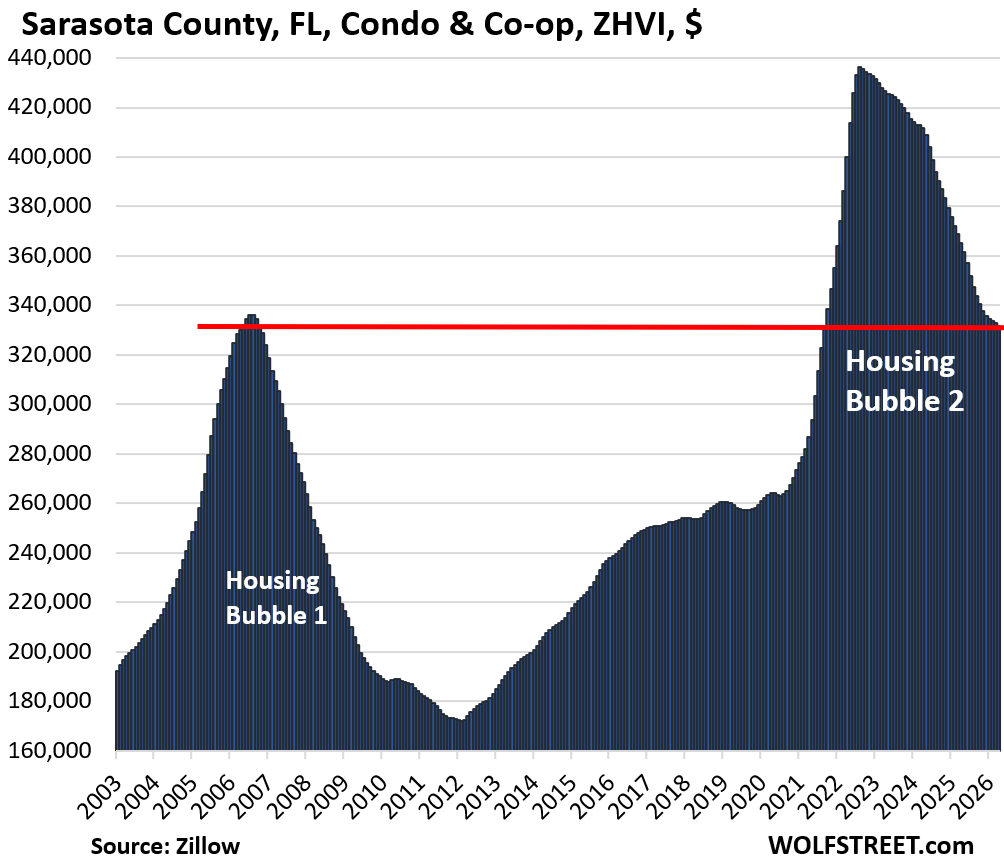
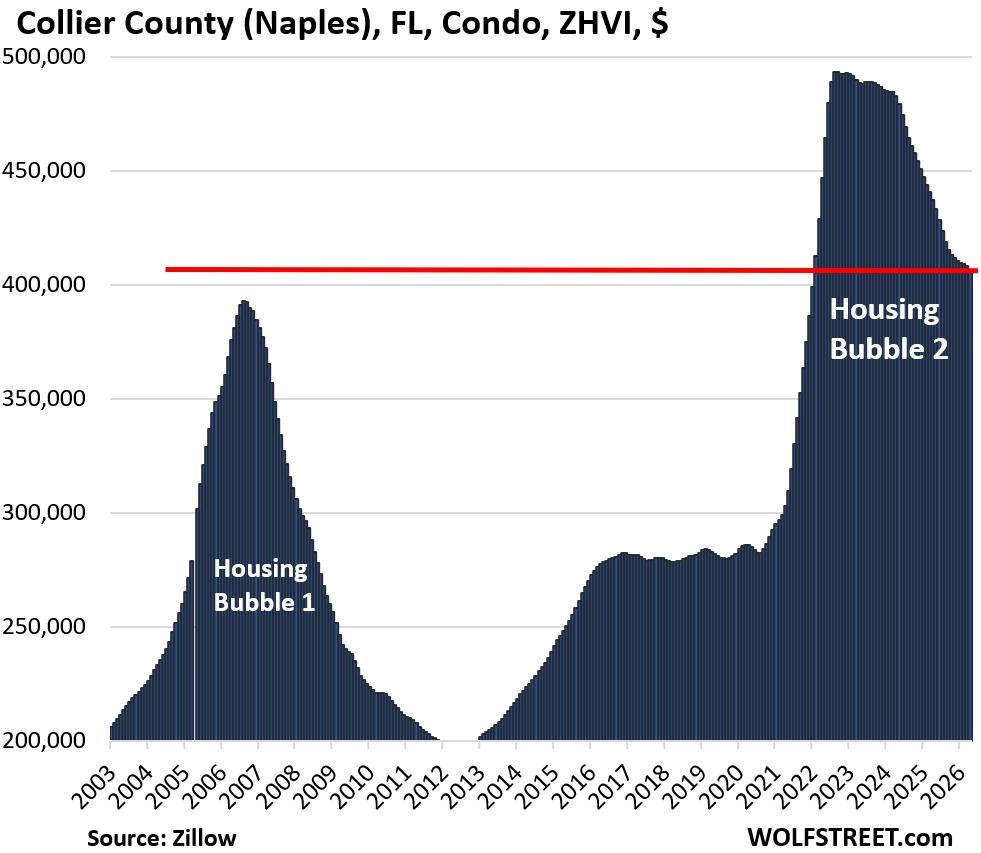
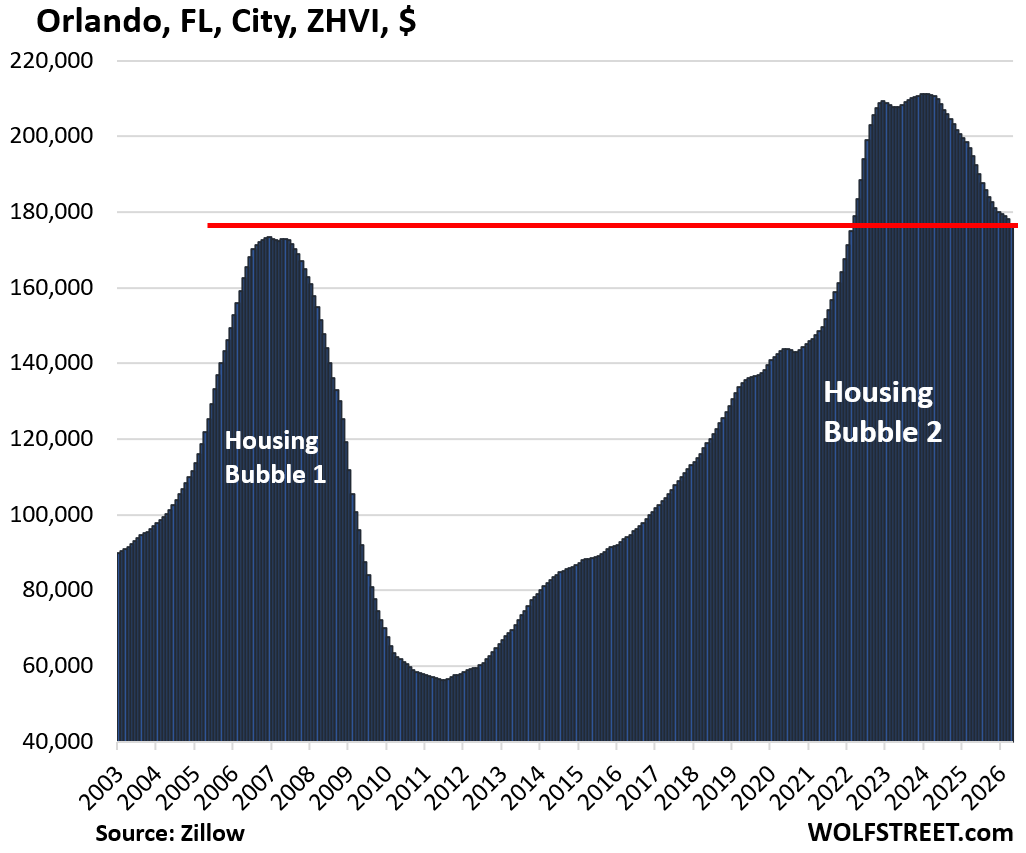
In several of these markets, condo prices have now dropped below their peaks of Housing Bubble 1 in 2006/2007 and are back where they’d been 20 years ago. In a few other markets, prices have dropped close to their peaks of Housing Bubble 1. Those charts are marked with a red line.
There are also many smaller markets where condo prices have dropped just as much or more, but that are not included here because they’re too small.
Most of the markets here are “cities.” But the line-up also includes three counties where the cities – though household names – are too small to be included individually. And it includes one metropolitan statistical area, the Lakeland-Winter Haven MSA in Florida, for the same reason.
In some densely populated cities, condos and co-ops make up a big part or the majority of home sales. In most other markets, condos are a much smaller portion of home sales.
| Condo price changes | Since peak | Year of peak | |
| 1 | Cape Coral, FL | -33% | 2022 |
| 2 | Oakland, CA | -31% | 2022 |
| 3 | St. Petersburg, FL | -28% | 2022 |
| 4 | Austin, TX | -27% | 2022 |
| 5 | Fort Myers, FL | -26% | 2023 |
| 6 | Sarasota County, FL | -24% | 2022 |
| 7 | Tampa, FL | -20% | 2022 |
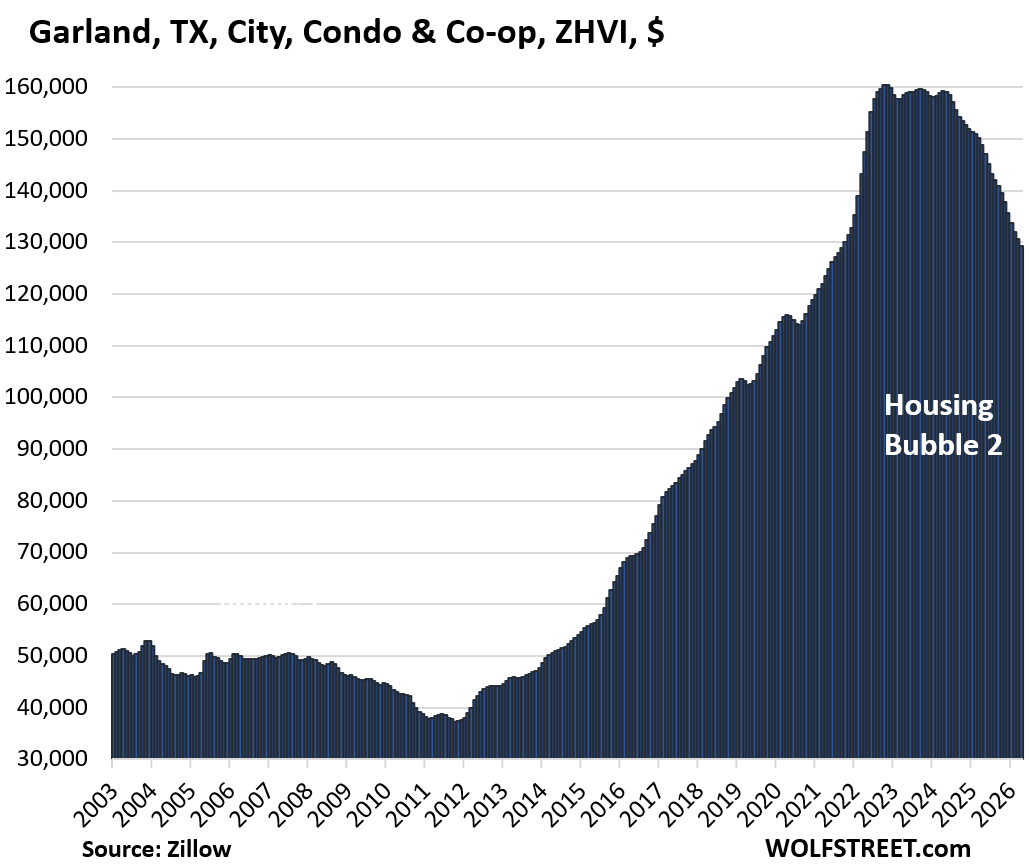
| 8 | Garland, TX | -19% | 2022 |
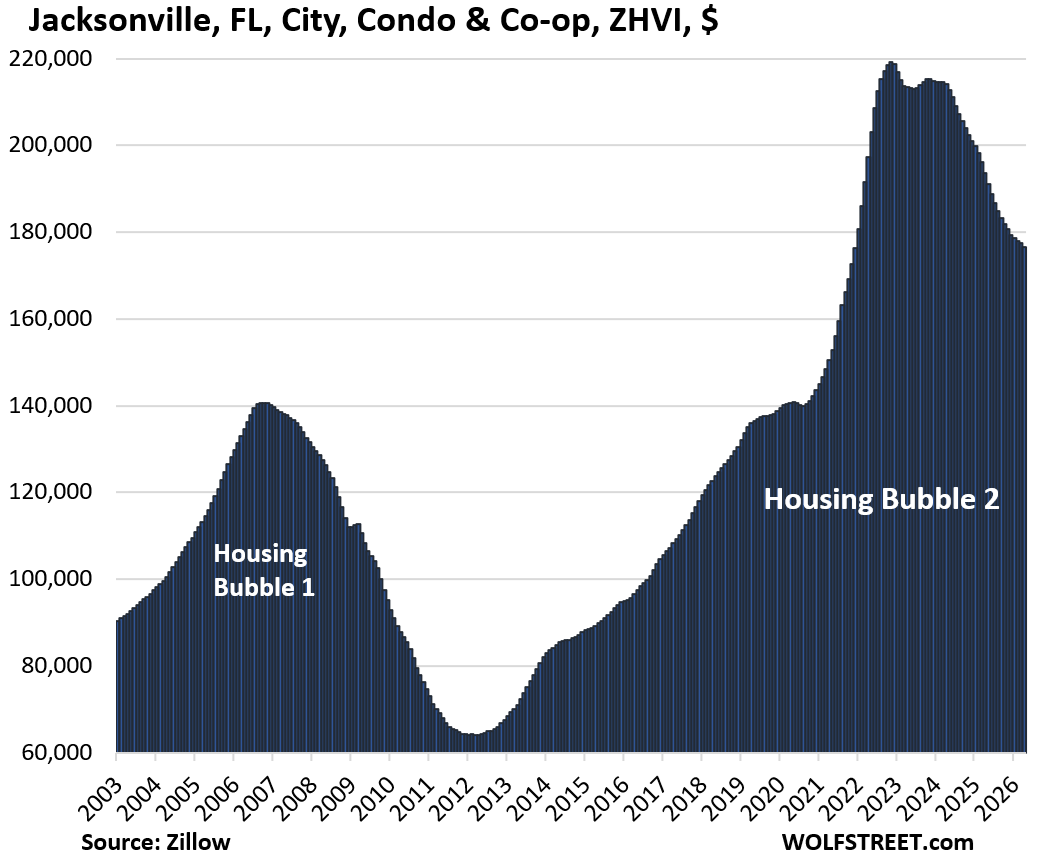
| 9 | Jacksonville, FL | -19% | 2022 |
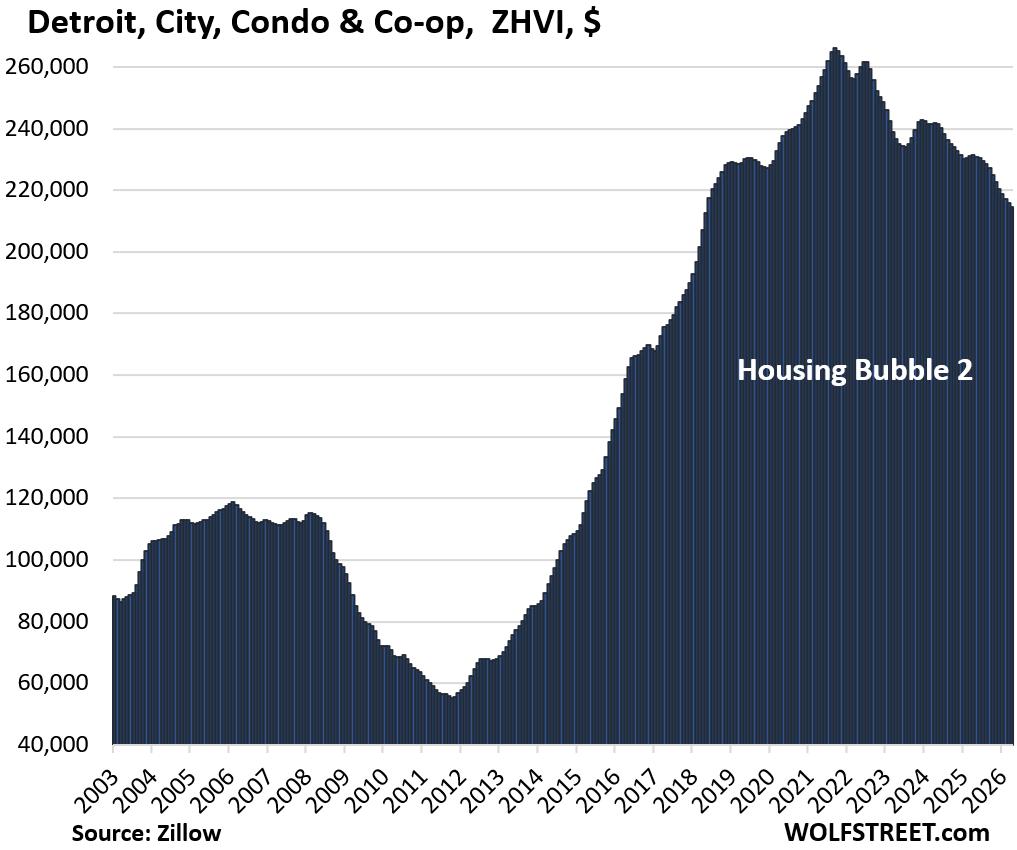
| 10 | Detroit, MI | -19% | 2021 |
| 11 | Collier County (Naples), FL | -18% | 2022 |
| 12 | Denver, CO | -17% | 2022 |
| 13 | Arlington, TX | -17% | 2024 |
| 14 | Lakeland-Winter Haven MSA, FL | -17% | 2024 |
| 15 | Aurora, CO | -17% | 2022 |
| 16 | Orlando, FL | -16% | 2024 |
| 17 | Raleigh, NC | -16% | 2022 |
| 18 | Port Saint Lucie, FL | -16% | 2024 |
| 19 | Hayward, CA | -15% | 2022 |
| 20 | San Mateo County (Silicon Valley), CA | -15% | 2022 |
| 21 | Seattle, WA | -15% | 2022 |
| 22 | Reno, NV | -15% | 2022 |
| 23 | Mesa, AZ | -15% | 2024 |
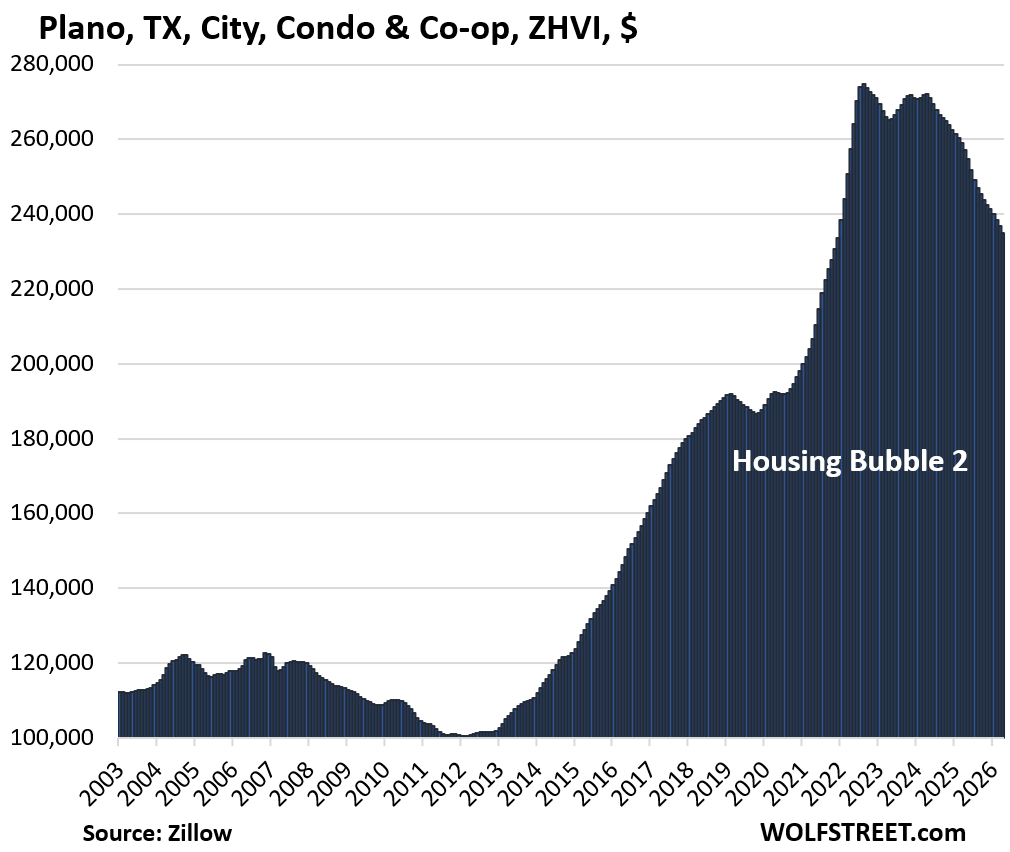
| 24 | Plano, TX | -15% | 2022 |
Those that didn’t make the 15% cutoff.
In many cities, condo prices have dropped by 14% or less, and they didn’t make the 15% cutoff here. Below is a sample list of 41 bigger cities where prices have dropped by 7% to 14% from their respective peaks.
| Condo price changes | Since peak | Year of peak | |
| 1 | Fremont, CA | -14% | 2022 |
| 2 | Portland, OR | -14% | 2022 |
| 3 | Boise, ID | -14% | 2022 |
| 4 | Clarksville, TN | -14% | 2022 |
| 5 | Chandler, AZ | -14% | 2022 |
| 6 | Phoenix, AZ | -14% | 2022 |
| 7 | San Antonio, TX | -13% | 2024 |
| 8 | Houston, TX | -13% | 2024 |
| 9 | Scottsdale, AZ | -13% | 2022 |
| 10 | Glendale, AZ | -13% | 2022 |
| 11 | Huntsville, AL | -13% | 2022 |
| 12 | Irving, TX | -12% | 2023 |
| 13 | Sacramento, CA | -12% | 2022 |
| 14 | Fort Lauderdale, FL | -12% | 2022 |
| 15 | Dallas, TX | -12% | 2023 |
| 16 | Tempe, AZ | -12% | 2022 |
| 17 | Corpus Christi, TX | -12% | 2023 |
| 18 | Stockton, CA | -12% | 2022 |
| 19 | Colorado Springs, CO | -12% | 2022 |
| 20 | San Francisco, CA | -11% | 2022 |
| 21 | Henderson, NV | -11% | 2022 |
| 22 | Las Vegas | -11% | 2022 |
| 23 | New Orleans, LA | -11% | 2022 |
| 24 | Spokane, WA | -10% | 2022 |
| 25 | Atlanta, GA | -9% | 2023 |
| 26 | New York City | -9% | 2022 |
| 27 | Washington, DC | -9% | 2022 |
| 28 | Nashville, TN | -9% | 2022 |
| 29 | Salt Lake City, UT | -9% | 2022 |
| 30 | Elk Grove, CA | -9% | 2022 |
| 31 | San Jose, CA | -8% | 2022 |
| 32 | Memphis, TN | -8% | 2022 |
| 33 | Gilbert, AZ | -8% | 2022 |
| 34 | Miami, FL | -8% | 2023 |
| 35 | San Diego, CA | -8% | 2024 |
| 36 | Marietta GA | -8% | 2024 |
| 37 | Oklahoma City, OK | -7% | 2023 |
| 38 | Tucson, AZ | -7% | 2023 |
| 39 | St. Louis, MO | -8% | 2023 |
| 40 | Long Beach, CA | -7% | 2023 |
| 41 | Minneapolis, MN | -7% | 2021 |
Methodology and data: These prices here are seasonally adjusted three-month averages of “mid-tier” condos and co-ops from the Zillow Home Value Index (ZHVI), which is based on millions of data points in Zillow’s “Database of All Homes,” including from public records (tax data), MLS, brokerages, local Realtor Associations, real-estate agents, and households across the US. It includes pricing data for off-market deals and for-sale-by-owner deals. These are not median prices.
The Condo Bust by market in 24 charts.
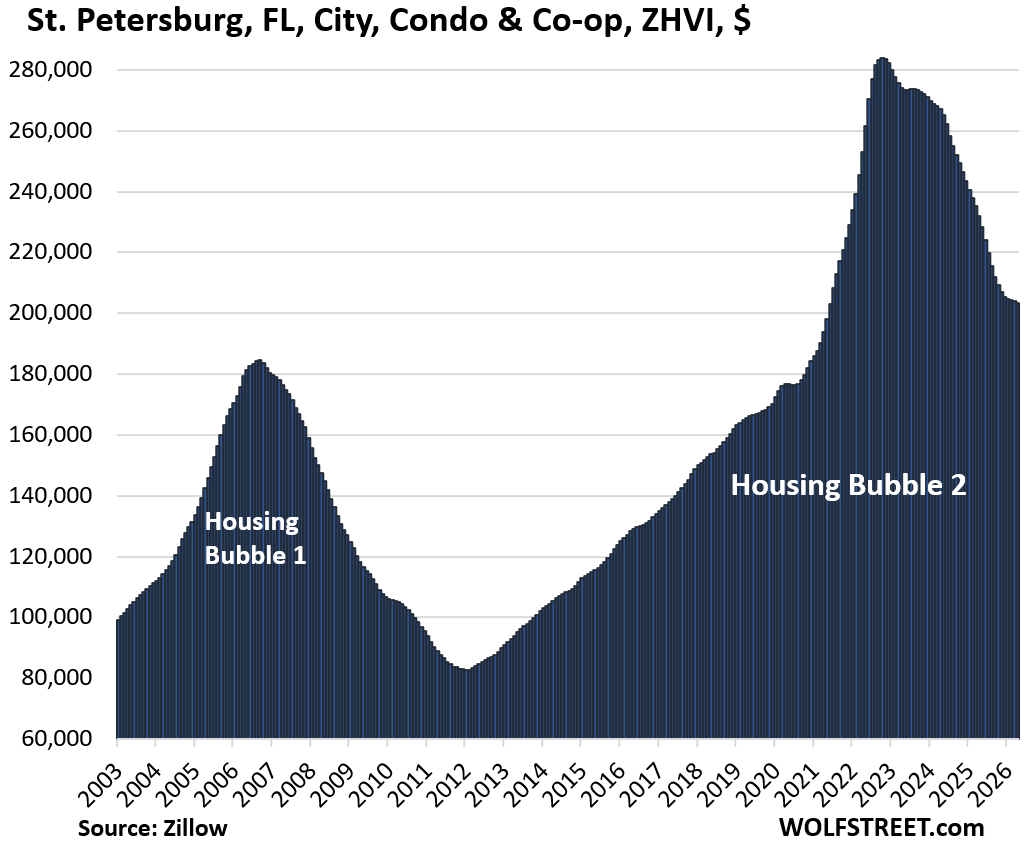
The tables for each market below show from left to right: price decline from the peak, change from prior month (MoM), change year-over-year (YoY), and remaining increase since January 2000.
| Cape Coral, FL, City, Condo Prices | |||
| From July 2022 peak | MoM | YoY | Since 2000 |
| -33% | -0.4% | -14.2% | 130% |
| Oakland, CA, City, Condo Home Prices | |||
| From May 2022 peak | MoM | YoY | Since 2000 |
| -31% | -0.7% | -12.6% | 140% |
Prices are back to where they’d fist been in mid-2005, and that was 21 years ago. Prices are down a lot, but are still very high.
| St. Petersburg, Fl, City, Condo Prices | |||
| From Oct 2022 peak | MoM | YoY | Since 2000 |
| -28% | -0.5% | -12.4% | 181% |
| Austin, TX, City, Condo Prices | |||
| From Jul 2022 peak | MoM | YoY | Since 2000 |
| -27% | -0.8% | -5.9% | 107% |
| Fort Myers, FL, City, Condo Prices | |||
| From July 2022 peak | MoM | YoY | Since 2000 |
| -26% | -0.5% | -14% | 121% |
Prices are back where they’d first been in April 2006, exactly 20 years ago.
| Sarasota County, FL, Condo & Co-ops Prices | |||
| From Jun 2022 peak | MoM | YoY | Since 2000 |
| -24% | -0.3% | -12.0% | 134% |
Prices are back where they’d first been in early 2006, exactly 20 years ago!
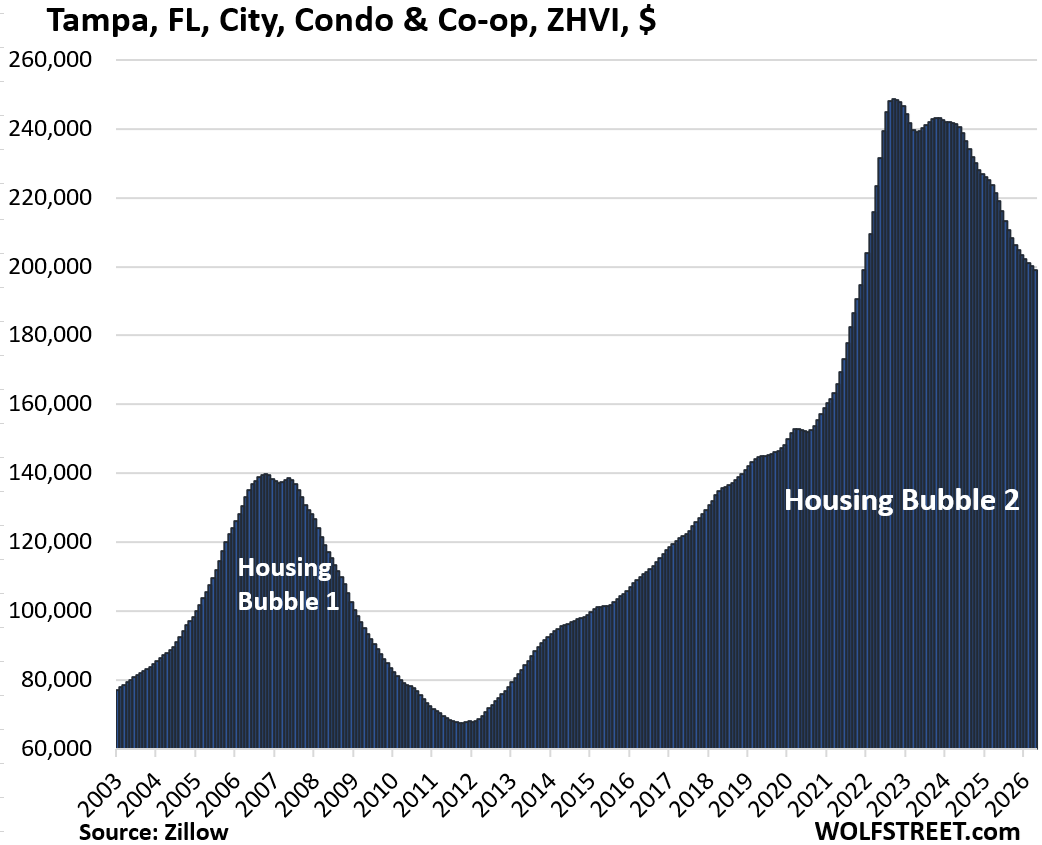
| Tampa, FL, City, Condo Prices | |||
| From Sep 2022 peak | MoM | YoY | Since 2000 |
| -20% | -0.6% | -10.1% | 250% |
| Garland, TX, City, Condo Prices | |||
| From July 2022 peak | MoM | YoY | Since 2000 |
| -19% | -1.0% | -13.1% | 209% |
| Jacksonville, FL, City, Condo Prices | |||
| From Nov 2022 peak | MoM | YoY | Since 2000 |
| -19% | -0.6% | -8.8% | 144% |
| Detroit, MI, City, Condo Prices | |||
| From Sep 2021 peak | MoM | YoY | Since 2000 |
| -19% | -0.5% | -7.2% | 245% |
| Collier County (Naples), FL, Condo & Co-ops Prices | |||
| From Jun 2022 peak | MoM | YoY | Since 2000 |
| -18% | -0.4% | -7.0% | 158% |
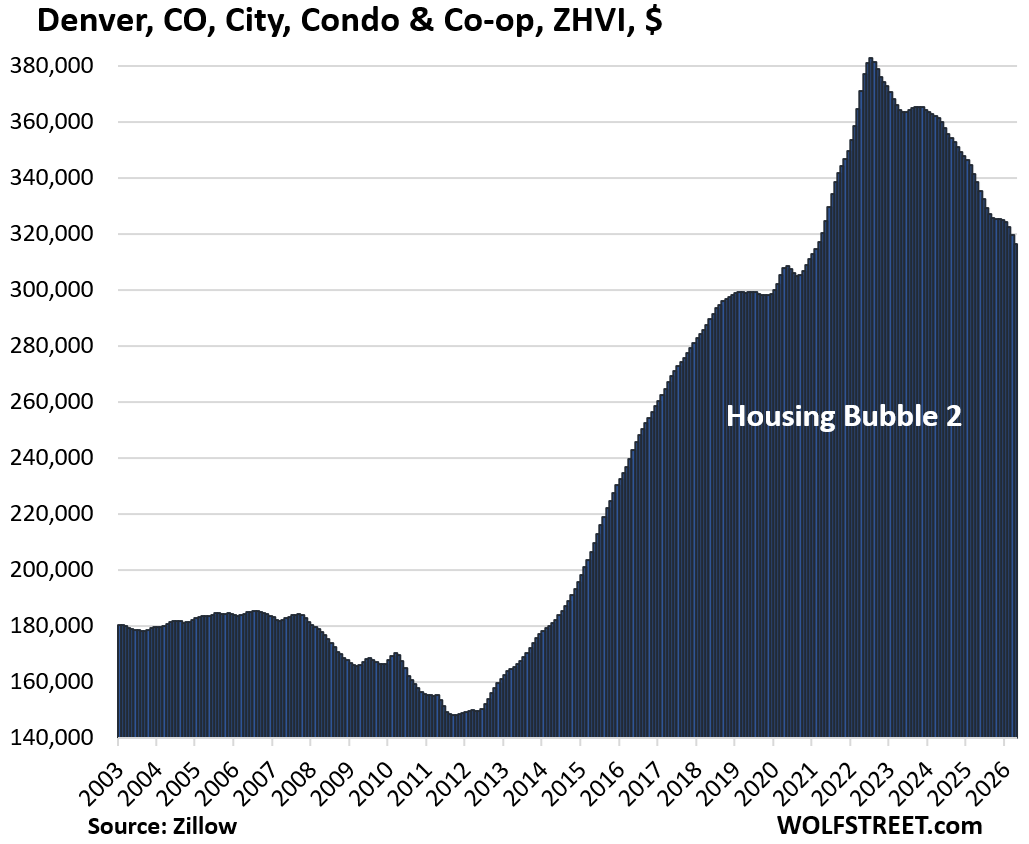
| Denver, CO, City, Condo Prices | |||
| From Jul 2022 peak | MoM | YoY | Since 2000 |
| -17% | -1.0% | -6.5% | 130% |
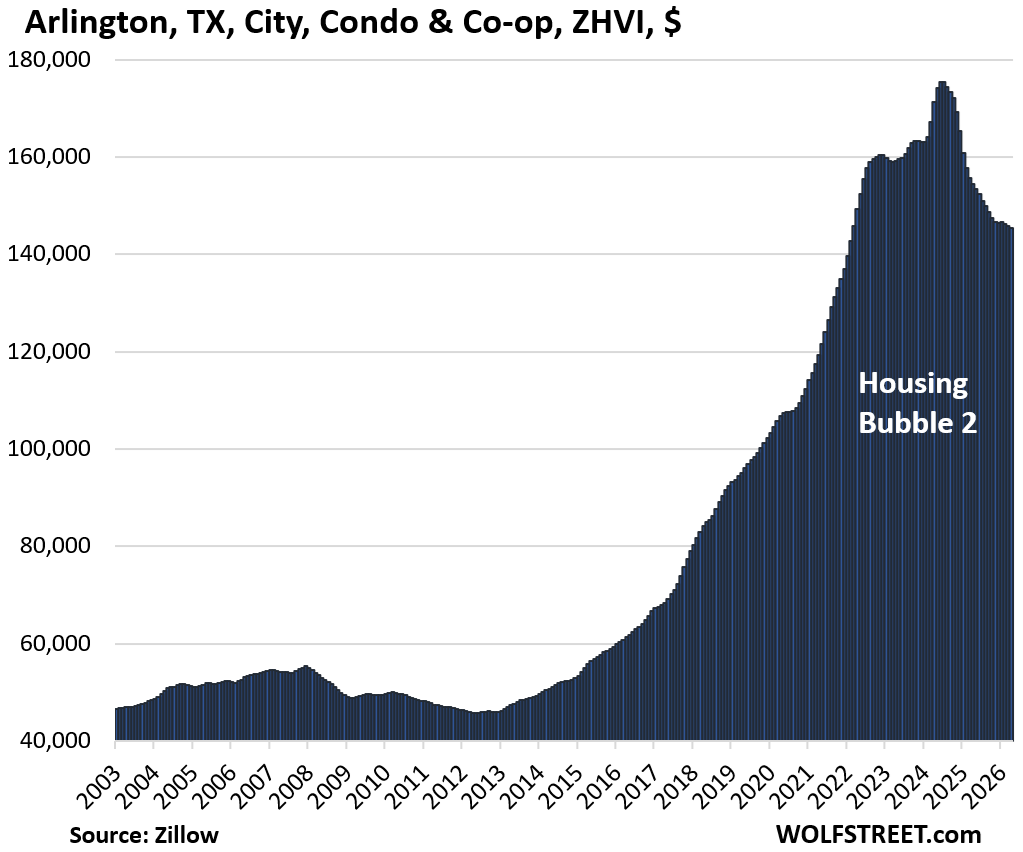
| Arlington, TX, City, Condo Prices | |||
| From Jun 2024 peak | MoM | YoY | Since 2000 |
| -17% | -0.3% | -5.8% | 228% |
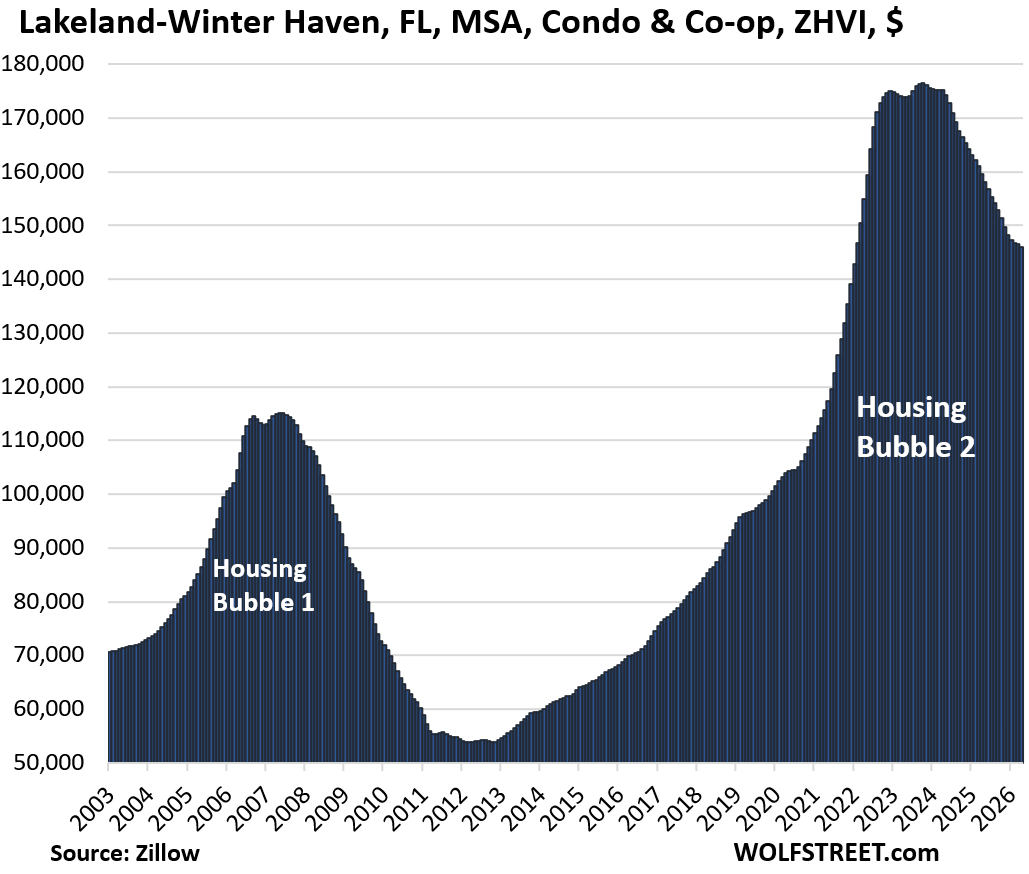
| Lakeland-Winter Haven, FL, MSA, Condo Prices | |||
| From July 2022 peak | MoM | YoY | Since 2000 |
| -17% | -0.4% | -8.5% | 125% |
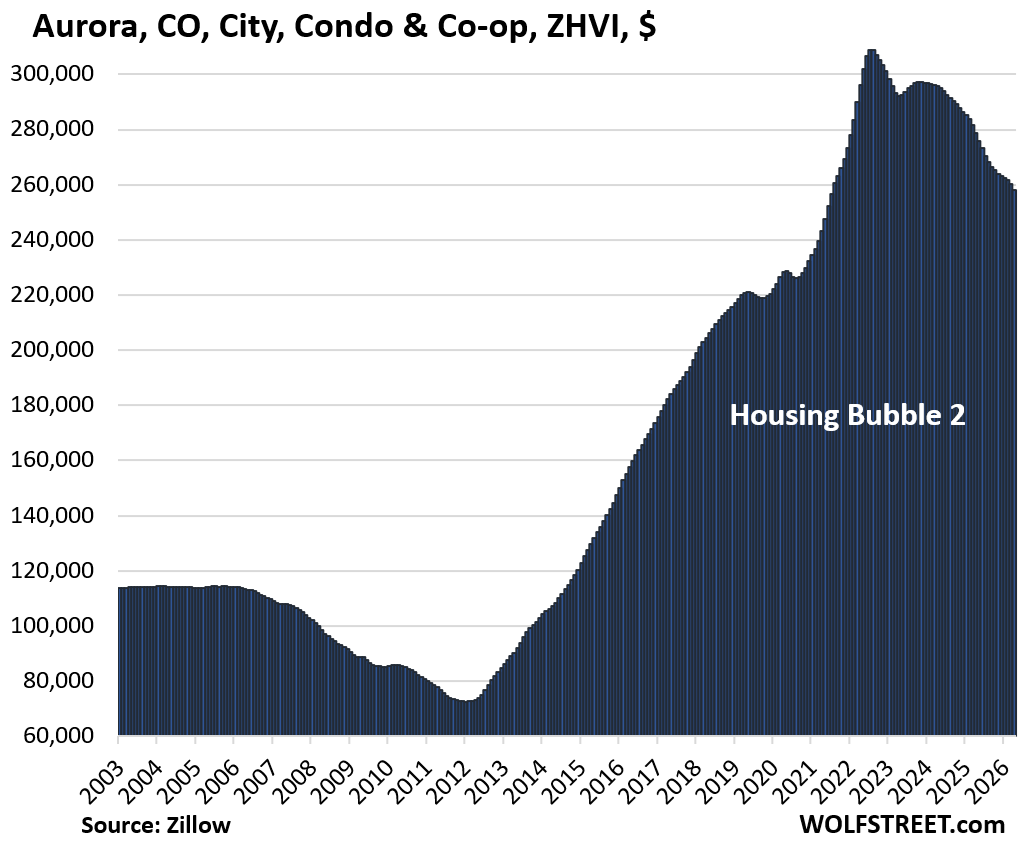
| Aurora, CO, City, Condo Prices | |||
| From Jul 2022 peak | MoM | YoY | Since 2000 |
| -16% | -0.8% | -7.5% | 196% |
| Orlando, FL, City, Condo Prices | |||
| From Jan 2024 peak | MoM | YoY | Since 2000 |
| -16% | -0.7% | -9.2% | 150.4% |
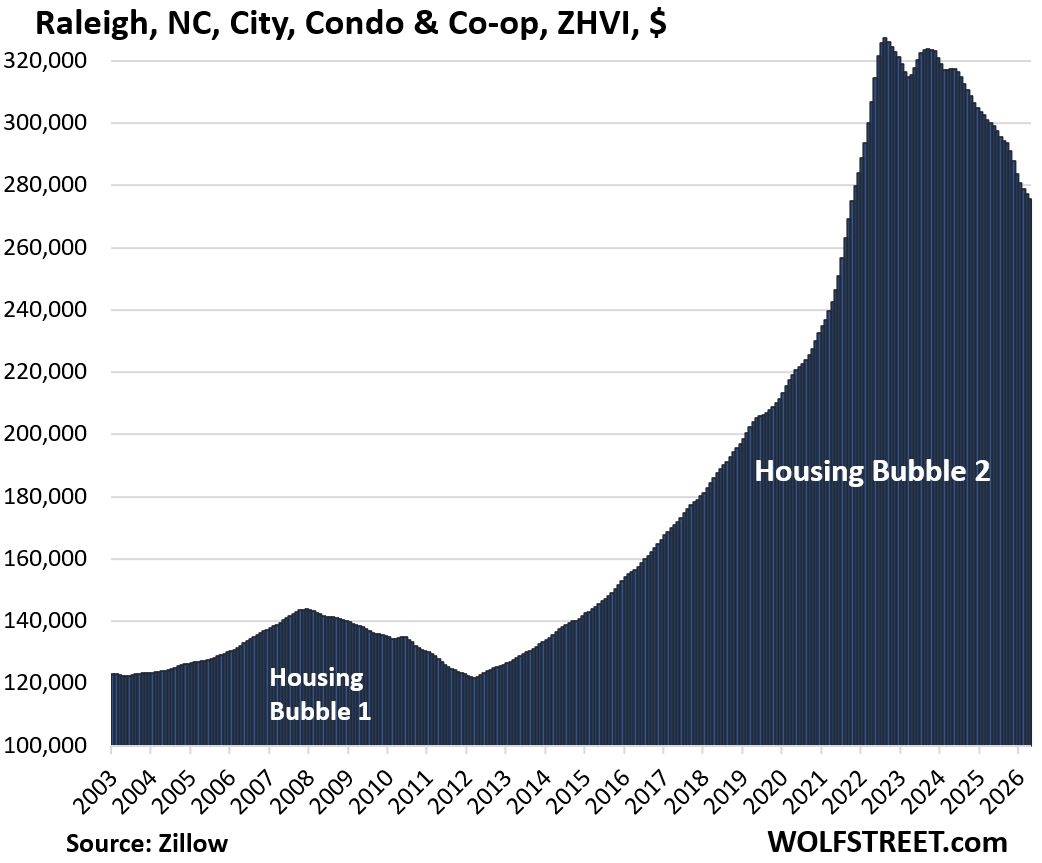
| Raleigh, NC, City, Condo Prices | |||
| From July 2022 peak | MoM | YoY | Since 2000 |
| -16% | -0.6% | -8.1% | 134.0% |
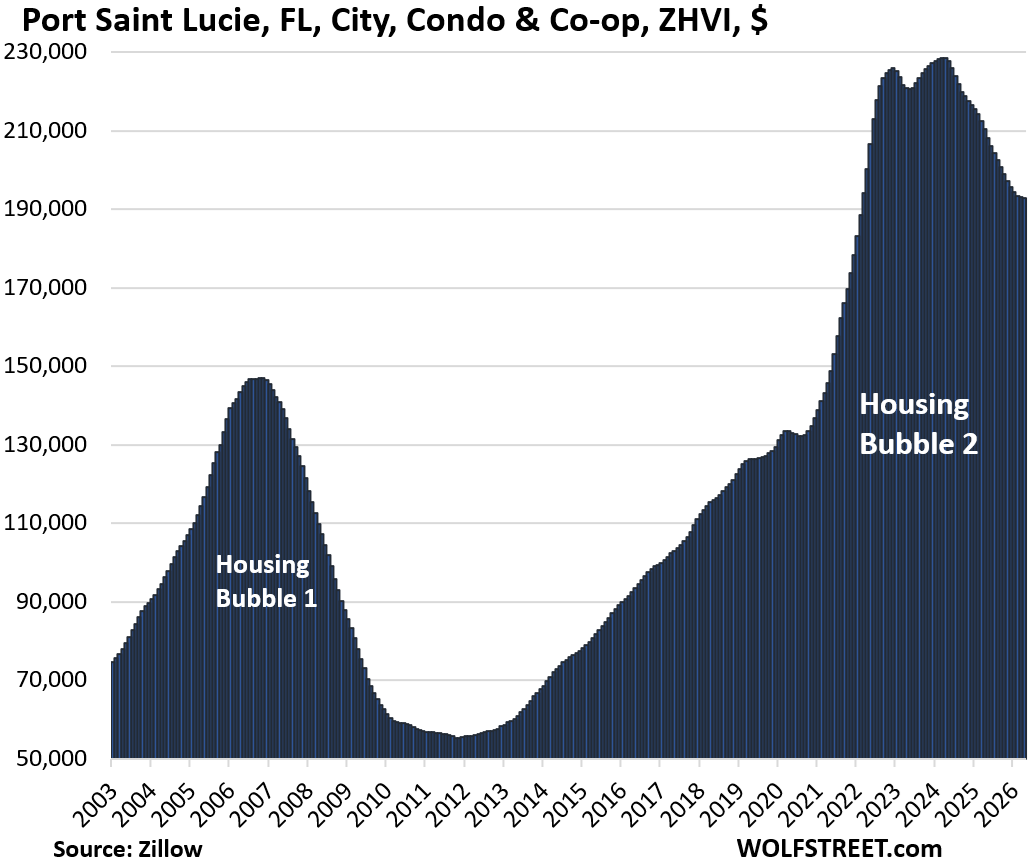
| Port Saint Lucie, FL, City, Condo Prices | |||
| From July 2022 peak | MoM | YoY | Since 2000 |
| -16% | -0.1% | -8.3% | 229% |
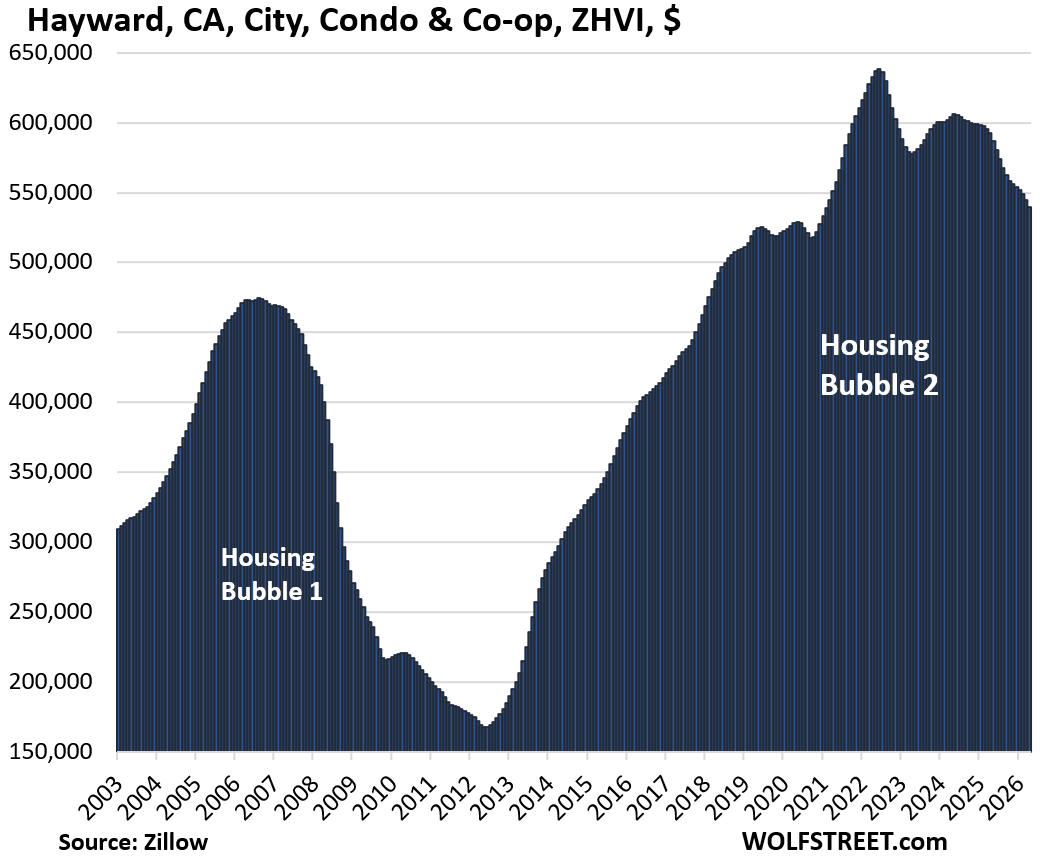
| Hayward, CA, City, Condo Prices | |||
| From July 2022 peak | MoM | YoY | Since 2000 |
| -15% | -0.9% | -8.9% | 178% |
| San Mateo County (Silicon Valley), CA, Condo & Co-op Prices | |||
| From Jun 2022 peak | MoM | YoY | Since 2000 |
| -15% | -0.4% | -5.6% | 194% |
The country forms the northern portion of Silicon Valley.
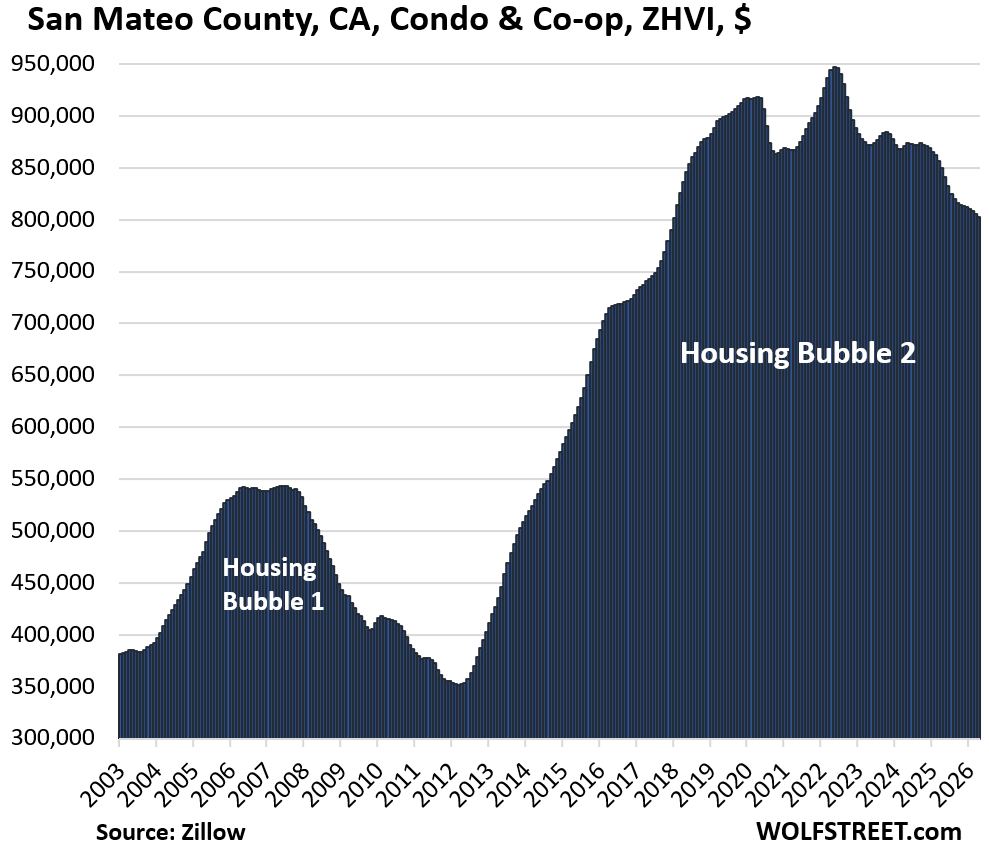
| Seattle, WA, City, Condo Prices | |||
| From Jun 2022 peak | MoM | YoY | Since 2000 |
| -15% | -0.9% | -5.2% | 133% |
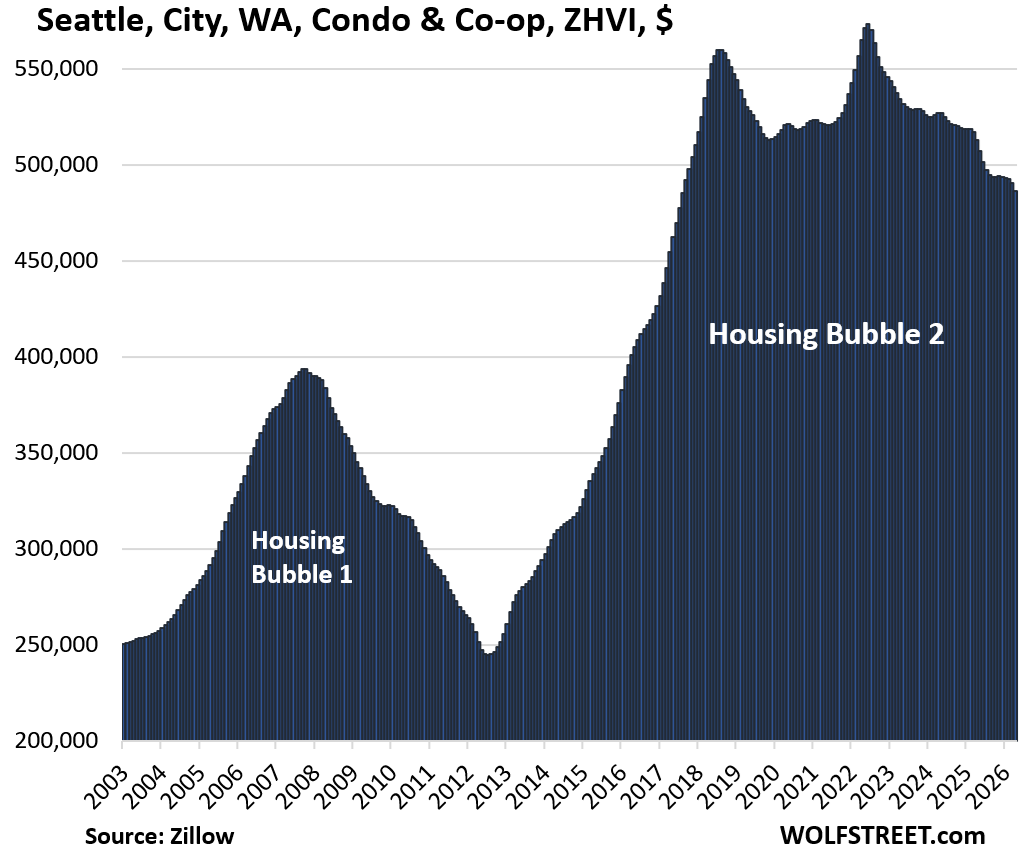
| Reno, NV, City, Condo Prices | |||
| From Jun 2022 peak | MoM | YoY | Since 2000 |
| -15% | 0.0% | -4.1% | 241% |
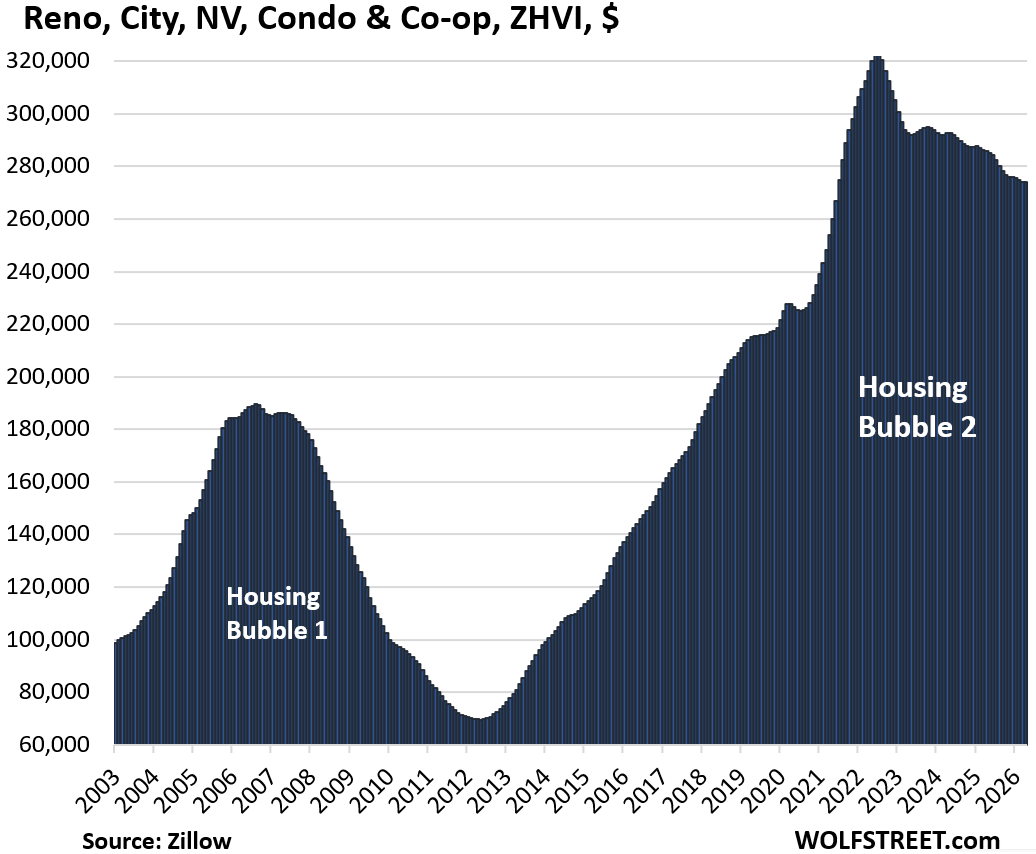
| Mesa, AZ, City, Condo Prices | |||
| From Aug 2022 peak | MoM | YoY | Since 2000 |
| -15% | -0.6% | -4.4% | 200% |
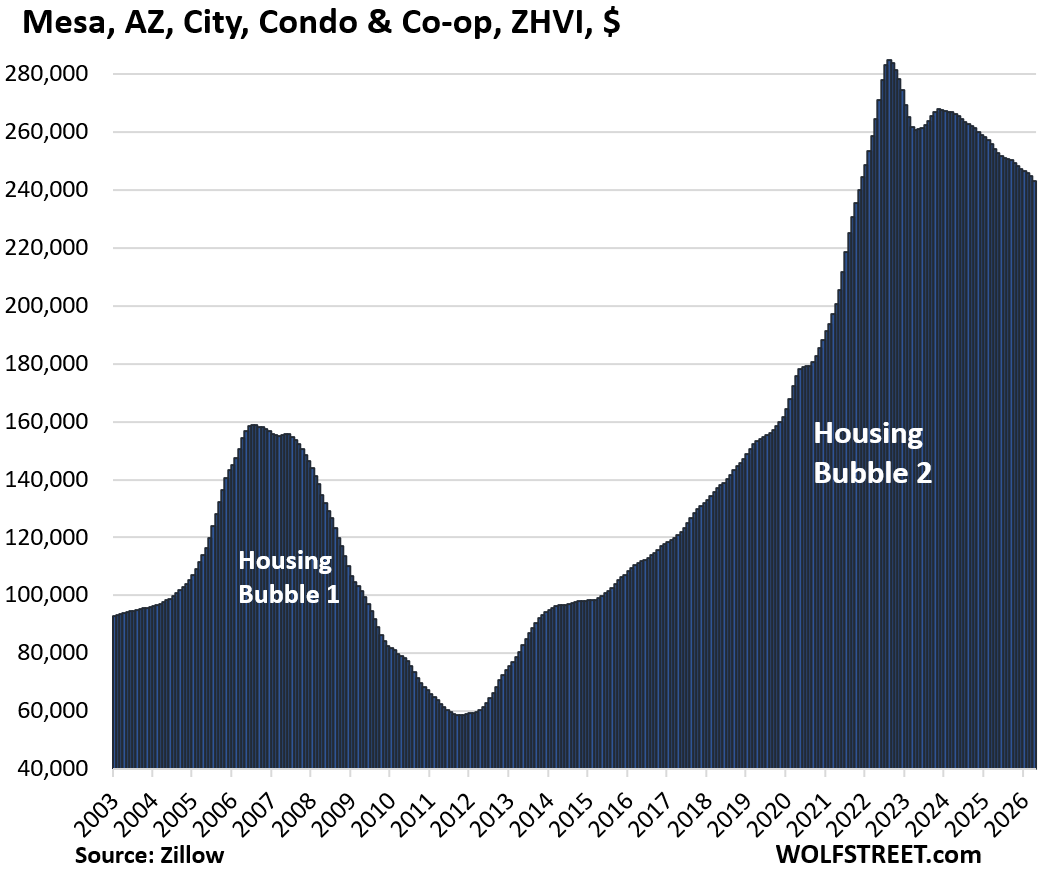
| Plano, TX, City, Condo Prices | |||
| From Aug 2023 peak | MoM | YoY | Since 2000 |
| -15% | -0.9% | -8.6% | 126% |
Condos as home, rental property, or speculative bet.
Some people buy condos as a home to live in an urban center or along the shore, to enjoy the big views, nice amenities, or central location. They value the worry-free living, such as not having to mess with maintenance, repairs, and yardwork; or having staff at a desk by the front door. Some value not having to climb stairs, etc.
Others buy condos as rental properties as a way to get into the multifamily rental business, or they try their hand at short-term vacation rentals. Or they buy them as vacation homes. Others, especially nonresident foreign investors, buy condos to park some cash in the US and watch the price spiral higher from a distance. It’s these investors and speculators that make condos particularly speculative.
A reminder of the special issues that condos confront:
- Over the long term, land appreciates, most buildings depreciate to zero and are eventually torn down. The land that big condo buildings sit on can be very valuable, but each condo owner only owns a tiny slice of it. The rest of their investment is in the building. A single-family house may sit on less valuable land, but the homeowner gets 100% of any appreciation of the land.
- Prices that exploded over the past few years ended up being way too high, once the mania settled down.
- Hefty special assessments – or the fear of them – for long-neglected major repairs dog some older condo buildings.
- Big increases in HOA fees at many properties, partly driven by spiking insurance costs in natural disaster zones, add substantially to the monthly costs of condos.
- If a condo building is on Fannie Mae’s Blacklist, financing a unit in that building gets very difficult, and sales may be limited to cash buyers who’ll exact their pound of flesh.
- The Free Money has ended, and mortgage rates are roughly back to a normal range. Buyers of single-family homes face the same issue.
- Foreign-based owners who’ve had it with the US and want to sell. And there are fewer foreign-based buyers.
- Investors in condos as rental properties are facing stiff competition from a wave of newly completed higher-end apartment buildings that developers are trying to find tenants for.
And in case you missed it: Prices of Single-Family Homes already Down 10% to 26% in these 15 Bigger Cities: Every Market is Different
Enjoy reading WOLF STREET and want to support it? You can donate. I appreciate it immensely. Click on the mug to find out how:


What age group tends to dominate amongst condo owner-occupiers?
Is the loss in capital value going principally to affect them or their heirs?
I was a young guy when I bought my first condo, but I lived in it. Many condos are investment properties for rentals, or vacation rentals, and others are second homes, esp. in Florida.
Hi Wolf,
I enjoy your articles immensely, they are well researched, timely and thought provoking.
In an age where anything the US government says is suspect and propaganda, I seek out independent and respected information sources, which I support with my humble small donations.
You have joined the list.
Thank you and please keep up your exceptional work.
Great article. The gagging at high prices has finally turned into full vomit, and vomiting always seems to proceed in waves.
It would be interesting to see the full up wave in the 2009 peak (e.g. fr Cape Coral, which I have always followed) for a full cycle view, if possible.
Thanks for the article and the invaluable perspective.
What worries me is the RE tax will need to be reduced as value falls. What does the tax district do to compensate? The was one of the result of the Depression as the tax wasn’t reduced quickly and counties became the owner.
The local governments can reduce their budgets to where they were 5 years ago…
With substantially more people to take care of.
It is not just the high sale prices, it is the condo fees that have sky rocketed with them.
Prices on condos and homes are still up dramatically from 2020. How do these increases compare to inflation of other assets, and what do the market forces (economic, demographic, etc) portend for the next 5 years?
If you’re comparing from 2020 to now, prices in some areas look very reasonable. As an example, I’ve been tracking condos in a ski town where we eventually plan on spending a huge chunk of our retirement time. Some condos are back to 2019 prices. One particular example sold for $350K brand new in 2019 and today it’s listed for $325K. When you look at that particular example, seems like a bargain. We will continue to watch and see if that is just one anomaly or if this is the beginning of a trend in this ski town.
The difference is we don’t NEED a condo. We have about 10 years to go, but you have to start planning these moves in advance in my opinion. What’s the economic outlook in 5 years? Hell, if you can figure that out, you can start an economic predicting service that charges users a monthly subscription……oh….wait…..those services exist already. Nobody knows. There are macro signals in some things, but in reality nobody knows.
One also has the option of renting condo for say 3-4 months during the season they are interested in being there.
Although in Florida, it could be said the interesting months are during hurricane season and watching long gas lines or the truly desperate, chasing after tankers like a scene out of the Road Warrior and empty store shelves.
Exactly right. I have run the numbers on multiple ski towns, and even with these modest corrections, it’s still a much better value to do a STR. Property prices will need to fall a lot more for the math to change in favor of buying, ignoring the hassle of having to bring your gear with you each time you visit.
America, land of the choices. It’s a beautiful thing.
Inflation in general was $185 in 2026 per $100 in 2003. Therefore, take the 2003 price and multiply it by 1.85. You can see that many of these condo prices in 2026 are not keeping up with inflation over the 23 year period.
Seems weird, since housing prices in general are about one third higher than they were in 2003 even after adjusting for inflation. But I suppose if the first bubble was especially bad it could be true.
Yeah, I double checked and this isn’t true. Inflation is up 97% since 2000. Every single one of these markets is up by more than that, many by a lot.
Excellent summary of the situation IMO Wolf. Thank you.
Also my opinion that, at least in FL with the various and extensive issues facing condos in general as you mention, and condos anywhere near saltwater in particular, prices still have a long way to go down…
A friend told me recently that he was looking at gulf front condos in the Saint Petersburg beaches area priced at $70K.
I told him to check the maintenance requirements thoroughly, he did so, and backed off even at that price…
Wolf,
I closely follow housing trends in many US markets. A retired CEO friend recently recommended I start reading you, and I’m impressed by your research and especially the graphical presentations of different real estate markets. I’ve not seen this anywhere else. Please continue what you’re doing!
A donation check is on the way.
Thank you!!
Still high and now there is likely hesitancy to buy because the market is perceived to be falling. Who wants to buy figuring the market will only fall further? The HOA fees really have a chilling effect. They may be more/less than a comparable home, but they are fixed while there is some wiggle room with homes as to how/when to pay for repairs/maintenance.
In Q1 2020 JP raided people’s bank accounts to save the economy from a total collapse. The Nasdaq took off until Nov 2021. In Nov 2021
The 10Y was 1.5% and TIPS were (-)1%. The spread: 2.5%, the same as today. Last week SPX reached an all time high, but Commercial RE, Condos and SFH were lagging behind. The new industrial revolution is on. The health sector, education and the industrial sector will benefit the most from higher productivity. Investors from all over the world will park their money in those promising sectors. Payroll
and income taxes collection will rise.
What does it mean: 10Y minus TIPS is the same as today ?
“They value the worry-free living, such as not having to mess with maintenance, repairs, and yardwork; or having staff at a desk by the front door. “
My one experience owning a condo was a nightmare. After I moved in I realized about a third of the people living there were renting from the owner. It took forever to get anything fixed and the board was cronyistic and political. The HOA fees went up then next year and you could eat it or move. Within two years I was gone at a minor loss. The HOA fees continued to go up after I left. They eventually exceeded the property taxes! It was not a luxury community.
You don’t own your home when you ‘own’ a condo.
Does one “own” a paid off home if they have to cough up property taxes each year?
As both a home owner and landlord, tenant pays for the taxes built in to the rent charges. Actually, as the rental is fully paid off my awesome tenant gets a deal/break on what I charge and his rent pays all property taxes and insurance on both properties. Win win. I don’t get the tax vibe. We all benefit with an educated population. We all use the roads, and where I live medical is completely covered. I have always thought of taxes being like a community barn raising. Sometimes it is better to pitch in and do things in a group/community to get things done.
And condo prices are really dropping in BC. Big time. My nephew will soon be able to get into the market in Victoria, an expensive city for sure. He is 29.
regards
You are paying for the privilege of not having to defend your possession from being stolen, defaced, or damaged by others. Also for the privilege of having teachers, firemen and health care.
Like a big HOA.
Tell that to someone who pays property tax in Baltimore lol
If there’s any way to lose your home, or that limits how you use it, you might make the argument that you don’t own it, at least under a sufficiently expansive definition of ownership.
– Forfeiture for taxes
– forfeiture for any other debt
– zoning restrictions
– any other usage restrictions
– insurance rates for likely disaster become unaffordable
– job or health requires moving and selling at a loss
– location becomes not worth living in
Some of these items are a more or less a known entity when you purchase. For example, taxes can be calculated at purchase; any increases, while not fully in your control, have a deliberate process before they can be made.
Most of these items also allow you to back out of ownership by selling, although there is no guarantee that you will get a good price.
You can go back to pioneer days and protect your property rights via your own hand. But I bet in reality you’re the type to complain about a pothole.
HOAs have skyrocketed. In Seattle they are regularly $1/sf or more, up to a third of the going rent.
That mostly is driven by increased property values, which increase the HOA property taxes and insurance premiums. Dame issues exist for SFH.
I had a great experience owning a townhouse in Fremont, CA. I read the budget, rules and covenants before buying. I even served on the board. We didn’t have amenities. We had plenty of reserves because the board members cared about their property values.
As for renters, I don’t see the difference between a renter and an owner. There are good people and bad people. I have had bad neighbors despite living on acres and no shared walls!
One of the follow on problems with the property value “deflation” is that a percentage of the owners have use that equity to finance other things. That’s fine if it’s an investment that grows and you can cash out, but in many cases it’s been used to support a lifestyle.
This was, and continues to be, a problem in Europe where properties have been used to secure loans, which are now underwater. The banks holding the loans can’t foreclose, because they can’t afford the write-off. There are a fair number of properties I’ve looked at over the past three years that are for sale, but for unrealistic prices, because they have to cover the liens.
Totally anecdotal comment follows …
We live in a “can do minimum” in one of the western suburbs of Chicago. (DuPage County)
We picked it because it is a very walkable downtown suburban location. The “price” of similar units in our building has been slowly inching upward.
We are lucky that our Condo Board is filled with Mechanical Engineers who like to do light maintenance. They are a good bunch of folks.
HOA fee has been rising about 1% a year higher than CPI.
We feel lucky.
A major risk, though, is what *contractual* protection a condo owner has against less civic minded HOA boards (who sign off on HOA expenses, quite frequently with a cavalier and possibly bought-off attitude).
Unless you have specific written rights against the HOA board (or live in one of the few states that aggressively police HOA boards) your only recourse (and a fractional one at that) is to engage in a knock-down drag-out HOA election fight a la Seinfeld’s “La Boca Vista” example.
In most cases, it is like playing Russian roulette with 4 of the 6 chambers filled. Even an honest board may be financially passive or just outright ignorant.
(And an emerging risk, as HOA assessments soar, is that a bent *developer* may write in ongoing financial rights for *themselves* or just de facto run the HOA…or have some cut-out group do their bidding for them. As the monthly forever fees escalate, the rewards for crookedness soar).
It was one thing when HOA fees were under $100 per month but I’m seeing HOA fees in LV in excess of $750 to $900.
True that. There is risk in everything.
I do attend – via Zoom – the Condo Association (HOA) meetings.
They seem pretty up-and-up fair to me.
So far.
Looks like a positive direction but unclear how soon money will be pumped into the system and where things will ultimately head. While not unusual it looks like US government will try to backstop loans to foreign companies for AI purchases. Politicians seem to feel the entire economy is to big to fail when it seems like what is needed is some form of bust cycle. Feels like earthquakes where if you don’t get a series of small ones, you end up with a huge one. Feels like bond markets might be finally catching on.
It will all work out in the end…People get way too hyped up about things.
Why do you label Texas cities graph with housing bubble 2 when there was no housing bubble 1.
1. Those are the names of the nationwide Housing Bubble 1 and Housing Bubble 2. There are also places that had a Housing Bubble 1 that then collapsed, and no Housing Bubble 2 (such as St. Louis).
2. Local markets have had housing bubbles and busts for eons. But those two are the first nationwide housing bubbles in my lifetime, which is why they’re called that way.
3. Texas (Colorado, Oklahoma, and a few other places) missed Housing Bubble 1 because it was just recovering from the housing bubble in the early through mid-1980s that then collapsed spectacularly, taking down many single-family landlords and banks, including M Bank, the largest bank in Texas, which was my bank at the time, the second-largest bank failure in US history at the time, behind Continental Illinois. By the time 2000 came around, Texans (Coloradans, et al.) had become prudent about buying homes, and they sat out the craziness going on in much of the rest of the country. But memory is short, and the homebuyers 15 years later didn’t remember it and ran up home prices.
The G kept gutting interest rates until more/most states got infected with the housing inflation of Bubble #1.
This is what passed for economic stimulus – ZIRP-created unsustainable asset inflation thought to goose spending (for a minute) due to phantom wealth effect.
It ain’t growth if it is rooted in an unsustainable delusion.
There was a bubble in TX in #1. I lived in Austin at the time and there were half-completed condos and I personally bought a condo at 70% its 2006 transaction price in 2010.
It just recovered quickly due to migrant influx from places like the rust belt where there were zero jobs. Can’t tell you how many midwesterners I met who decided to move and work minimum wage in a place with good weather and ample young people rather than grey slush and middle-aged oxy junkies.
Wolf, based on the current “Paywall” ad, if you don’t receive enough contributions, you might be able to make it work with proceeds from a personal injury lawsuit!
On a more serious note, are we now starting to see an uptick in foreclosures in the locations where prices have dropped by 20+ or more? If people can no longer sell the property and pay off the loan when they get into trouble, it seems like foreclosures should start going up.
Single family foreclosures are still at record lows. Multifamily delinquencies are very high, as are office delinquencies, but foreclosures don’t seem to have spiked yet.
Note that transaction volumes are not plotted, so it doesn’t really tell you much about the price distribution in the market.
HOA is the biggest obstacle for condos and townhomes if you’re paying for amenities. If the community just pays for exterior maintenance and insurance, the cost may be justifiable. But amenities are risky because of services inflation. Special assessments are a major concern if the HOA that doesn’t have enough reserves to cover exterior maintenance as well as upkeep of facilities. Plus remember an HOA can place a lien against the property for unpaid dues. Each community is different, so extensive research is required to ensure your purchase doesn’t leave you exposed financially. Serving on the HOA board and attending meetings also helps keep spending in check.
It’s worse with SFH though, which often have the same amenities. Much easier to spread the cost of a pool across a hundred owners than one household income. The issue is just that SFH owners tend to view the pool as an “asset” rather than “amenity”.
I just wanted to say though off topic lets all remember those who died this Memorial Day and actually all the time,perhaps we can learn some lessons here.
I personally am grateful that all me friends in Afghan/Iraq made it home in one piece,many unfortunately did not.
Buy low sell high… is what I have always been told…..
Seems like it is headed low….
Maybe …
Hmm, and 26 years ago the DOW was at 10,000. almost 14,000 in 2007 with a drop to 7000 in 2009. So a “free market” DOW at 25,000 looks possible.
Condos? Condos? Yeah, that’s fine for entertainment value. The entire condo market is so anti-free market and an aberration within the housing market. Condos are to many people a speculation/get-rich-quick market. Add on the exorbitant HOA fees and the unreasonable HOA rules and regulations, condos become many people’s living nightmare. So yeah – no wonder they have declined in some places to the peak prices of the last housing bubble. That’s still not enough!
The condo market is NOT the housing market. It’s an anomy, even deviant segment of over-regulation and over-speculation that has gone ballistic way beyond what is reasonable valuation.
FYI, here are are the cities with the biggest price declines of SINGLE-FAMILY homes:
https://wolfstreet.com/2026/05/22/prices-of-single-family-homes-already-down-10-to-26-in-these-15-bigger-cities-every-market-is-different/
I used to feel the same way. That’s why I bought a single family home in early 2020. But now I see the value of living in an HOA. If you own a house, any type of major issue like water main or sewer can easily run upwards of $100k. In a condo that cost is distributed among all the units. Another is unruly neighbors. Try calling the police about a noisy neighbor and see how willing they are to get involved. Often they won’t do anything at all. In an HOA there are ways to deal with that sort of nuisance. That’s why I’m selling the house and moving abroad for a few years. If the condo market continues to weaken maybe I’ll move back and buy. I might even move back to Oakland if prices drop another 30%. I love the Central Valley but I hate the heat. And pollution. And driving.
Kernburn:
You love the Central Valley…. But hate a very large majority of what it consists of.
Kinda does not make sense my friend.
Also…. If you live in close quarters with others whether house, condo, apartment….
You might have to be accepting that others might not live to your exact standards….and may not want to live the way you do.
Or a guy could buy 100 acres and build a house in the middle…. Problem mostly kinda solved.
Condos can be great. Just need to find a building that has been taken care of and that the HOA is well managed. My HOA isn’t too bad and covers everything but electric which averages $50 a month. Its small and easy to keep clean. No yard work, pool maintenance or projects. Single family run down shacks are twice the price in my area.
Wolf, although this youtube is sort of long with an informal discussion that is not always the smoothest communication, I thought you might find it interesting. It features Melody Wright, who has become an internet housing analyst of some note after increasing her exposure since starting out during the 2008 crisis. She seems pretty level headed to me, and likes to dig below the mainstream and headline numbers as you do. She expects that foreclosures are on the way to becoming a problem again. Both of these people mention at around 40:30 in the video that they read wolfstreet, and chuckle at your drunken sailor consumers reference.
My takeaways from this vid that were not always on my radar previously are:
– the higher amount than normal of mortgage forebearance during 2024
– the coming impact of the silver tsunami of selling housing
– the delayed impact that the PPP forgiveness has had on people who accessed the money, but that in general there will now need to be some paring back that can affect housing
Higher mortgage forbearance: Natural disasters trigger forbearance, such as when the house burns down or gets crushed by a hurricane. The lenders will work with you. So you get a couple of bad hurricanes in a year, and forbearance will jump. Wildfires will cause forbearance to jump…
In terms of foreclosures, sure they will rise, but they’re still very low, lower than before the pandemic. They just came up from near-zero during the foreclosure ban:
https://wolfstreet.com/2026/05/14/here-come-the-helocs-mortgages-housing-debt-to-income-ratio-serious-delinquencies-and-foreclosures-in-q1-2026/
I also met with a realtor friend recently who said that more foreclosures are actually happening (nationwide) than realized by most people, but are being repackaged and sold in batches to investors (sometimes foreign) who are not necessarily moving them or renting them out at this point. Which hides the real number happening because they are not reported as foreclosures. Info that is coming from industry insiders who are doing this or aware of it, apparently. I can’t vouch for that but I trust the source, who said this is hiding some of the real impacts. Curious if true. TWT.
That’s BS on every level.
1. The reason foreclosures rose is because they were NEAR ZERO during the foreclosure ban. They’re normalizing now. That’s what the data tells you. Which is also what the chart tells you.
2. A bank cannot hide a foreclosure. A foreclosure is a legal process by which the bank seizes the house and sells it to apply the proceeds against the remaining mortgage and arrearage. It doesn’t matter who the bank sells the foreclosed home to – it’s a foreclosure on the borrower’s credit record.
3. Ever since there were mortgages, lenders also had the option of restructuring the mortgage (extend terms, lower interest rates, etc.) to keep the homeowner in the property.
4. Ever since there were mortgages, lenders have had the option to agree to a short-sale, where the homeowner sells the home for whatever they can get for it, and the bank agrees to forgive the arrearage and the remaining amount due, and the homeowner walks away from the mortgage scot-free.
They are reported as foreclosures. Source: At one time a large house flipper. They are all recorded. Banks want them off their books and sell them to all manner of groups. FYI. I bought all of Detroit in 2017 when everyone including my family told me I would die in the post apocalyptic wasteland…… How sweet it is now losers.
Yeah it’s not foreclosure as those are recordable and trackable. Plenty of “extend and pretend” though in hopes that Warsh will follow through on lowering rates and get the transaction volumes up again through cheaper mortgages.
My impression was that they would have become foreclosures, but were essentially bought before they got to that point, so were not actually classified as foreclosures. I’m not in that biz, but just relaying something I was told by someone who is.
A bank cannot just take the house and sell it. People would go to jail for that. There are legal procedures for that. In some states, that happens through the court system; in others, no court is required, but it’s still a complicated legal procedure that is published and recorded.
I have dealt with your mower is too loud in the middle of the day, your cat is sitting on my fence…..you annoy me…you are unruly….
My honest opinion….
I think it is mostly ridiculous people that are not very accepting of anyone that does not do exactly what they want.
Which is why I don’t live in an HOA or condo. I am sure HOA people appreciate this as much as I do. Haha.
I’ve owned homes in two non-HOA neighborhoods and have not regretted it. But, they have both been older neighborhoods (1980s and older). I’m aware of some that were built in the 1990s, and none newer than that.
Serious question: Are non-HOA subdivisions being built anywhere these days in the US?
I was just thinking about this ״HOA epidemic.” I certainly see the prevalence exploding. The joke was always about Florida neighborhoods or whatever.
Now, I don’t know if there’s much built that is not in an HOA. I’m in Colorado. I have a friend that owns a house (really half a duplex), that is in an HOA, within a larger neighborhood HOA.
Also? There’s a housing authority that regulates the neighborhood. Interesting times.
For me? I could only afford the property I have. In a 5 unit complex, with original roof and siding (built in 1981). We have $13k in reserve (not enough to get the place painted), and are discussing a loan for roof and siding replacement.
Yay!
Did people really think $100 a month hoa was going to make a dent on future repairs?
Got a friend to sell his rental condo last year near boulder. Was around 50 units and they had less than 20k in cap reserves and still had a 175 a month hoa. He got out good.
Same hoa now is at 650 a month and are proposing 950 starting in Sept 2026 he got the notice from a mailer.
So many of these places were so poorly mismanaged tons of people are going to take a deep nose dive. But that’s what you get with speculation winners and a ton of losers.
HUCK,
I have always like non HOA partly due to no fees but mostly due to the arbitrary nature of complaints and rigidity of rules. Plus I like to part my El Camino on the front lawn.
The rule of thumb is that the closer the dwellings the stronger the HOA needs to be. If the houses are really close do you want your neighbors to be blaring music all night or parking on the lawn ? On the other hand, if the houses are
far apart, your neighbor’s actions don’t really matter except in extreme cases.
Inflation is in services.
HOA is a service.
Best to avoid unless you don’t mind the blank check aspect of it.
If you are a homeowner or homeower you get to pay 100% of those costs.
sure, time is money, right? DIY can save a lot of cash though.
My daughter owns a Condo near Dupont Circle in NW DC. There have been 2 deadly shootings in the last 6 months on 17th street, a few blocks from where her condo resides. I told her to buy in Southwest DC. Now, SW DC is affected by the sewage spill. So when you buy a Condo in DC you have a lot of variables that affect the price of your investment. So far, DC Condo prices are only down 9% from the bubble price of 2022.
Boarded Up And Fire-Damaged, This South Bay Torrance, CA House Still Sold For Over $1M
A small, run-down, fire-damaged house in Torrance sold last year for well over $1 million, real estate records show.
Built in 1955, the home in the 4600 block of Lenore Street has three bedrooms, two bathrooms and comes in at just over 1,100 square feet, according to a listing on the Berkshire Hathaway HomeServices website.
“This property has Fire Damage,” the listing reads. “BOARDED UP! Unsafe Notice posted by Torrance Building And Safety. Do Not Enter or Occupy Property. No Interior Showings!”
The house sold last summer for $1.08 million, according to the listing.
Since then, it’s been sold again, this time for $1 million as of earlier this month, according to real estate records published by Zillow. That’s not far below the average Torrance home value for April of $1.13 million, according to Zillow.
Built in 1955, the home in the 4600 block of Lenore Street has three bedrooms, two bathrooms and comes in at just over 1,100 square feet, according to a listing on the Berkshire Hathaway HomeServices website.
These kinds of articles — you copied and pasted this it seems from a tabloid, likely Daily Mail — show the absolute stupidity of the reporters or AI that wrote that. An old house is worth zero. Buildings are depreciated to zero. What has value is the land. In this case, the land was deemed to be worth $1 million and the house worth zero. Eventually, the house will be torn down and a new house will be built on the lot. The whole emphasis on the house, while ignoring the land, shows that this was written by morons for morons.
This is a 100% correct article that was published in today’s Patch, and yes, of course, the land (even this trashy little piece of land) is what the buyer is paying for in a very undesirable neighborhood of Torrance. What is moronic, of course, is any buyer paying that for this.
What makes this area in Torrance “very undesirable”? Looks pretty clean and only 10 minutes to the beach!
Actually, that house surely had negative value, given the expense of demo’ing it and following CA’s rules about recycling the debris and minimizing landfill.
Up here in Canada same story. There are floods of online accounts of pre-build condo sales going wrong as “values” are revised lower and buyers are faced with a choice of forking out more $$$, trying to walk away minus their deposit, or trying to sell into a falling market. Transaction volumes have dropped to 10- to 20-year lows in Vancouver & Toronto. And single-family houses too are falling in price; the number of “for sale” signs I see here on Vancouver Island is high, and those signs stay for a long time. This is all going to have a long-term and pernicious effect on the entire North American economy and not just for those who have mortgages.
Wolf….oh Wolf….is Tuesday’s edition out yet?
Your paid subscribers are waiting.
I promise to read the whole %#*@#!
I just got off a plane from Tokyo. So gimme a little break here. Gotta stomp out some brushfires first
Understandable! Once I went from Spain-NYC-SF. Got back and felt drunk (I wasn’t) for about 3 days – dizzy. The time zone change messed me up, big time. That was the only time I ever had major jet lag. Hope u had some good sushi!
Hello ladies and gents (any ladies?), Wolf said that I could fill in and write his next column since he’s putting out so many brush fires after his safari to Japan. He said I have free rein on the topic of discussion and the comment section will be a free-for-all. Pour your hearts out! Tell us how you really feel. No comments rejected, until the man returns to duty. Column coming shortly.
Yoo hoo! Now we’re talking. It might turn into a once-a-month gig. The man needs a day off!
🤣❤️
Comment section free for all,no need,4chan business and finance has that covered in spades!
Arlington has condos? LOL
Lots.