
Consumers spent at retailers & restaurants just fine, but Amazon Prime Day and seasonal adjustments wreaked some havoc.
By Wolf Richter for WOLF STREET.
Not seasonally adjusted, retail sales rose by 0.9% in July from June, and by 5.2% year-over-year, to $784 billion (blue line in the chart), with many retailer categories booking big year-over-year gains, according to data from the Census Bureau today.
In terms of ecommerce sales: This year, Amazon Prime Day, a huge event not just for Amazon, was in June. Then in July, ecommerce sales dipped from that spike (-2.0% not seasonally adjusted), but less than last year after Prime Day month (-4.4%).
But in 2025, Prime Day was in July, and so the year-over-year gain of 6.2% in July 2026 (no Prime Day) was measured against July 2025 (with Prime Day). Ecommerce has become the #1 retailer category; it moves the needle.
And the acid test for consumer discretionary spending: people splurged at restaurants, bars, delis, cafés, and other “Eating and drinking places.” Sales jumped month-to-month and by 6.0% year-over-year, no slowdown in sight.
Not seasonally adjusted, year-over-year:
- Miscellaneous store retailers (includes cannabis stores): +11.6%
- Ecommerce, despite the shift in Amazon Prime Day: +6.2%
- Food services and drinking places: +6.0%
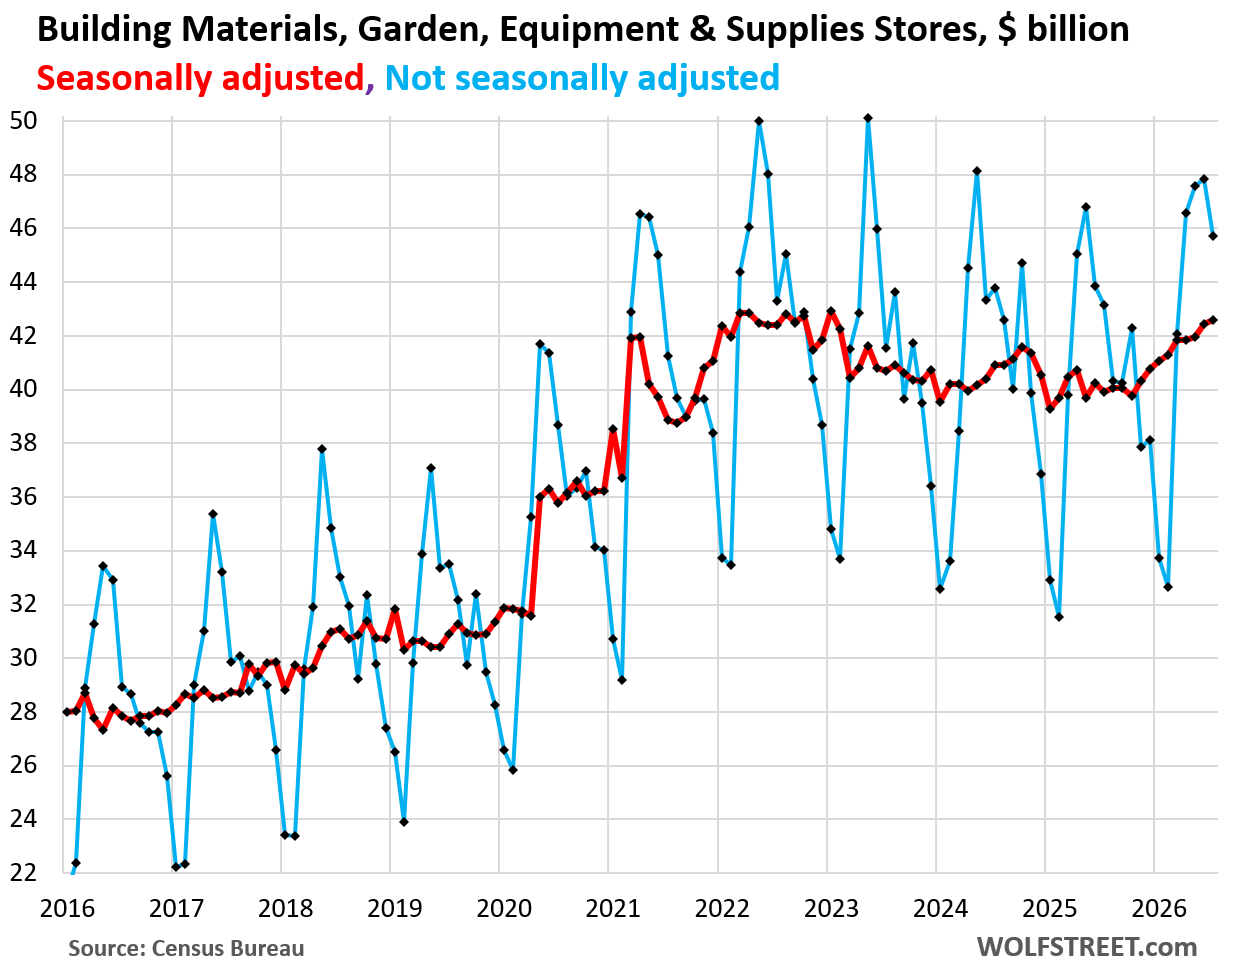
- Building materials, garden equipment & supplies dealers: +5.9%
- Clothing & accessory retailers: +5.4%
- General merchandise retailers: +4.5%
- Motor vehicle dealers: +2.0%
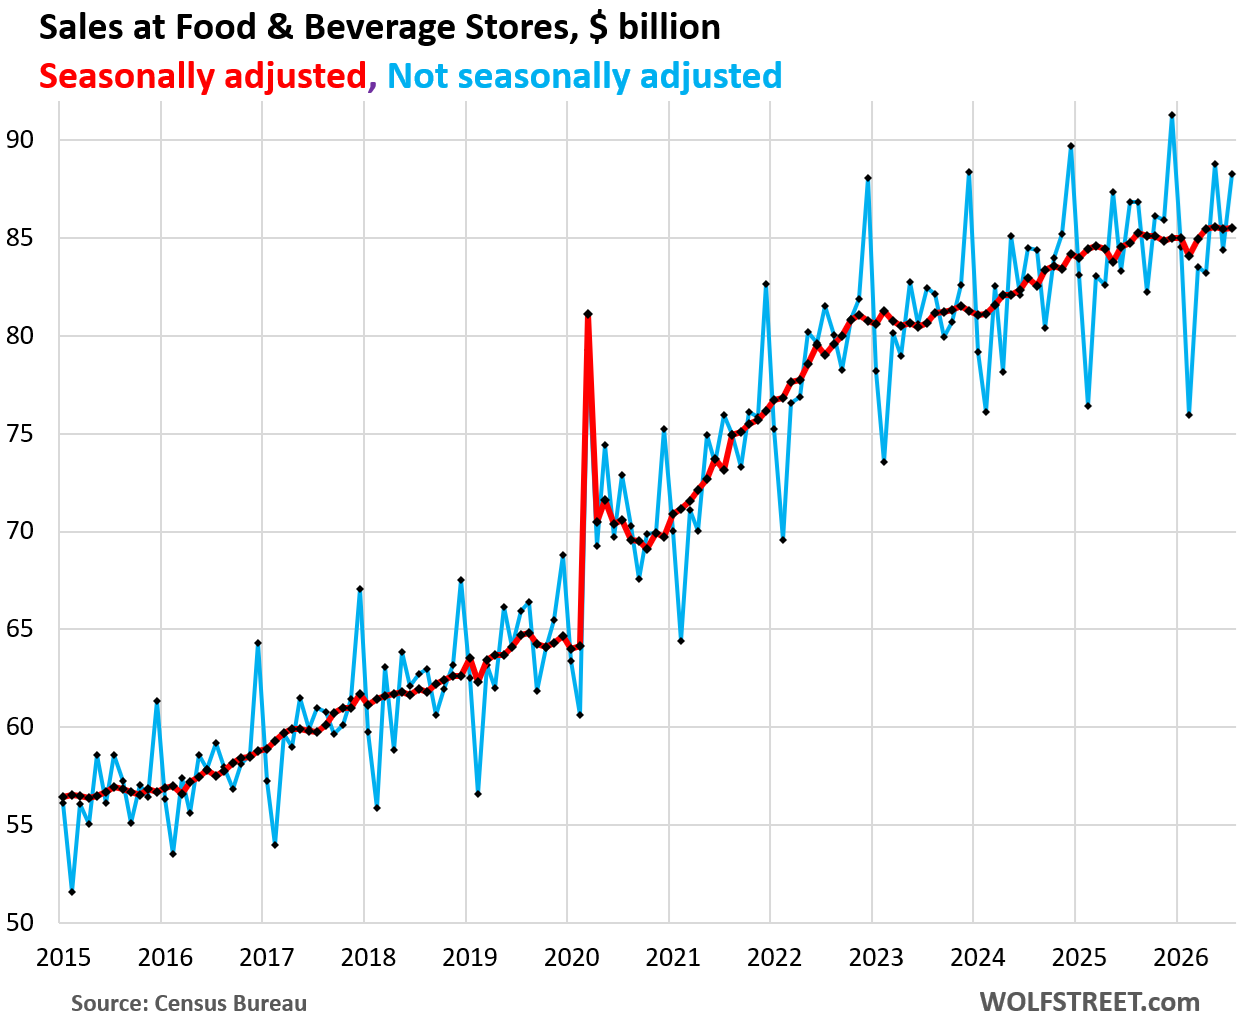
- Food & beverage stores: +1.7%
The seasonal adjustments knocked sales down by 0.6% in July from June, to $763 billion, but they were still up by 5.0% year-over-year (red line).
Not seasonally adjusted, sales always spike in December, the high of the year, then essentially collapse in January/February (blue line). Seasonal adjustment factors attempt to iron all that out. Over a 12-month period, the seasonal adjustment factors sum up to zero, so if they go awry in one month, they’ll correct in another month.
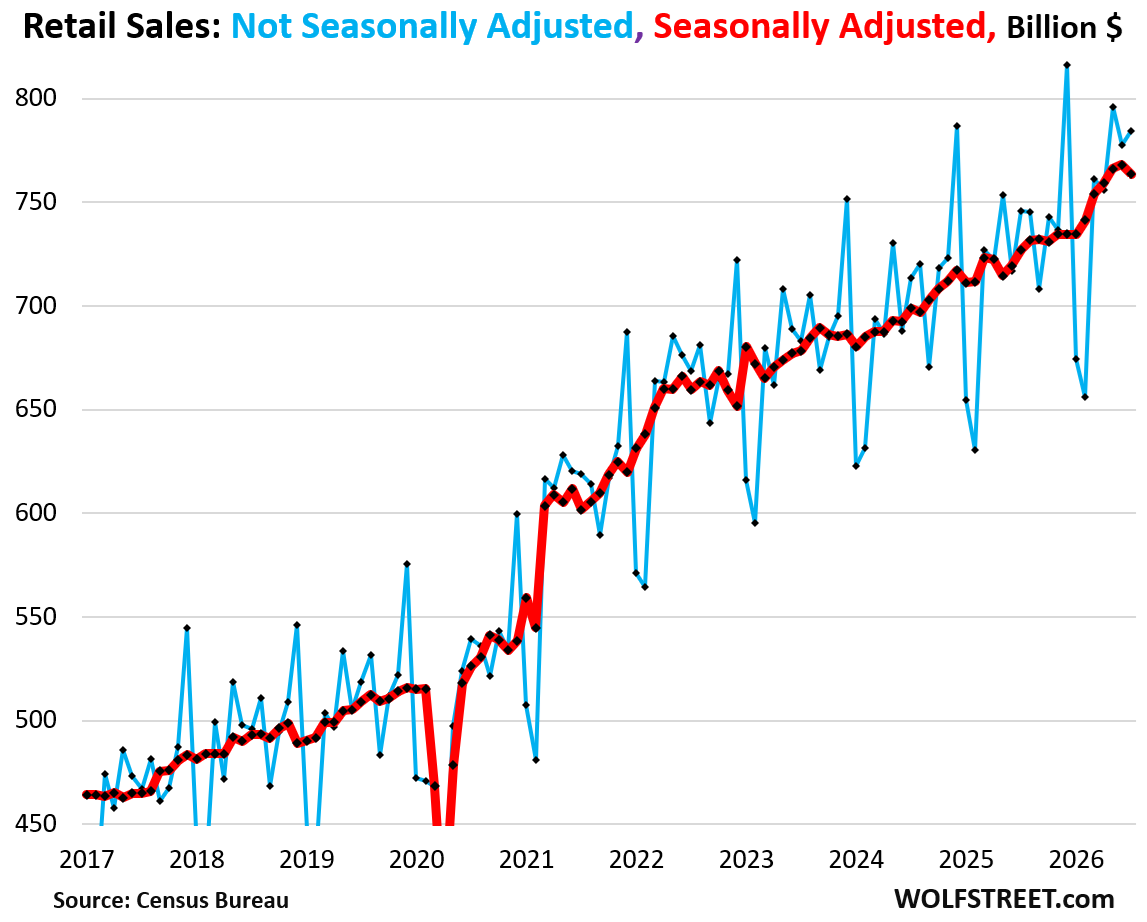
Seasonal adjustments are complex; they’re handled by the Census Bureau’s X-13 ARIMA-SEATS software program, based on numerous historical data points, to account for seasonal variations caused by things such as weather patterns, holiday gift buying, and differences in the number of “trading days,” which exclude weekends and holidays, which can be problematic because many retailers are open 7 days a week, and ecommerce is open 24/7.
Seasonal adjustments are trying to make month-to-month changes meaningful, but they can go awry, and it’s sometimes good to look at both, seasonally adjusted sales (red) and not seasonally adjusted actual sales (blue), despite their large seasonal fluctuations.
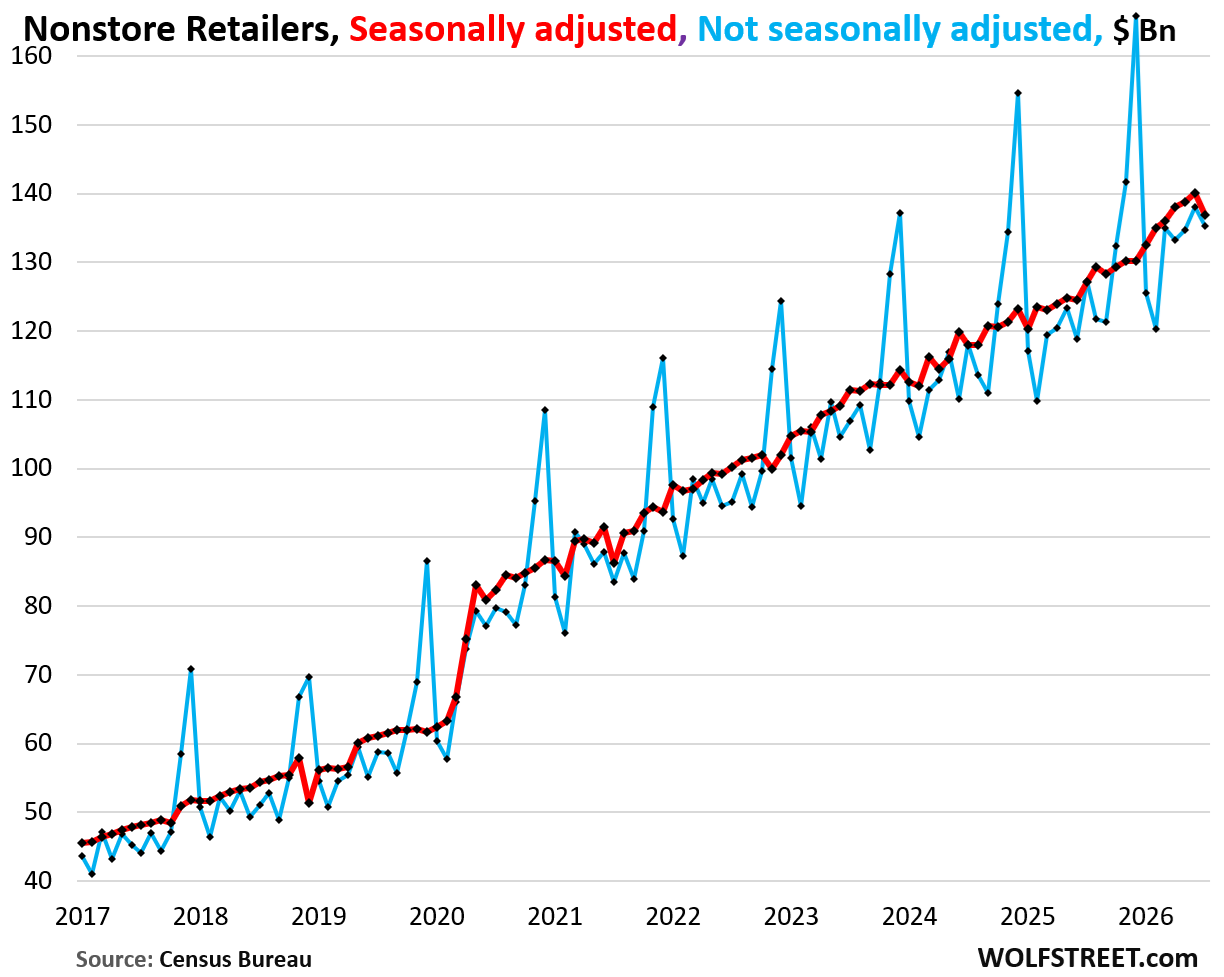
Ecommerce: the mess around Amazon Prime Day. In June, ecommerce sales had been boosted by Amazon Prime Day (+2.4% month-to-month, +16% year-over-year, to $138 billion, not seasonally adjusted).
And in July, sales came off that Prime Day boost, falling by 2.0% month-to-month, to $135 billion, but where still higher than in May, and were up by 6.2% year-over-year.
But, but, but… In 2025, Amazon Prime Day was in July, not June. And so the 6.2% year-over-year increase in July 2026 (without Prime Day) against the huge July 2025 (with Prime Day) showed a lot of strength in ecommerce spending.
In August 2025, sales had fallen by 4.4% from Prime Day July. In July 2026, sales fell by only 2.0% from Prime Day June, which confirms this strength in spending.
It’s not that consumers cut back or are collapsing or whatever. It’s that there was Prime Day in June, complicated further by the fact that last year, it was in July. And seasonal adjustments made the whole thing worse.
Ecommerce retailers have become the #1 category on a 12-month basis, accounting for 18% of total retail sales. They include sales by the ecommerce operations of brick-and-mortar retailers, such as Walmart (one of the largest ecommerce operations in the US), Macy’s, Costco, Target, and all the others. Even grocery sales are migrating in more consequential numbers to ecommerce.
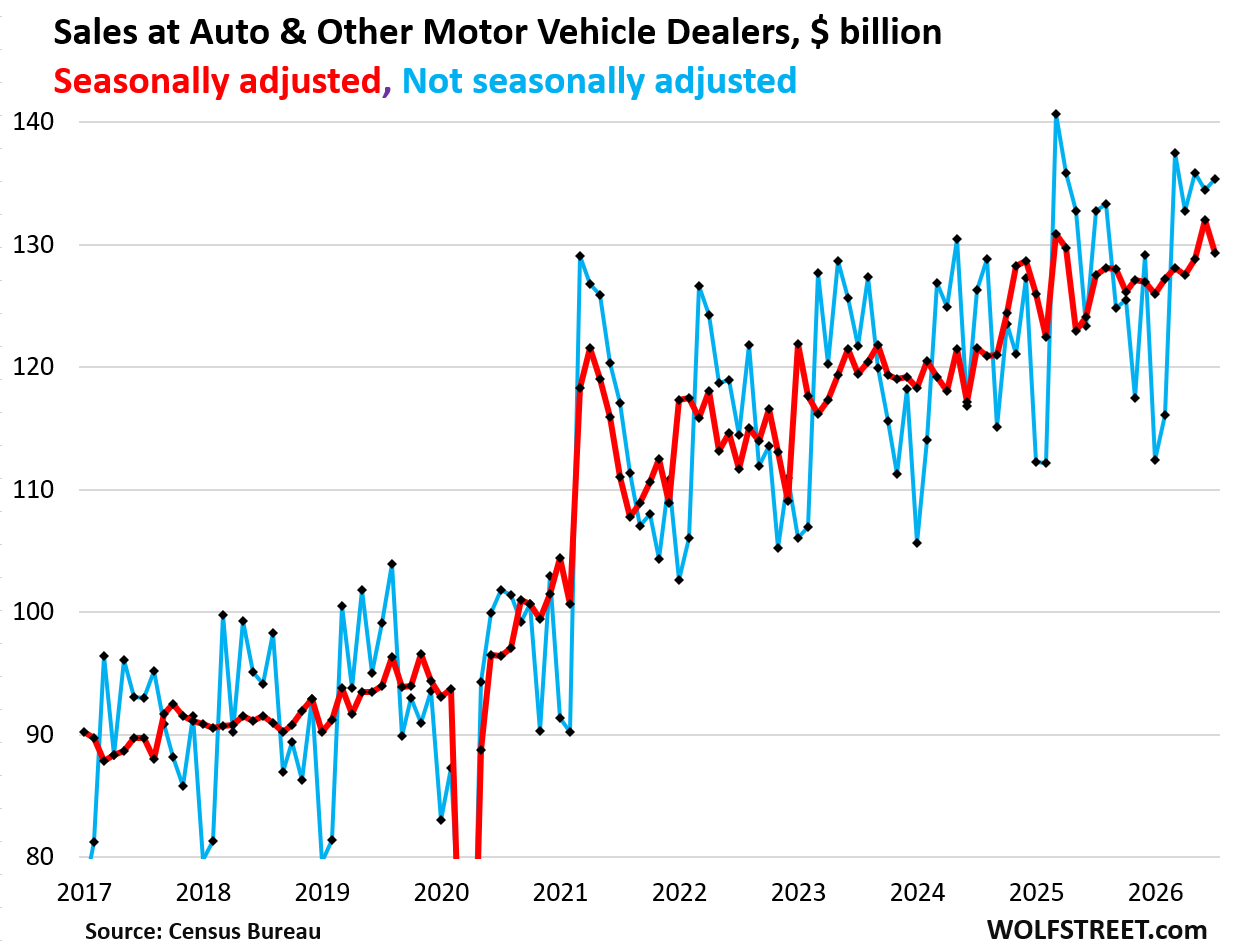
Sales at motor vehicle dealers rose by 0.6% in July from June, and by 2.0% year-over-year, to $135 billion, not seasonally adjusted (blue).
Seasonally adjusted, sales got knocked down by $6 billion to $129 billion, down by 2.0% in July from June (red).
And inflation is not helping sales. The CPI for used vehicles declined in July from June (-0.2%) and year-over-year (-1.8%); The CPI for new vehicles also dipped a hair in July from June and was up only 0.5% year-over-year.
Motor vehicle dealers, which include auto dealers plus dealers of motor cycles, RVs, ATVs, snowmobiles, etc., were long the #1 category of retailers, but like other retailers, have lost ground to ecommerce, and have been surpassed by ecommerce during the current 12-month period, and their share dipped to 17% of total retail sales on a 12-month basis.

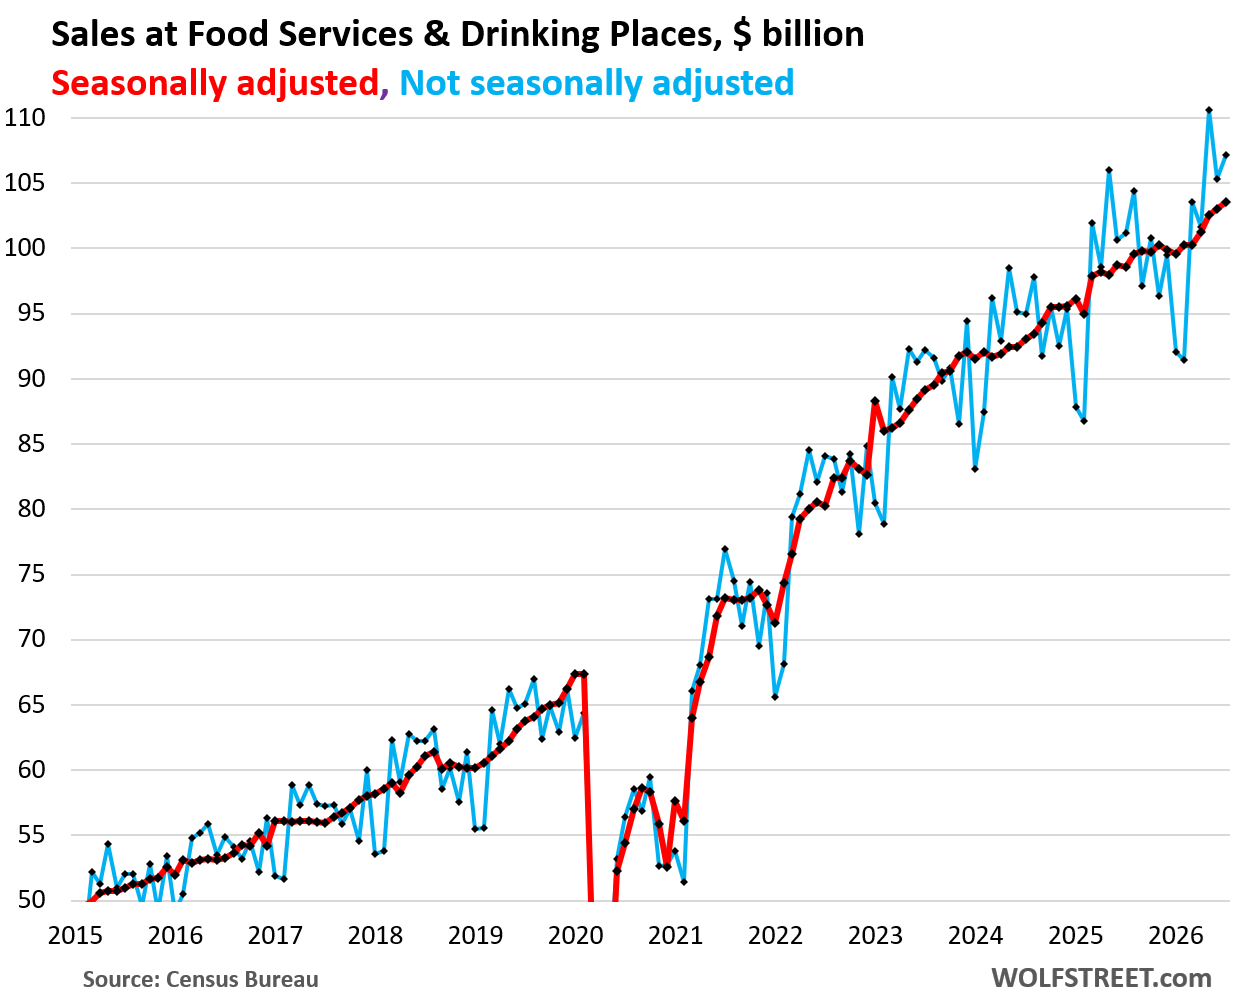
Sales at restaurants and bars jumped by 1.8% in July from June, and by 6.0% year-over-year, to $107 billion. Seasonally adjusted, sales rose by 0.5% month-to-month.
Sales at these “food services and drinking places” are a barometer of consumer discretionary spending, of people splurging, doing stuff because they want to, not because they have to, and it has become the #3 largest retailer category with a share of 12% of total retail sales. Another sign that consumers are out there dropping money left and right.
The sales increase of 6.0% far outran the rate of CPI inflation for “food away from home” of 3.4%.
Sales at food and beverage stores bounced by 4.6% in July from June and rose by 1.7% year-over-year, to $88 billion. Seasonally adjusted, sales have been essentially flat for four months.
More grocery sales are migrating from brick-and-mortar stores in this category to “general merchandise stores,” such as Walmart and Costco (see “general merchandise stores” below) and to ecommerce (see above).
In a decades-long trend, food purchases have also wandered off to restaurants (see above). Spending in restaurants began to exceed spending at food and beverage stores in 2019, and the gap has dramatically widened since then.
The year-over-year increases have been below the rate of CPI inflation for “food at home” (purchased at stores and markets) of 2.7%, which illustrates the competitive challenges this category of retailers faces against General merchandise retailers, such as Walmart, Costco, etc., ecommerce, and restaurants.
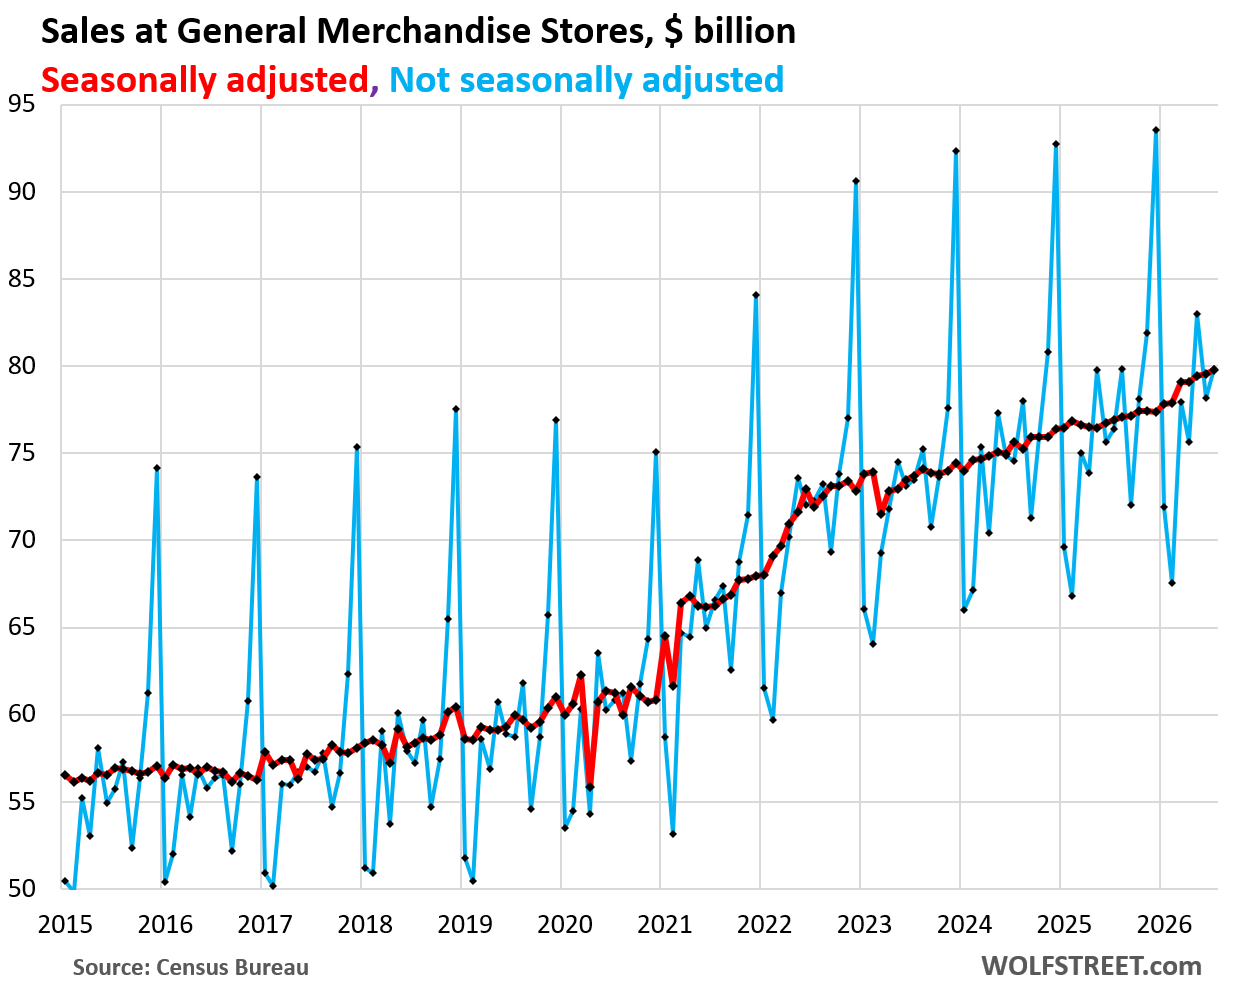
Sales at general merchandise stores jumped by 2.1% month-to-month and by 4.5% year-over-year, to $80 billion, not seasonally adjusted. Seasonally adjusted, sales rose by 0.3% in July from June.
This #5 category of retailers, with a share of 10.5% of total retail sales, includes the brick-and-mortar operations of Walmart, the largest grocer in the US, and its food sales are included here, and not in sales at “food and beverage stores.” But the huge ecommerce operations of general merchandise retailers are included in ecommerce.
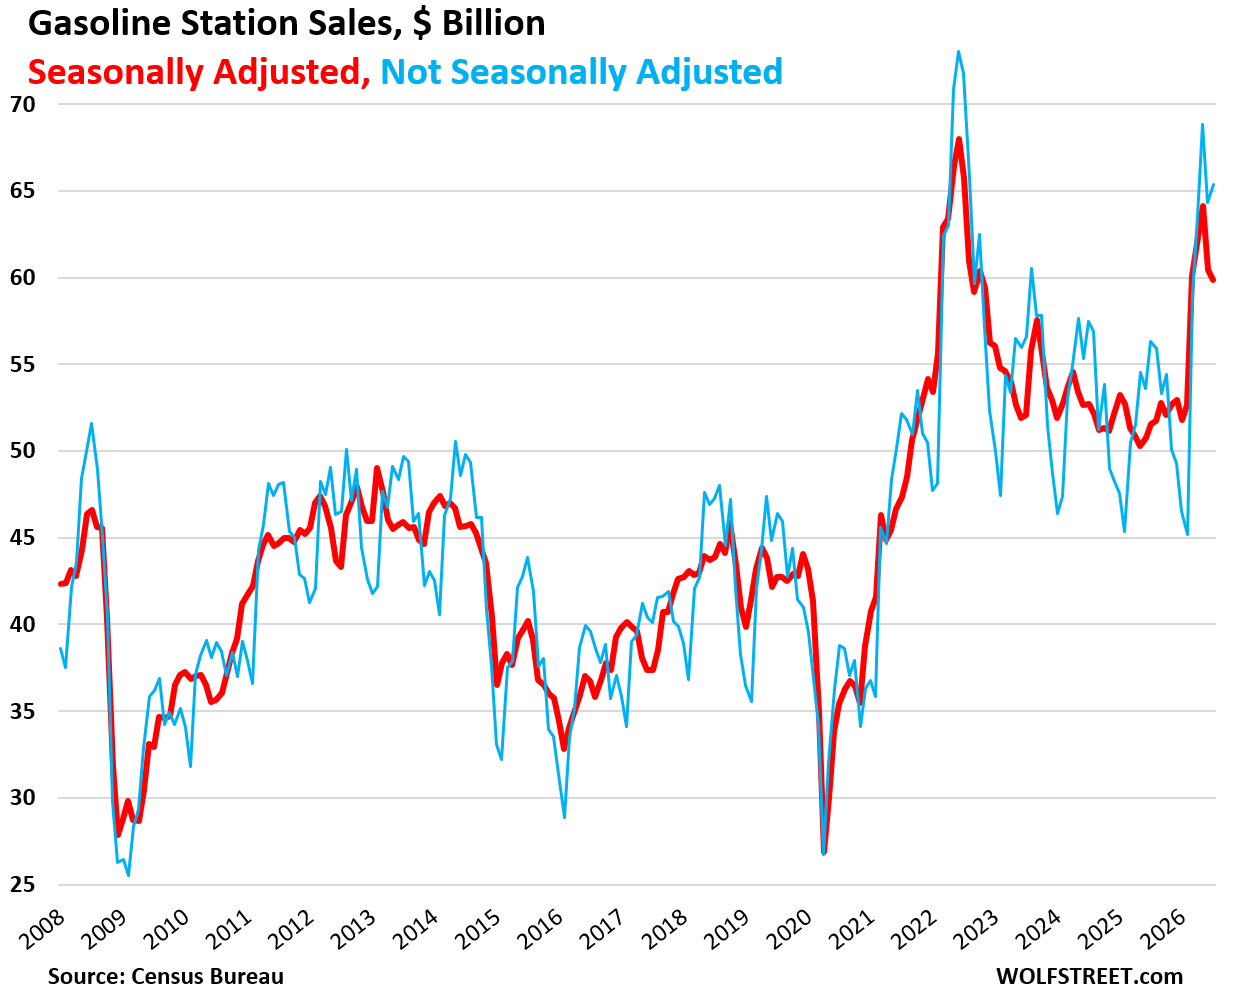
Sales at gas stations move in near-lockstep with the price of gasoline, which had spiked in March through mid-May, and then plunged back some. July is also peak driving season, when sales always surge. Gasoline sales are very seasonal.
Not seasonally adjusted, sales jumped by 1.6% month-to-month (the driving season) and by 16% year-over-year (tracking the yoy price spike of gasoline), to $65 billion. But seasonally adjusted, sales fell by 0.9% in July from June.
Sales at building materials, garden supply and equipment stores fell month-to-month by 4.4%, but rose year-over-year by 5.9%, to $42 billion. Seasonally adjusted, sales rose by 0.3% in July from June.
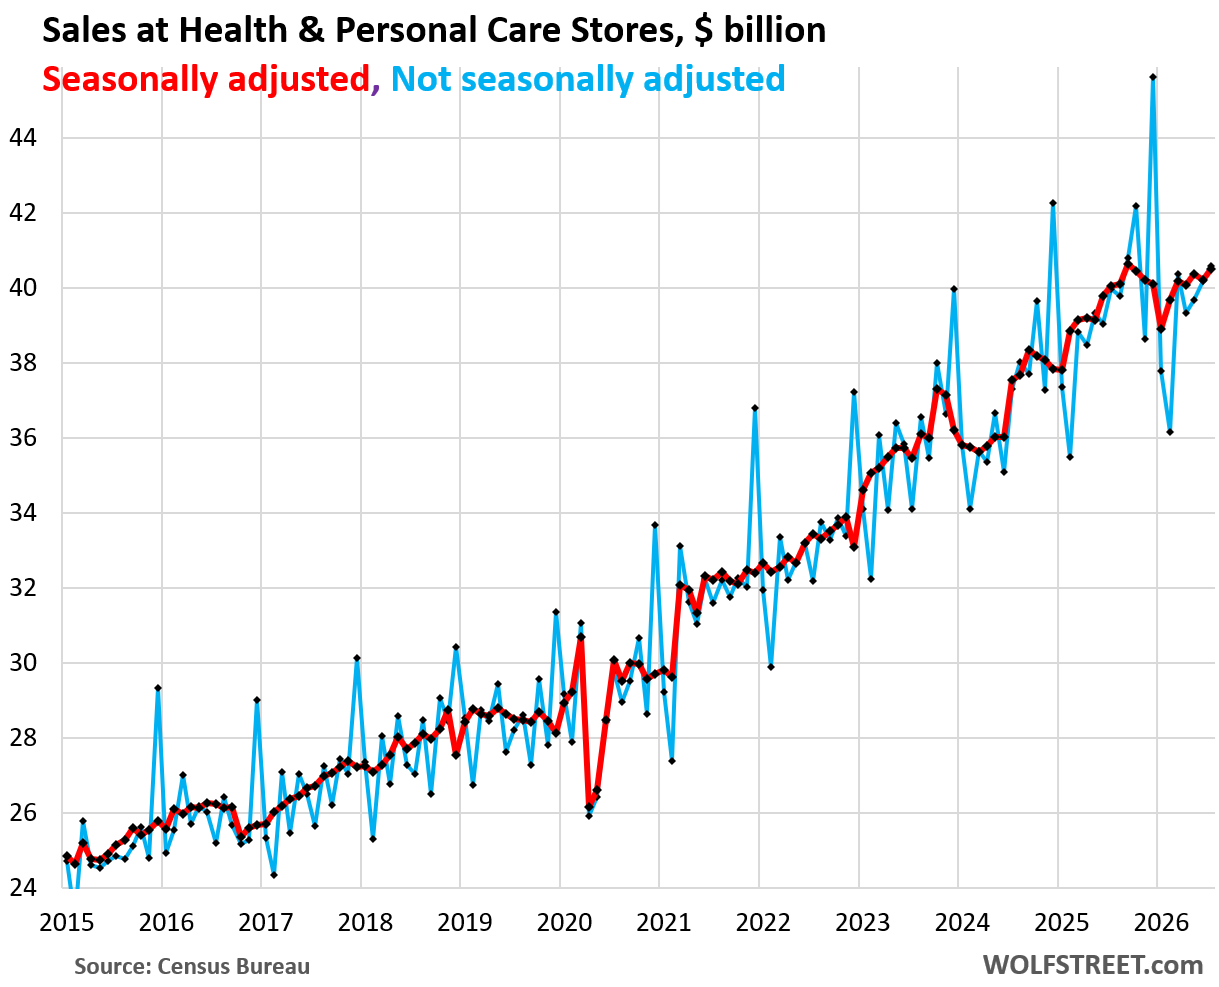
Sales at health and personal care stores rose by 1.0% month-to-month, and by 1.5% year-over-year, to $41 billion, not seasonally adjusted. Seasonally adjusted, sales rose by 0.7% month-to-month.
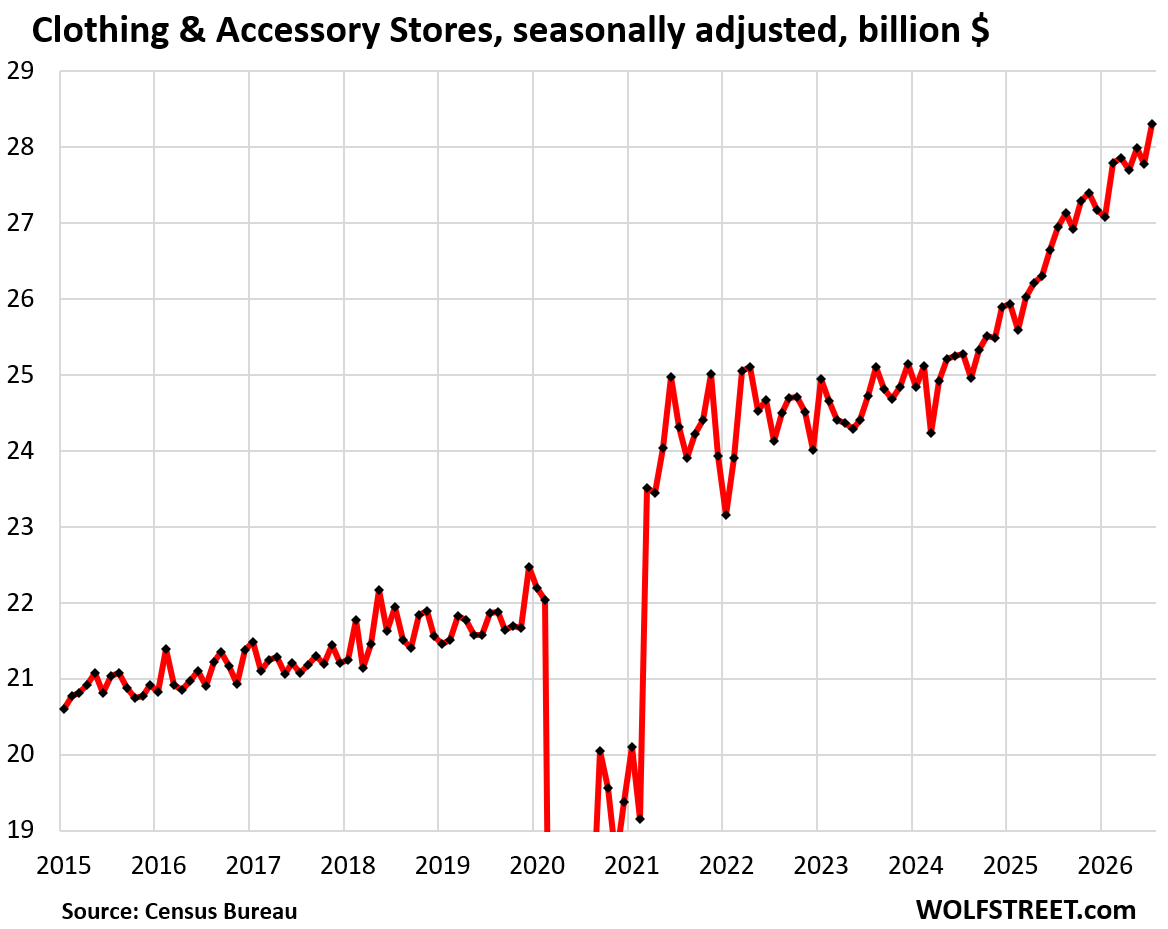
Sales at clothing and accessory stores jumped by 7.0% month-to-month and by 5.4% year-over-year, to $28 billion, not seasonally adjusted. Seasonally adjusted, sales jumped by 2.0% month-to-month.
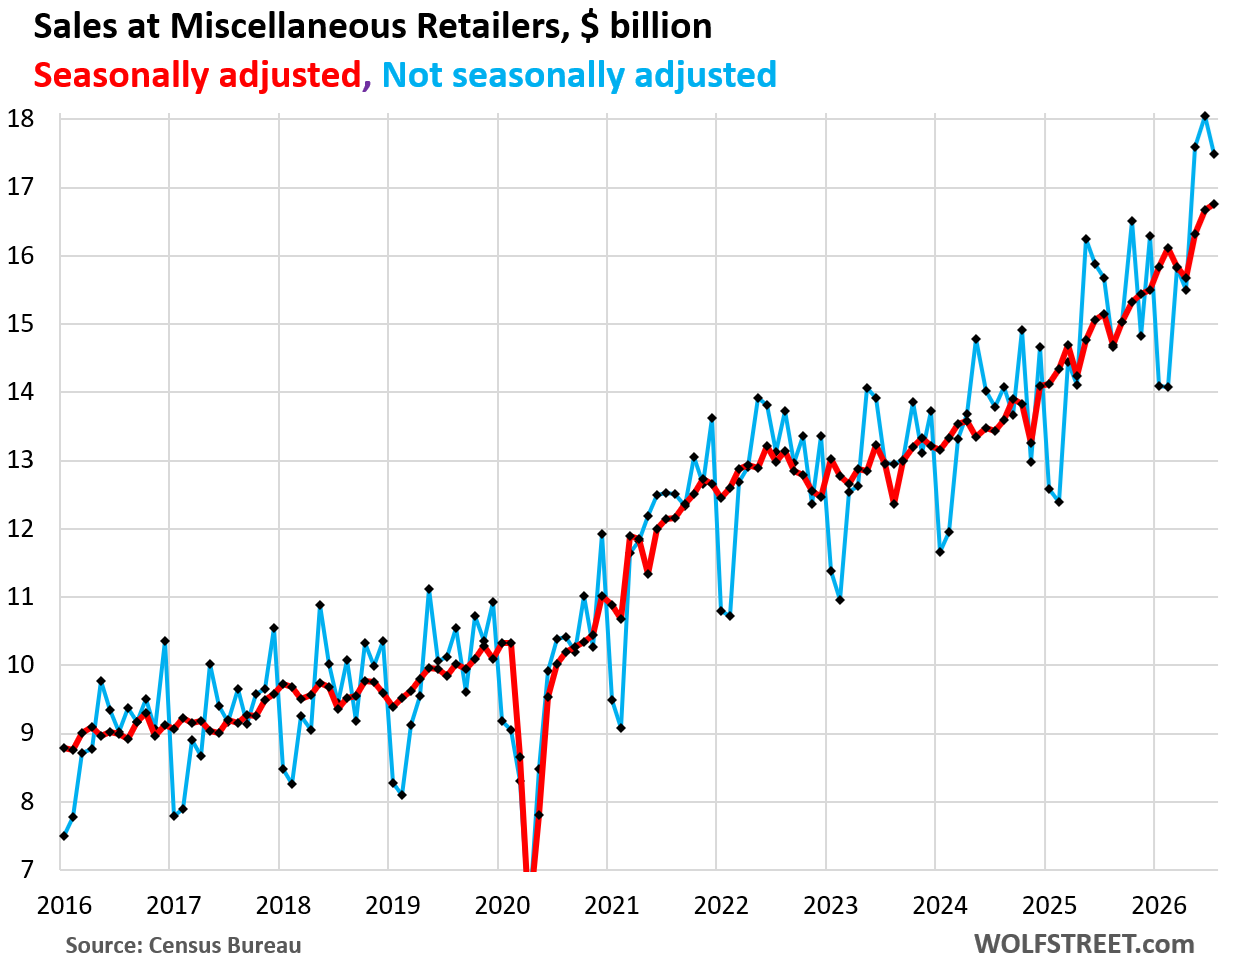
Sales at miscellaneous store retailers fell by 3.1% month-to-month from the record in June, and spiked by 11.6% year-over-year, to $17.5 billion, not seasonally adjusted. Seasonally adjusted, sales jumped by 0.5% month-to-month.
In case you missed it: Household Debts, Debt-to-Income Ratio, Delinquencies, Foreclosures, Collections & Bankruptcies in Q2 2026
Enjoy reading WOLF STREET and want to support it? You can donate. I appreciate it immensely. Click on the mug to find out how:


Question please:
Is it that MORE people are spending, and buying more stuff with coincidentally higher prices. Or is it that people just continue to buy, go out for dinner, etc, but the purchase costs are higher so they spend more money basically living the same way and buying the same amount of goods/services?
Or some of both?
I ask this because I feel inflation numbers are under reported. People have simply not cut back yet, or don’t think they have, or know how to to as opposed to the drunken sailor classification….or, that everything is just fine because the consumer is consuming.
I remember one guy at work asking for help with his budgeting as he and wife were always falling behind. In short, when we finished up a monthly tally of expenses he stated he would not change the way they shopped for groceries (menu vrs run up to the store and buy….. the closest but most expensive store), and that rep hockey for son (thousands per year) and figure skating for daughter was a need, not a want. He could not grasp the concept of discretionary spending.
Thanks in advance for your opinion.
I answered your question in the article, so you don’t have to ask it, including inflation for vehicles, restaurants, gasoline, food… compared to sales. Read the article!!!
I guess I missed it. I did read the article.
I’ll describe lunch “special” at PF Chang’s here in NC
You get a small spring roll
A serving of teriyaki chicken that you are still hungry after
A tea.
For $24.15 before tip. $4.83 is 20% tip, say you round that off to $5. Now you are at $29.15 for a meal and experience that did not fill you up.
Woo, we’re winning people.
I would sooner eat Warsh’s boogers than go to PF Chang’s LOL so you deserve what you get……
Try eating at restaurants that aren’t owned by private equity
Fang Fang say go bbq joint next time.
You can save a good bit on prime day. Maybe even hundreds if you have a wish list or things you stock up on.
I saved $∞ on Prime Day … by not buying anything.
Haha….
I am glad the wife said she could not find anything to buy on Prime Day….
But I respectfully, and intelligently hid my enthusiasm.
Prices were *increased* during Prime Day this year. No thanks.
Just don’t invest in the most risky security hands down
long term US government debt
The hard working people who invested their life savings in good old US long term treasuries during QE have lost around 60 plus percent of the value of their original investment
As tempting as it is which is the reason that the yield curve was invented in the first place. Temptation as an antidote to boredom
Assuming in many classes of products consumers are buying the same amount of household items, the rate of change in spending from 2022 through 2026 may provide a sanity check on what the real rate of inflation has been. Be interesting to see charts of the annual rates of change.
That assumption = fundamental BS, if you were serious. But given your screen name “Jester,” maybe you just made a joke that went awry. And that happens.
At any rate… There are more households than ever, and they’re wealthier than ever, and are making more money than ever. You cannot think of a $100,000 pickup as just “1 vehicle” and equate it to “1 vehicle” 20 years ago that didn’t have any of the advanced features, including 600hp motors, and think the difference is inflation. And you cannot equate the 113.3 million households 20 years ago to the 134.8 million households today (+17%), and think that the increased purchases due to the increased number of households = inflation.
Also, inflation was hottest in services, and services dominate consumer spending, about 67% of total consumer spending. But retailers don’t sell services – they sell goods. So you cannot apply overall inflation rates — which are dominated by housing costs, insurance, streaming, broadband, healthcare, education, etc. — to retail sales.
In some goods, there was a lot of inflation between 2020-2022, such as used vehicles (55%) new vehicles (25%), but then these prices FELL, durable goods prices fell overall, used vehicles by a lot. You really need to read more articles here, and you’d know all this stuff.
Out of curiosity, I cut and pasted your above inquiry (verbatim) into Google search, allowing for ‘AI mode’. (Their product is called Gemini, it’s free & quite comprehensive for database questions). I then repeated the question but omitted the introductory phrase (the assumption about volume).
If you are not already doing so, you may wish to try it yourself. AI is by no means fool-proof, but it can be educational.
AI is giving you total consumer spending, 69% of which goes to services. But retailers don’t sell services, they sell goods. And AI is not giving you retail sales because you didn’t ask for retail sales, which is what this article is about.
Your comment is Exhibit A why I frown upon AI comments, because people don’t know what they’re talking about and ask a vague or wrong question, or a leading question, and get an answer that is off the mark, and people have no idea what it means and just stick it into the comments as an argument. That’s how you spread nonsense.
AI is good, but you have to know what you’re talking about and ask the right question in a precise way, in different iterations, in order to get the answer that fits. And AI might still pick up some BS from the internet and serve it to you.
If you want to see inflation-adjusted consumer spending, a different topic, all you have to do is read my articles about this topic, including the GDP articles, such as the most recent one, quoted verbatim from the article:
https://wolfstreet.com/2026/07/30/red-hot-inflation-inflation-adjusted-strong-domestic-private-sector-demand-marks-q2-gdp-debt-to-gdp-ratio-dips-to-121-5/
Consumer spending rose by an annual rate of 3.2% in Q2, adjusted for inflation. Consumer spending accounted for 69% of the US economy. This growth rate added 2.1 percentage points to the GDP growth of 1.5%.
The spending growth was spread over goods and services. But consumers really splurged on durable goods (motor vehicles, computers, smartphones, appliances, bicycles, etc.). All these figures are adjusted for price changes (inflation):
The blue columns show the growth rates (left axis), the red line shows the dollars (right axis), all in seasonally adjusted annual rates (SAAR):
No it cannot be educational. Ask it something you are well versed in and all of a sudden you figure out it only sounds educational when you have bi command of a subject. Current AI is beginning to shine though if you give it tasks you already master.
As of now, AI searches seem to just be an aggregate of most visited posts and sites.
But….
Any yahoo can post jibberish on reddit or youtube…. with no sense of accuracy… and if it gets a lot of visits or likes…. AI seems to cite it…accurate or not.
I have experimented with AI searches and accurate results have been less than mediocre in my opinion.
I tend to go to specific sites that I tend to trust to have more accurate info….edu articles etc. seem to hopefully contain more accurate info.
OPENAI talent exodus raises ‘huge red flag’ ahead of IPO…
NVIDIA scales back $250 billion data center guarantee…
ZITRON: ‘Moment they stop spending, they crash the market’…
The OpenAI IpO if it happens will be the straw that breaks the camel’s back.
They may still survive the bubble deflating and blowing back up in 7 years, kind of like Microsoft.
All these companies are doing is playing a game of hide the ball under the cups and make you guess.
Wolf I’m excited to see what happens to the woman in 5/5 after the gripping narrative of the last one with the man
She will watch from her perch how all hells breaks loose around her. Coming this weekend to a screen near you.
Keep in mind that a lot of the AI datacenter borrow-and-spending flows to real people in the end. Those people spend it into the general economy. That’s along with the massive federal deficit spending already goosing the economy.
The boom will continue until either someone at the Fed prudently tightens the credit supply, bringing a soft(er) landing, or the debts associated with the inevitable AI overbuilding become unserviceable and force a crash.
Yes
1. Construction workers
Data centers require electricians, plumbers, welders, concrete workers, engineers, truck drivers, security, maintenance, etc.
2. Local businesses
A data-center project can mean enormous purchases from local contractors and suppliers.
3. Government
Construction and employment generate sales/property/payroll taxes and fees. Local governments can then spend that money.
4. Suppliers
This is potentially even bigger than the construction workers.
AI infrastructure requires:
* electricity
* transformers
* copper
* steel
* cooling systems
* generators
* buildings
* semiconductor equipment
* fiber optics
* land
* transportation
The trillions of dollars in financing and spending itself can temporarily make the economy look stronger—while simultaneously creating a huge obligation that eventually has to be supported by real cash flows.
Rico, did you just copy and paste an AI response? I’m assuming you did so. Why add to someone else’s comment with output from an AI model? It’s a form of plagiarism in a way, where you’re taking credit for expanding on Bagehot’s Ghost comment.
I’m just barking about this partially for the sake of barking. But as a reader of Wolf’s blog and occasional commenter, I have a personal preference for hearing the input of well-informed or at least opinionated people instead of algorithmically-generated content. That’s why I read Wolf’s work instead of polluting my brain with any type of social media. I come to Wolf’s website for his analyses and commenter’s (generally) thoughtful human responses. I’m extremely careful with how I surgically use AI, you know, treat others how you want to be treated. I encourage you and other readers of this blog to consider this.
AI should be named to FI (Fake Idiocy) as that all it is or will be.
Bagehot’s Ghost,
The press seems to report out everything from an MOU, which is for all purposes meaningless until contracts are signed, to data centers that are in the paperwork phase, to one that barely have broke ground, and on and on.
It is unclear what capacity will be eventually come online and how much overcapacity will exist. For existing data centers they do have creative accounting procedures however such as depreciation and lifetime of GPUs and a lack of building in how much continuous investments they will need. Sad thing is data centers are very special purpose buildings so if not successful unclear how to repurpose them. The building isn’t special as just a slab floor and walls and ceiling but all the power, water and cooling additions are pretty niche.
Be interesting where this ends especially if OpenAI financing runs its course. My guess is they hang around being immensely unprofitable because of they go down everything starts to unravel imo. Big problem is they were so arrogant that their terribly crafted narrative is hated so much that even saying AI makes many cringe. Unfortunate as AI does have solid use cases, it just isn’t anything in line with valuations.
I have observed that many products in stores are no longer held in stock, needs to be ordered, with extra costs.
Or… go online… (many times get a better price)… and the lag times to receive said product are getting shorter all the time.
This is especially true with anything specialty.
That has been going on since the 1970s.
We’ve found ways to cut discretionary spending. Got a Brita, stopped buying bottled water. Stopped drinking alcohol. Skip a meal here and there, avoid people who “invite” you to parties and then ask you to contribute something, we are born again heathens this year, and Yule will be spent reading books next to a fire and eating leftover soup. Can we “afford” to buy the new build for $400k sure, are we going to NO. The daughter would like to play travel volleyball, are we going to pay thousands of dollars to spend our weekends driving to crappy towns with crappy hotels, also No. Do I have the latest iPhone, no. 3 yr old Android and I fought that upgrade. Not cheap but frugal and finding the easiest place to cut back is the grocery store because we used to throw out half of what was bought anyway. Cost is becoming a factor in purchases in our household of 3 where 2 of us have full-time grey collar jobs. The cost of school supply lists are ridiculous! We pay taxes, we pay registration fees, we pay to play school sports, we pay for “lunch’ and you feed these kids scraps of fried trash and frozen pizza! Then I have to re-teach my kid to at least question the leftist BS they are pushing down their throats. Prices are are too high indeed! Gas at $4.50 a gallon – I don’t know how some families are getting by at all – well I guess we do know – that was a prior article on HELOCs and DTI ratios. I wish I could afford to send money and keep that poor lady off that wall!
Gasoline in the US is actually quite cheap by global standards and is much more expensive in Europe and most other countries.
Yes, because they use less gasoline. They have an economy and cities built around a reliable rail system and the cars they do have are the size of lunch boxes.
Crystal:
There is nothing wrong at all with frugal.
Sacrifice now, and hopefully reap dividends later.
I am a fan of frugal.
Good luck from here.
Stopped drinking alcohol, You poor devil admitting that everyone else were right all along
Wolf
I know this isn’t tied to this article particularly, but I’d love to see a comparison of cost of living for a middle class life lifestyle between major countries. Let’s say you get decent healthcare, housing, food for a family, a car, education for kids, taxes. Choose similar occupations. A teacher, an accountant, a policeman, a lawyer, a bank manager, a city employed parks worker. Comes to mind that incomes in China are lower, but what do things cost?
If you’re interested in that, ask AI and enjoy the slop 🤣