
But soaring imports (data-center components), a drop in federal government spending, and changes in private inventories ate into GDP growth.
By Wolf Richter for WOLF STREET.
Two major things stood out in the GDP arena in Q2:
1. Red-hot inflation. The GDP deflator, which tracks inflation in the entire economy (consumers, businesses, and governments) soared by 6.3% in Q2 annualized. Not adjusted for this red-hot inflation, “current dollar GDP” jumped by 7.9%. But adjusted for inflation, “real GDP” rose by only 1.5%, according to the GDP data from the Bureau of Economic Analysis today.
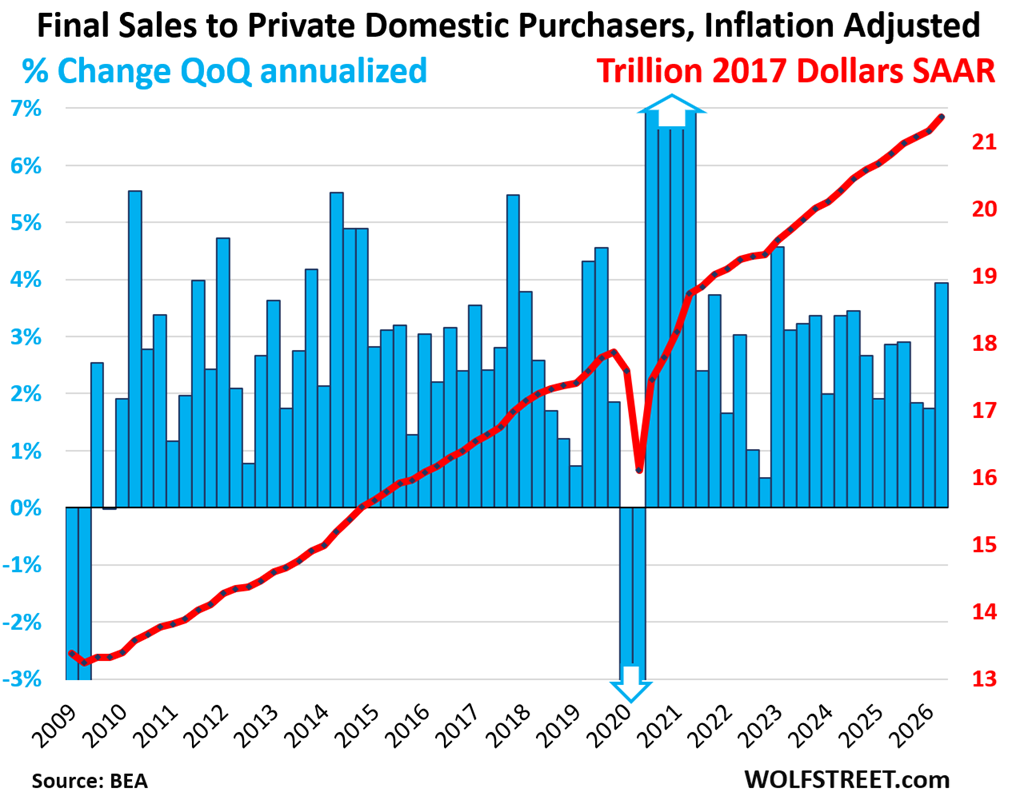
2. Strong domestic private-sector demand. “Real Final Sales to Private Domestic Purchasers” grew by an annual rate of 3.9%, adjusted for this red-hot inflation, the strongest growth since Q1 2023, driven by strong growth in consumer spending (+3.2%) and private fixed investment (+7.0%), all adjusted for inflation.
“Real Final Sales to Private Domestic Purchasers” = “real GDP” without government, without imports and exports, without change in inventories. It reflects private-sector domestic demand and covers 88% of overall GDP (blue columns, left scale: % change; red line, right scale: trillion $; all annualized, inflation adjusted):
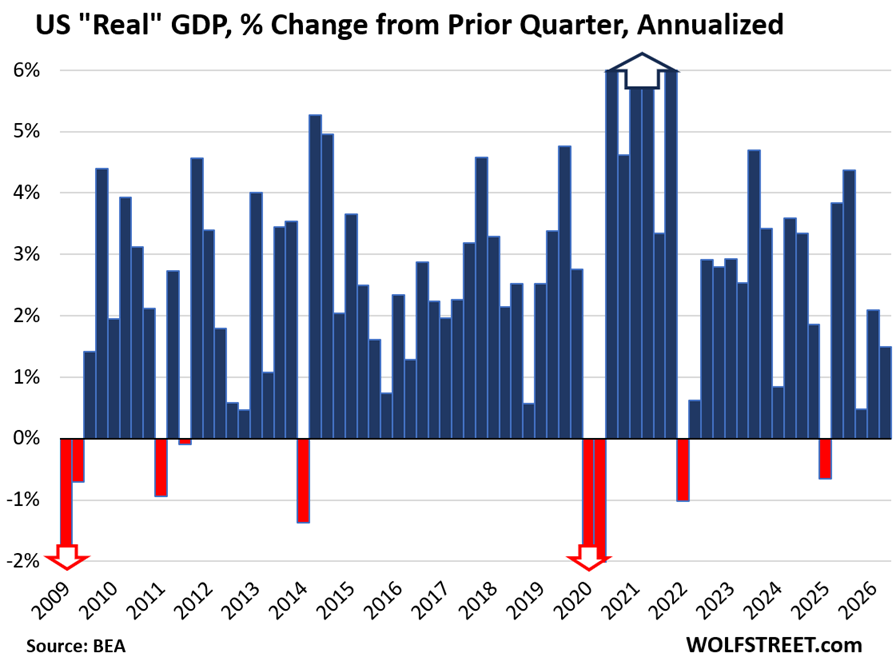
“Real” GDP overall grew by only 1.5%, dragged down by this red-hot 6.3% inflation, a massive surge in imports (deducted from GDP) in part due to high-dollar AI data-center related equipment; a drop in federal government consumption expenditures and gross investment; and the change in private inventories.
In the years between the Great Recession and the pandemic (so excluding recessions), average quarter-to-quarter GDP growth was 2.5% annual rate. The average 20-year quarter-to-quarter GDP growth, including recessions, was 2.2% annual rate.
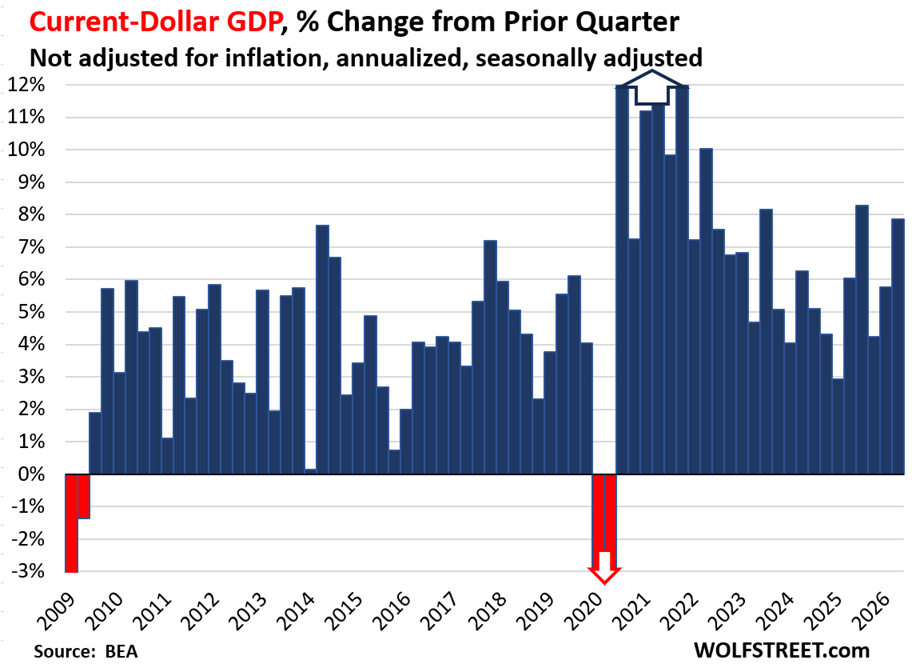
“Current-dollar GDP” (not adjusted for inflation) grew by 7.9% to $32.5 trillion, all annual rates.
This “nominal GDP” of $32.5 trillion represents the actual size of the US economy in today’s dollars and forms the basis for the Debt-to-GDP ratio (see chart at the bottom) and similar GDP-based ratios.
The difference between this growth rate of 7.9% in current dollars, and the growth rate of “real” GDP of 1.5% was the above mentioned red-hot 6.3% inflation in Q2 GDP.
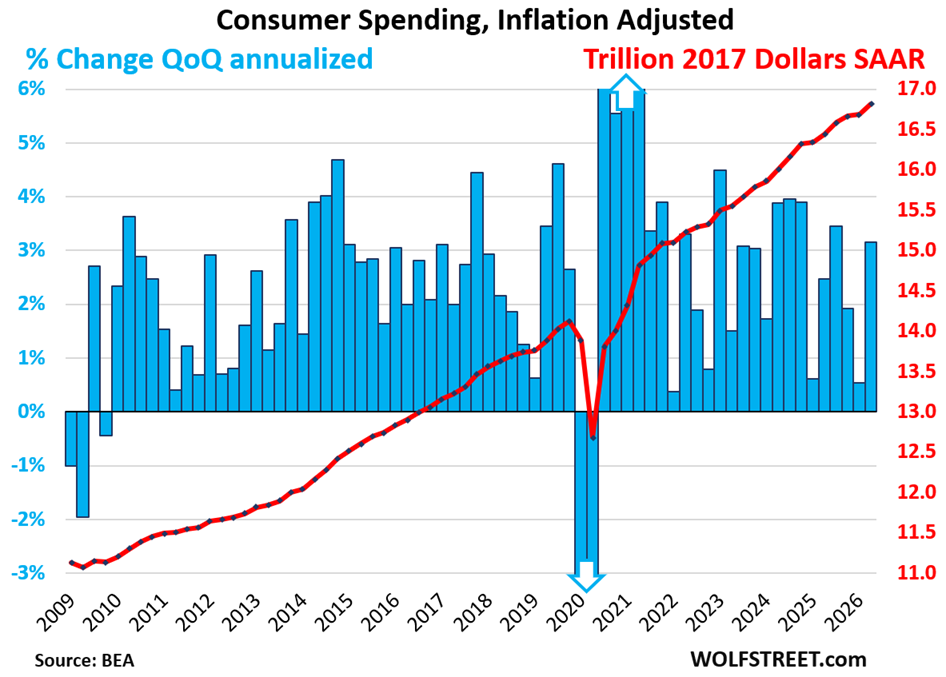
Consumer spending rose by an annual rate of 3.2% in Q2, adjusted for inflation. Consumer spending accounted for 69% of the US economy.
This growth rate added 2.1 percentage points to the GDP growth of 1.5%.
The spending growth was spread over goods and services. But consumers really splurged on durable goods (motor vehicles, computers, smartphones, appliances, bicycles, etc.). All these figures are adjusted for price changes (inflation):
- Services: +2.2%.
- Durable goods: +6.8%
- Nondurable goods: +4.4%.
The blue columns show the growth rates (left axis), the red line shows the dollars (right axis), all in seasonally adjusted annual rates (SAAR):
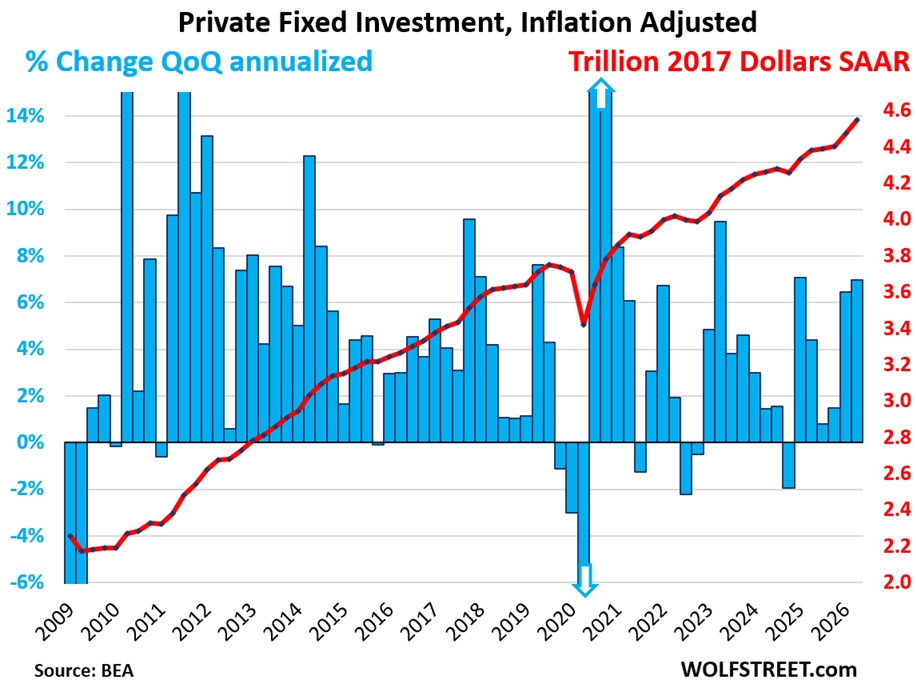
Private fixed investment (excludes changes in inventory) jumped by 7.0% annualized and adjusted for inflation. Of which:
- Nonresidential fixed investments: +8.4%:
- Structures: -5.0%
- Equipment: +15.2%.
- Intellectual property products (software, movies, etc.): +8.8%.
- Residential fixed investment: +1.5% (first growth after 5 quarters in a row of declines).
Private fixed investment accounted for 18% of the US economy and contributed 1.2 percentage points to the 1.5% GDP growth.
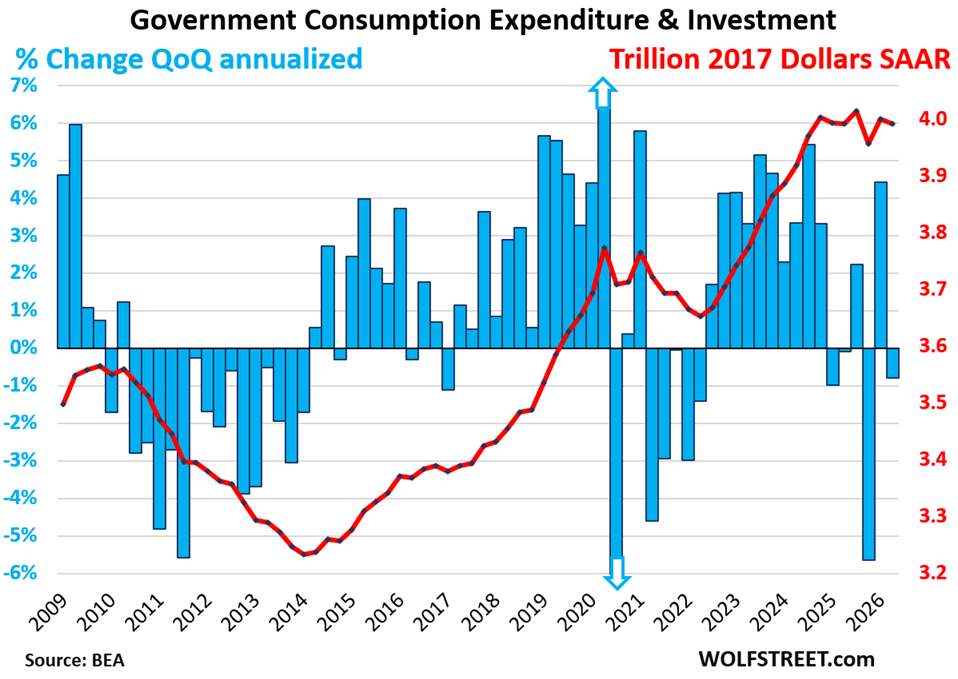
Government consumption expenditures and gross investment declined by 0.8% annualized, adjusted for inflation, all of the decline due to a decline in federal nondefense spending.
Note: This measure, “government consumption expenditures and gross investment,” does not include interest payments (generally, neither interest payments nor interest income are included in GDP). And it does not include transfer payments made directly to consumers (the biggest part of which are Social Security payments), which are counted in GDP when consumers and businesses spend these funds or invest them in fixed investments.
Federal government spending fell by 4.1% annualized in Q2, after the 4.4% surge in Q1 when government spending filled the holes left behind by the shutdown last fall:
- National defense: +2.4%
- Nondefense: -12.9% after the 20.7% surge in Q1
The decline in federal government spending subtracted 0.26 percentage points from the 1.5% GDP growth.
State and local government spending rose by 1.1%, which added 0.12 percentage points to GDP growth.
Combined, federal, state, and local government consumption and investment accounted for 17% of the US economy. About 60% of this measure of government spending is from state and local governments. Federal government spending accounts for about 40%.
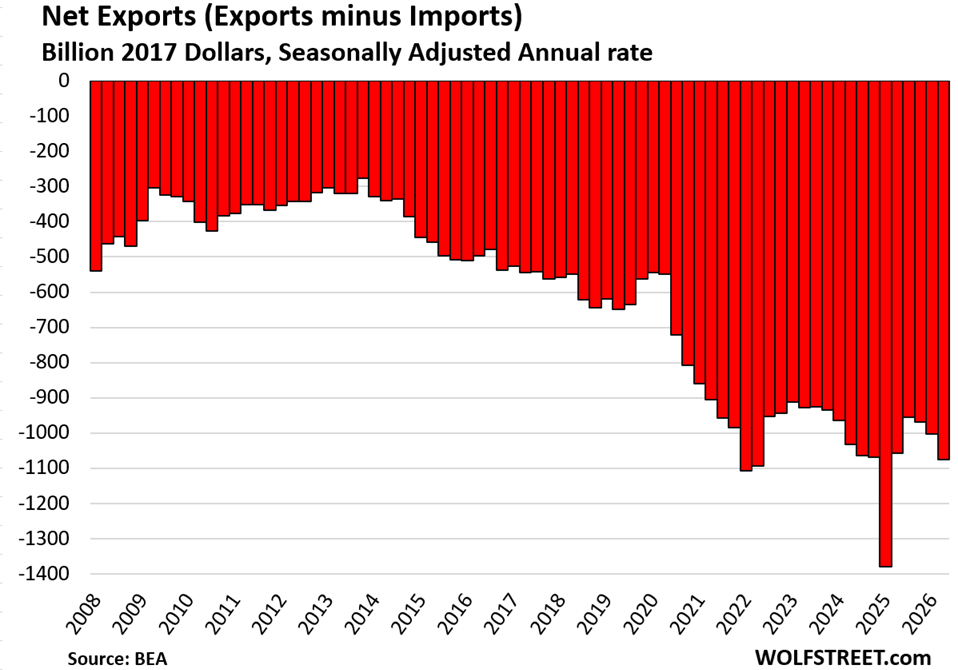
Trade Deficit worsens on surging imports.
Imports jumped by an annual rate of 11.5%, adjusted for price changes, on a surge of imports of electronic products, including semiconductors as part of the AI data center boom.
Imports are a negative in GDP, and this surge of imports deducted 1.51 percentage points from the 1.5% GDP growth.
- Imports of goods: +14.7%
- Imports of services: +0.1% (includes US tourists spending overseas).
Exports rose by 4.5%. Exports are a positive in GDP and contributed 0.50 percentage points to the 1.5% GDP growth.
- Exports of goods: +8.9%.
- Exports of services: -3.3% (includes foreign tourists spending in the US).
“Net exports” (exports minus imports) worsened to an inflation-adjusted trade deficit of $1.08 trillion.
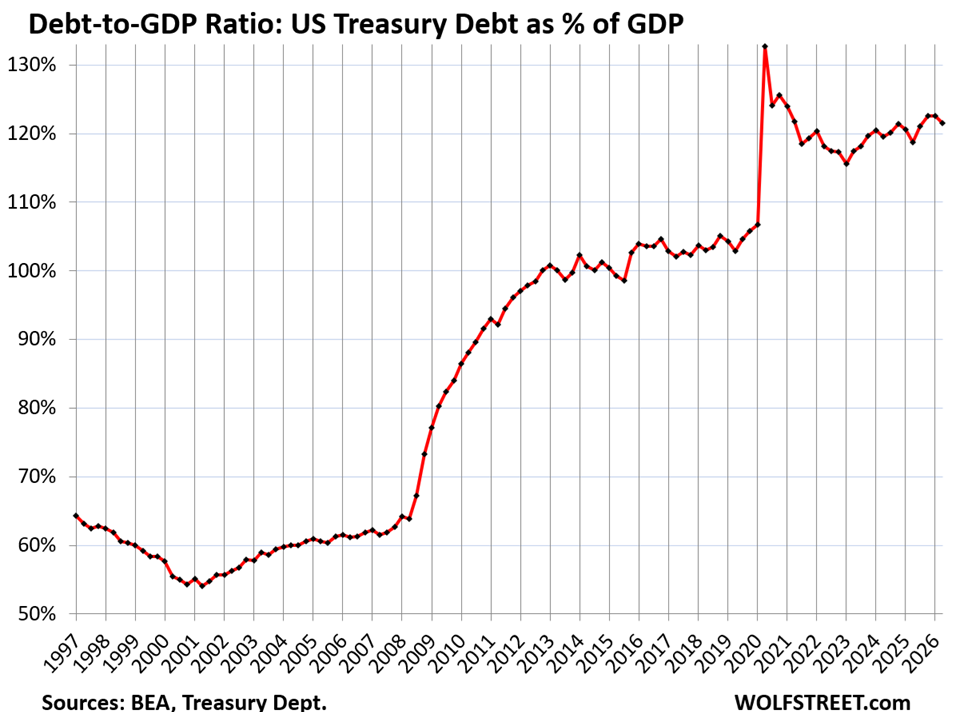
The Government’s Treasury Debt-to-GDP ratio ticked down to 121.5%, as current-dollar GDP rose 1.9% quarter-to-quarter not annualized to $32.5 trillion, while the Treasury debt rose 1.0% quarter-to-quarter to $39.5 trillion.
In other words, in Q2, the economy grew faster than the debt, and the Debt-to-GDP Ratio dipped a little – that’s the concept of controlling the debt fiasco via “letting it run hot,” meaning higher inflation and higher nominal economic growth brings down the burden of the debt.
But beyond the quarter-to-quarter squiggles, the trend is still higher.
Enjoy reading WOLF STREET and want to support it? You can donate. I appreciate it immensely. Click on the mug to find out how:


Your 2nd to last paragraph is important because tax receipts are paid on nominal income not real GDP income. Celebrate the 7.9% growth!!! Not to mention less Gov’t spending. Even though it’s only a quarter, there’s a lot of stimulus out there. Whether it’s foreign investment that the Pres has been bragging about bringing in or from tax breaks given to US companies from the GBBB to fully expense/depreciate capital expenditures in the FY paid. We are seeing public policy finally trickling down to the private sector. Inflation may rock around 3 to 6% but better to let the economy run hot vs the tepid pace in the teens and early 20’s. We’re building a new industry!!!!! It’s transformational and it will improve productivity, allow better supply chain MGMT, redistribute employment opportunities, and lower the cost of capital allowing for moderated growth with inflation back in the 1 to 3% range. Higher tax receipts from a couple years of strong growth, lower govt spending will right size the debt to GDP ratio.
You seem pretty happy about how things are and optimistic about where society and the economy are going. I still have some things to take care of over here in reality but you are my inspiration right now.
These posts are sounding more and more like a paid mouthpiece for a certain political party prior to mid-terms. It’s reading like a bullet-point lists of “wish to haves” instead of reality/facts.
US30Y headed to10-12pc now
Federal government should be made to amortize its debt. Yeah I know it couldn’t feasibly be implemented but they are killing the citizens by letting inflation run, I don’t see any reason that they will be working rates higher to kill it soon, its to their advantage to let it run wild…until it causes a revolt.
Embrace the once in a generation transformation of the AI world, use it now to find out how to lower costs and live in a little higher inflationary environment instead of waiting for your government to help you out. The Fed will snuff out a 30 yr going beyond 6 -6.5%.
It is crazy how all the software and chip companies are doing so well because of “AI” but no one can explain how AI is making anyone else any money.
By “lower costs” do you mean lower standard of living? Or are you assuming everything we buy has a substitute good that we just haven’t discovered yet? I’m kind of curious what the substitute good for my property taxes is going to be. Get on that, AI!
“…instead of waiting for your government to help you out.”
“The Fed will snuff out a 30 yr going beyond 6 -6.5%.”
You’re not even being self-consistent. This is just word salad.
Hi RHA,
Isn’t there a cure (or substitute if you prefer) for higher property taxes? Reduced government spending?
I don’t get to make that choice for myself. A collection of other people with different incentives do. No LLM is going to help with that.
Not saying I’m trying to get out of paying property taxes (well, maybe some of them). But if the topic is agency, I am limited to what I get with my one vote, which is to say almost none.
Gemni gave me tips on how best to challenge my property tax valuation. I’m waiting to find out if it worked.
Are you a paid shill for the AI industry? Would you like to explain how, for example, AI is going to increase Google’s advertising revenues? How it will increase Meta’s advertising revenues? How it will increase Apple’s product revenues? As far as I can tell, so far AI has been one big circle jerk of back-breaking capital expenditures – which becomes the next company’s one-off revenue increase. No one has yet to explain how AI is going to get consumers to start spending more money… and since consumers are the primary drivers of the economy, as far as I can tell AI is just another solution looking for a problem to solve.
“Would you like to explain how, for example, AI is going to increase Google’s advertising revenues?”
I can you tell you part of the answer: AI is reducing MY ad revenues, and my reduction is adding to Google’s revenues. So zero-sum overall, but Google revenues are going up at my expense. But that has been that way for years for all publishers.
I feel your pain. As the owner of a popular web site, my ad revenues are off about 30% over the last 12 months – driven almost entirely by a drop in impression RPM. I truly am considering dropping Google ads entirely and putting all content behind a paywall. That would, in fact, come directly out of Google’s advertising revenue. Then AI can figure out how to reference my proprietary content without breaking intellectual property law.
In terms of a paywall to keep AI from stealing your content: You would have to block all crawlers from accessing your content. Your robots.txt file would have to have those instructions. But if the AI crawlers don’t respect those instructions, they can get your content anyway. Then you have to block them at the IP address. This works, but it kills your search results also.
For example, the WSJ is behind a paywall, but you can still search for its articles, and you can click on the link and it will open but then put up a popup to sign in with. So the WSJ content can still be stolen by AI despite the paywall. But News Corp (which owns the WSJ) made a deal with some of the AI companies and is getting paid for the content they’re using. You and I are not getting paid by the Ai companies — they’re just taking out content and sell it.
Back in the 90s when we were trying to figure out how the Internet would help us manage business more efficiently people were wondering if Amazon would ever make any money. Many called for its early demise. No one had any idea that out of that new technology Uber, Lift and delivery services would create over a million jobs. When a society goes through major technological change, there is a rise in angst and out of the cracks appea the socialists and fascists. That worries me more than the fruit that intelligent machinery will eventually create…..at a lower cost.
As of July 30th 2026, US Treasury 3 month to 12 month bills traded from 3.85% to 4.14% respectively.
Interesting the deflator is so much higher than CPI, PCE, etc. Like double+.
So this is quarterly for Q2 (Apr, May, Jun). The figures for CPI and PCE you have in mind are monthly for June, but April and May were very high. So the bottom two charts are the quarterly PCE rates (overall and core), and they’re also very high, but less than GDP inflation. And that is confirmed by the PPI, which tracks inflation that businesses face, which this year has been running hotter than the PCE index that tracks consumer inflation. Businesses have had to deal with lots of inflation.
On a positive note, isn’t the cure for inflation, regardless of its root cause already beginning to take effect in both goods and services? I think it’s called higher prices.
Seems like reigning in inflation is being taken more seriously. Wallstreet and the main street media took a big dump on Warsh. And there are some big bets that the bond market interest rates are going to tick higher.
The Warsh honeymoon is obviously over. But Trump said he was brilliant and that he would love to lower interest rates. But he should know and hopefully he pays no attention to, with Trump you’re brilliant today and a dumsht tomorrow. He knows if Trumps baby, the stock market tanks he will be blamed. How does he sleep at night?
The fed held their rate. Serious is off the table.
Okay, but isn’t debt service the largest portion of the budget, and won’t we have to refinance at much higher rates, unless and until they squash inflation by raising rates thereby destroying their own plan?
And while it’s great that we shaved ~1% of the debt to gdp ratio how much debt to gdp ratio actual forestalls debt expansion?