
How Americans are handling their debts.
By Wolf Richter for WOLF STREET.
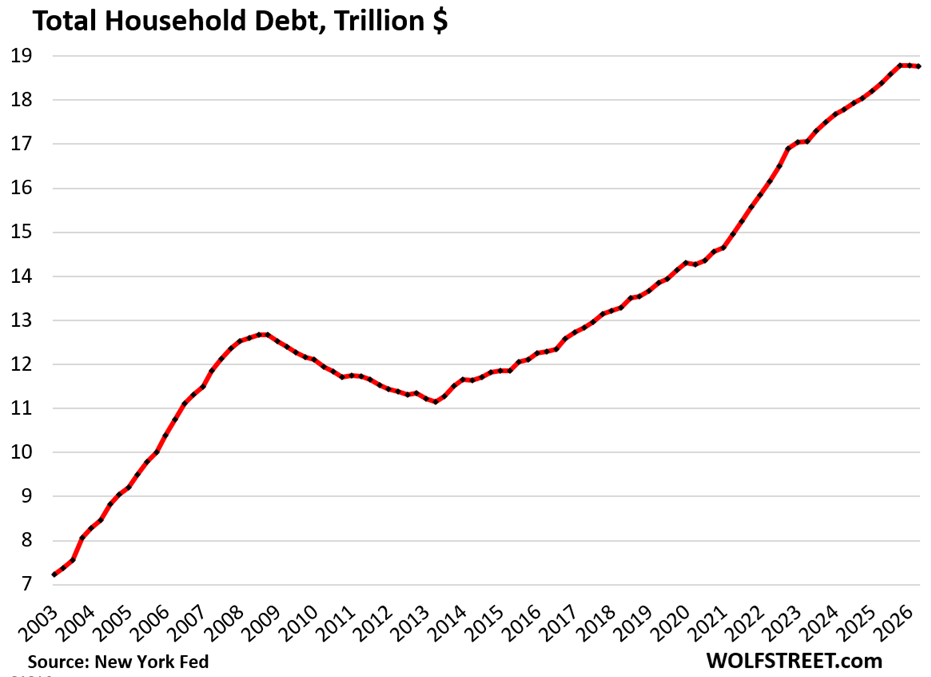
Total household debt outstanding in Q2 – mortgages, HELOCs, student loans, auto loans, credit card balances, and other consumer loans such as personal loans and BNPL loans – dipped by $23 billion, or by 0.1% from Q1, to $18.77 trillion, after having been nearly unchanged in Q1, according to the Household Debt and Credit Report from the New York Fed today, which obtained this data via its partnership with Equifax.
The decline in Q2 was driven by mortgage balances, which fell by $74 billion due to temporary technical reporting issues, according to the New York Fed. But HELOC balances jumped from the prior quarter, auto loan balances rose, credit card balances inched up, and student loan balances dipped.
Year-over-year, household debt rose by $383 billion, or by 2.1%, the smallest year-over-year percentage increase since 2015.
The burden of the debt.
The number of households has grown over the years, and in addition, the income per household has grown on average, and so total household income has grown faster than total household debt over the years, and the burden of this debt on household income has declined over the years, and it declined more sharply in Q2.
The debt-to-income ratio is a classic way of evaluating the burden of a debt. With households, we can use the debt-to-disposable-income ratio.
Disposable income (Bureau of Economic Analysis) consists of after-tax wages, plus income from interest, dividends, rentals, farm income, small business income, transfer payments from the government, etc.
But it excludes capital gains, which is where the wealthy make most of their money. Excluded are thereby income from stock-based compensation plans and capital appreciation where billionaires make their billions.
The debt-to-disposable income ratio in Q2 declined to 79.4%, as disposable income rose to a record while debt balances dipped.
This ratio was the lowest in the data going back to 2003, except for two quarters during the stimulus era, when disposable income was inflated beyond recognition by massive government handouts, including the stimulus checks, PPP loans, and numerous other programs.
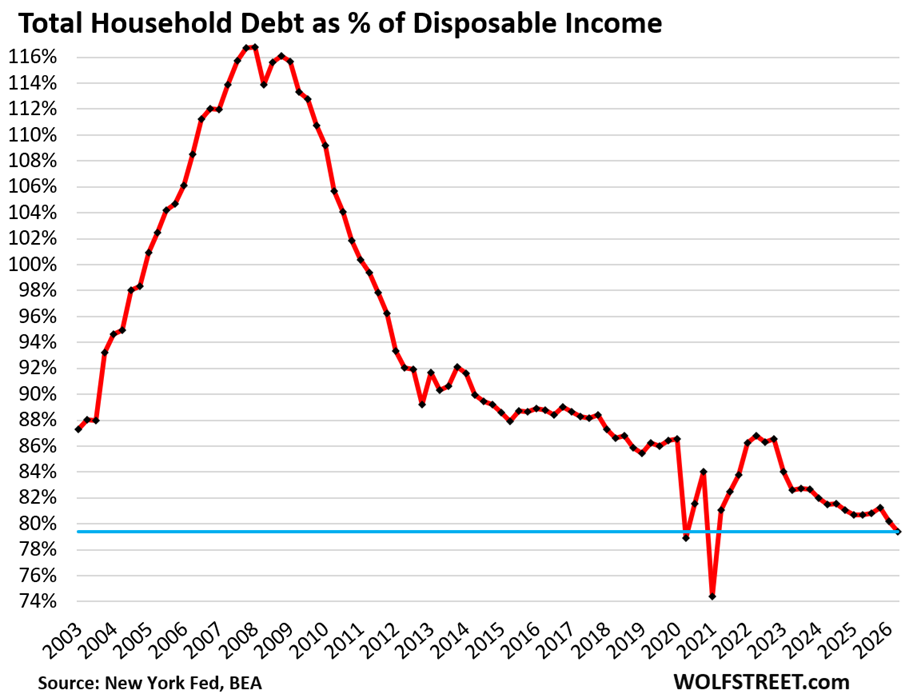
Leading up to the Financial Crisis, households were highly leveraged, and when the debt-to-disposable-income ratio went over 110%, everything went to heck.
Now household balance sheets are in relatively good shape overall – unlike some other economic entities that are overleveraged and overindebted, such as the federal government, some corners of finance, and some entities in Corporate America.
That’s where the risks are this time around, not with households: 65% own their own homes, and home prices soared over the years through mid-2022. About 40% of them own their homes free and clear, while another big portion has only a relatively small balance left on their mortgages. Over 60% of households have at least some equities, and their prices have continued to soar. They hold precious metals and cryptos. And they’ve got $5.2 trillion stashed away in money market funds and are sitting on a pile of CDs.
Delinquency rates.
Starting in 2025, federal student loans that had been covered by the government’s forbearance policies since 2020 came out of forbearance. During the government’s forbearance program, borrowers didn’t need to make payments, and their loans weren’t counted as delinquent, and many borrowers didn’t even consider them “loans” anymore, but just something that would be a gift and forgiven.
That mostly ended in 2025, and those federal student loans suddenly showed up on credit reports again, but as delinquent, and student-loan delinquency rates exploded into the double digits. But over the past two quarters, fewer student loans transitioned into delinquency, though the percentage that have been delinquent since the change in 2025 remains huge. Student loan balances amount to $1.65 trillion, and so the impact of those delinquency rates is visible.
So how are households doing now.

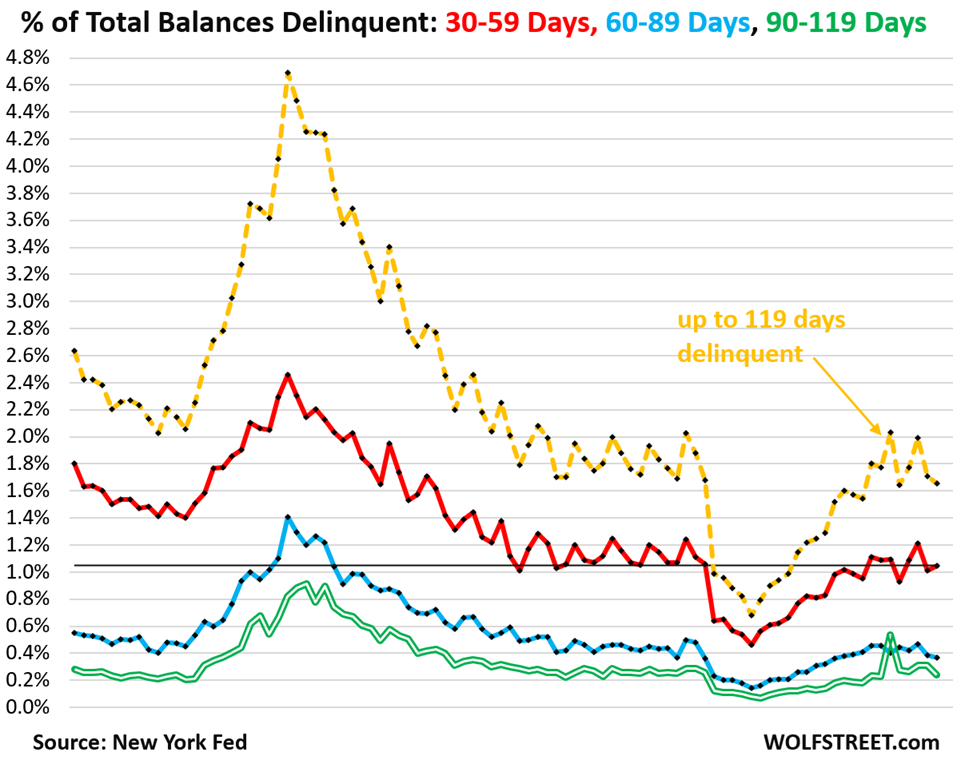
30-59 days delinquent, red line in the chart below: The amount of household debt – mortgages, HELOCs, auto loans, credit cards, and student loans – that had turned 30 days delinquent by the end of Q2 but was less than 60 days delinquent ticked up to 1.05% of total household debt balances, according to the New York Fed’s Household Debt and Credit Report. This is at the low range before the pandemic.
The shift of student loans into this time frame in 2025 caused that rate to spike, but as fewer student loans became delinquent this year, and as delinquent student loans moved on to the 60-day and 90-day categories, and further out, the 30-59-day delinquency rate has settled back down this year.
60-89 days delinquent, blue line: These delinquent loans weren’t cured during the prior 30-59-day period and therefore moved into the 60-89-day category by the end of Q2. This generation of delinquent balances dipped to 0.4% of total debt balances.
90-119 days delinquent, double-green line: These delinquent loans have not been cured in the prior two periods and are still delinquent. That rate declined to 0.2%.
These three categories together, dotted yellow line, dipped to 1.7% of total household debt was between 30 days and 119 days delinquent at the end of Q2. And this speaks of a consumer that is in pretty good shape now.
There is a lot of older delinquent debt on credit reports, and that percentage has kept rising, causing a lot of consternation. But the New York Fed, in an interesting blogpost today, clarified this issue with regards to credit cards: These were “stale, charged-off debts” that for whatever reason haven’t been removed from reporting, when in previous years, these stale, charged-off debts would have been removed. It summarized:
“We find that the stock delinquency rate is rising because of a pool of stale, charged-off debts that lenders have been reporting for longer durations, rather than a fundamental worsening in the incidence of delinquency.”
By disaggregating the delinquency rates and focusing on the debts that became delinquent over the prior 120 days, we can see how consumers are doing now, and it eliminates the issue of the “stale, charged-off debts” that are still being reported for whatever reasons, when they hadn’t been reported in prior years. It also shows to what extent consumers are curing delinquent debts, and how quickly they’re curing them.
These rates are held down by mortgage delinquencies, which are in very good shape. Mortgages make up 70% of total household debts. Delinquency rates are substantially higher for other loan types (we’ll get to each debt category over the next few days, so stay tuned).
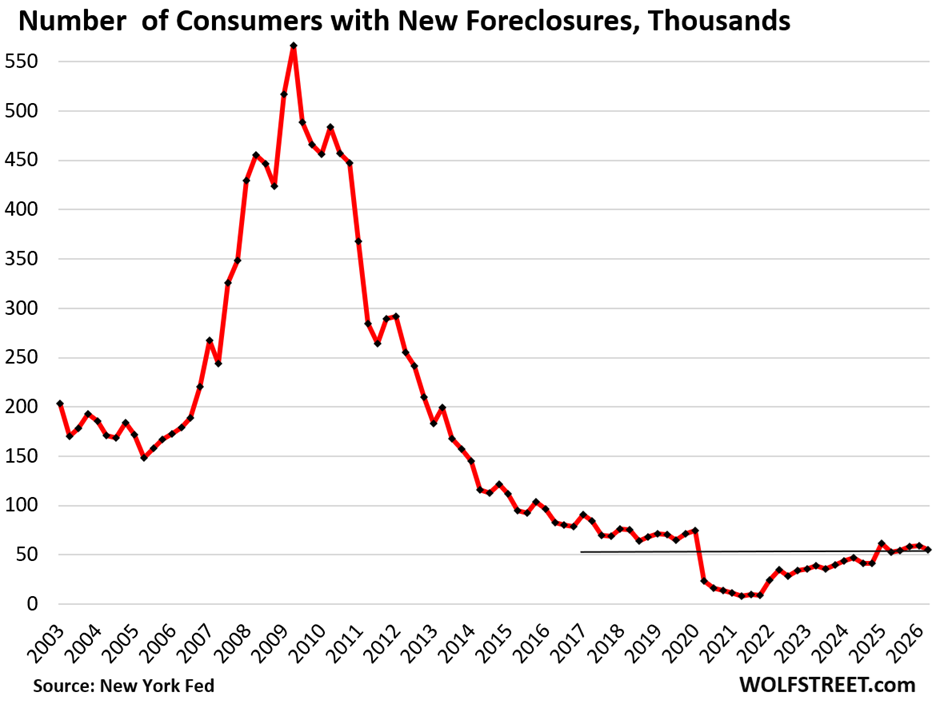
New foreclosures in Q2 edged down to 55,160. During the era of mortgage forbearance, foreclosures were essentially impossible and had dropped to near-zero.
Foreclosures have come up from the near-zero levels – in percentage terms, the increase from near-zero was huge and impressive and made great headlines – but throughout foreclosures have remained below the low end of the Good Times in 2018-2019, and far below the number of foreclosures in prior years.
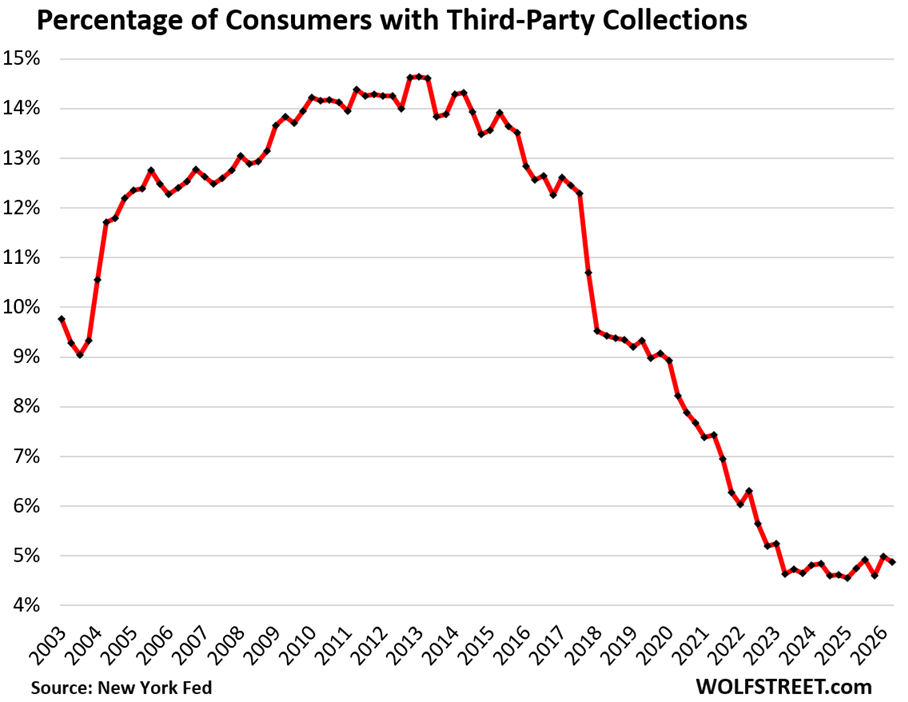
Third-party collections continued to wobble along rock-bottom. The percentage of consumers with third-party collections on file within the past 12 months dipped to 4.9%.
Credit accounts, such as credit cards, make up only a small proportion of collection actions. The majority of collection actions derive from unpaid medical bills and utility bills, according to the New York Fed’s Data Dictionary. The data is based on public records and credit reports.
During the Great Recession and the unemployment crisis, households piled on a lot of unpaid bills that gradually made their way to third-party collection entries that then peaked at over 14% in 2013.
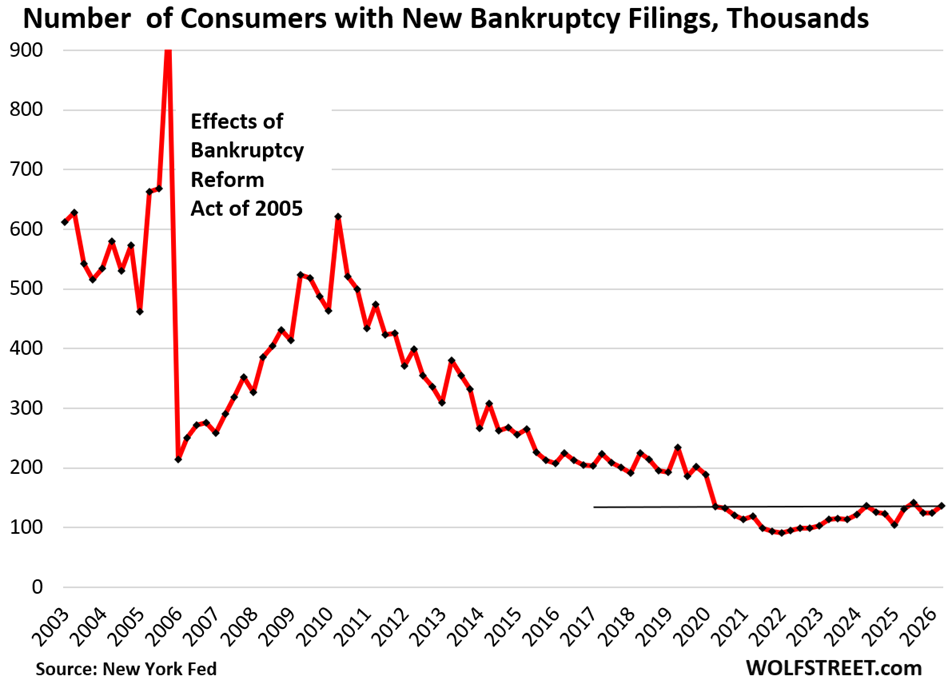
New bankruptcies also continued to wobble along rock-bottom. The number of consumers with new bankruptcy filings during the quarter edged up to 136,800 in Q2, far below the low end of the Good Times before the free-money pandemic.
I will discuss housing, auto, and credit card debt and delinquencies in three separate articles over the next few days. Next one up is housing debt.
Enjoy reading WOLF STREET and want to support it? You can donate. I appreciate it immensely. Click on the mug to find out how:


Looking at the first graph, it looks worrying to me that on average 80% of disposable income is earmarked to be returned to the moneylenders. On the positive (sort of), one at least knows where future income is going to be spend on.
“…that on average 80% of disposable income is earmarked to be returned to the moneylenders.”
That’s not what the debt-to-income chart says.
Disposable income is an annualized rate of income. This is how much consumers make in one year at the current rate of income. It’s a flow-figure. They make this every year (hopefully more in future years).
Debt is a stock, sort of an inventory, new debt comes in, old debt gets paid down and goes out, and what’s left at month end is the inventory of debt.
So you could correctly say, and that’s what the ratio says: it would take 80% of one year’s income to pay off the ENTIRE debt that has accumulated over the decades, including lots of 30-year mortgages.
All debt-to-income ratios, including the US government debt-to-GDP ratio work on that principle.
There are debt service ratios that show how much of income would go to interest and principal payments – so comparing a flow (quarterly income) to a flow (quarterly interest and principal payments), but that is a different measure, and it includes the impact of interest rates, and that percentage is much lower, around 11%, according to the Federal Reserve’s debt-service-to-income ratio. The Fed now used a new methodology for the ratio; the Fed’s old methodology produced crazy results, and I stopped reporting on it years ago because it was just silly. I’m watching their new measure leerily because I got burned before. But this new measure, now at 11%, is also below where it had been before the pandemic. In 2007, it topped out at nearly 16%. So the line in the chart looks similar but the percentages are much lower.
Given the above analysis on household balance sheets, given the low unemployment rate, given the high asset prices on stocks and homes, one wonders why the consumer sentiment figures are at record lows.
Could it be Inflation?
That is my deduction, that 1) it is higher than being reported and 2) as Wolf says, people hate inflation, just hate it.
My take is that the failings of our system are so much easier than ever to see (and get amplified by the algorithm). So, we wind up with a situation where so many people are doing OK themselves, but can see the cracks better than ever before. “I am doing OK, and also, this system is kind of bullshit,” are not incompatible.
In short, access to information on how this all works makes people nervous and cranky, even if it is actually kind of working better than it ever has.
The Michigan consumer sentiment survey – that’s the big one – has become completely politicized, and it oversamples Democrat-leaning consumers. Look at the results split by Democrat-leaning and Republican-leaning consumers. They’re diametrically opposed, and when the party in power switches, the sentiment of each line about the economy flips the opposite direction. It’s hilarious. The survey has become a complete joke as an economic sentiment survey. It was made worse when they changed the methodology. It has become a political sentiment survey about the party in power, with oversampling of Democrats. And lots of smart people have pointed this out, but it keeps getting cited in the media as if it were really consumer sentiment about the economy.
This is consistent with baby surveys that show people are very worried about how everyone else is doing but say they they themselves are doing just fine.
And here’s the link saying that three-quarters of American household say they are “living comfortably” even while they are pessimistic about the economy overall:
https://www.federalreserve.gov/publications/2026-economic-well-being-of-us-households-in-2025-overall-financial-well-being.htm
Delinquencies/defaults can explode very, very quickly – look at the upward slopes of 2007-2009 (varying “rocket ships” accompany every macro economic deterioration).
And inflation threatens/imposes a very real sense of instability/things being out of control (personal/national) – even if, *in the current moment*, the situation is okay.
Delinquencies exploded in 2007/8 because the debt had exploded in the years before, and the debt-to-disposable income ratio had gone over 110%. The debt had become too much of a burden. That’s why. Delinquencies don’t explode out of nowhere. That’s why we watch the debt-to-income ratio (chart #2).
We can thank Google, Meta, Tic Toc, X and online news and folks who follow the thread of disappointing news and the algorithms that accelerate the bad news over the good news. Tough to differentiate the real status of things when the scales of information get tipped every time the herd leans one way or the other. Wolf should be commended for providing unbiased research and commentary. It’s amazing to watch the comments lean from the center that Wolfstreet provides.
missed my opportunity to go into debt
have heloc I haven’t used
CU offered 4.99% interest for 12 months if I used it by 8/15
nope don’t need it
We do know the stress isn’t from bankruptcy. It isn’t even from being behind on bills.
Id wager some of this sentiment is debt being low is then offset by buying stuff at a higher price.
I.e household debt is down but price to buy a house so high many simply aren’t buying first time or upgrading due to cost. Same with new cars, eating out (my generations dreaded avocado toast) and vacations are all expensive too while many wages have not increased in pace. So often people forgoe pursing it and feel left out/unable to advance.
So if they have less debt because they feel like they can’t even afford it, thats a sour state to be in.
I suspect many are further inflamed from social media, but still affordability is a buzzword for a reason.
Also, it’s human nature that people judge their well-being relative to others. So, even if someone is doing well objective, rising wealth inequality means that people will see others living high and having really done very little to earn it (I don’t consider someone who dutifully bought SPY over the years to be a brilliant investor. To a large degree, they got lucky in the past 10 years from bad government policy), and that makes them angry.
The historical inflation from the past 5 years is just salt in the wound.
Yes, the hated inflation, no good resolution in sight for Federal irresponsability, and heightened uncertainty of many kinds.
People are making good and increasing money, but an outsized portion is going to the everyday basics.
Capitalism is a treadmill and the people are weary.
Really interesting post, Wolf. Thank you!
I get a notice from a collection agency about every 6 months sometimes a call maybe 1 time a year for a mistake utility co made on my bill about 6 years ago .
Electric contract was for 3 years with a 250 usd termination clause ..
On day of termination the companies switched but the time of the switch occurred at 11:59 pm day before .
I called the company over the 250 extra charge and they said they would waive the fee. Their error .
Long story short they sold the debt never waived fees and I refuse to pay 250 .
So I’m part of the 5 percent uncollected debt .
Does the multicolored chart need years?
The information in this article must be incorrect.
All other media points to Americans barely making it paycheck to paycheck, no savings, and highly indebted.
You must have made a mistake in your data somewhere, because it is so radically different than what everyone else is saying.
🤣❤️
Well, SOME always have been.
Others are making and spending more money than they’d ever need to.
It’s essentially a feature of this system/culture. That’s why we don’t rely on anecdotes or algorithmic information feeds.
Give thanks to Wolf Street or else we would all be drinking the doomsday kool-aid. I just got back from Europe, every flight booked to the max. For at least three years now I’ve been hearing that this was all being paid for by credit cards and all these out of control consumers were now “tapped out”! Yet the consumers keep chugging along, with no end in sight.
Media projects that Americans are starving and on the streets with bankruptcies. 200K bankruptcies in 2003 to 50K bankruptcies today. Population has increased by 25% in the last 23 years and bankruptcies are down by 75%. But media spin is everyone is losing their shirt. As a percentage of disposable income debt is at its lowesr. Thanks Wolf for the excellent info.
I don’t know what media you’re consuming, but my conservative news from Fox News & Breitbart isn’t painting a gloomy picture. In fact, John Carney from Breitbart is doing quite the opposite. His narrative is, in general, very positive regarding the overall economy. He may be wrong, but most conservative new outlets are not spouting a doom & gloom narrative. Even Wolf, IMHO, is far from a doom & gloomer, but he’s not one for doing predictions which is fine. As an economist, he seems to be very neutral when it comes to trying to over analyze the data.
I suspect that household balance sheets would not be so amazing without a $2 trillion federal deficit.
This is the real answer.
You get rid of 1/4 of that deficit, and we’d be in a recession.
If you make housing jump 50% and the stock market jump also 100% in a few short years. What do you get?
People get wealthier because debt tends to be fixed, I.e. same assets with more but the debt is fixed. All without people doing anything….
However, wealth is relative so everyone else’s wealth went up too. You’re all competing for the same assets (capitalism) so you’re relative wealth to your peers is still the same.
However, you relative wealth to people outside your comparative group could be substantial, young or lower income people got very little of this appreciation. As a result the wealth divide grows. And it also becomes harder for them to catch up.
If the AI bubble ever bursts the opposite will happen, it will hit the stock market, which will hit employment, which will then hit housing market because of travel declines and unemployment.
According to the national debt clock website, that’s $359k per taxpayer.
So yea, we should have the living standards of medieval peasants but we’ve borrowed ourselves prosperity, for now.
How come nobody ever mentions the $630k of wealth per citizen shown at the bottom of the debt clock when they bring this up?
Interesting comments which prompted me to check the U of M sentiment history as tracked by Fred. I’m more inclined to give more weight to the sentiment survey than in years past, especially when examining the inflation expectations, but not much.
Anyone’s opinion is subject to biases, especially mine. Because if I want or need sn opinion, my wife will tell me what it is. Show me a good marriage and I’ll show you a woman In charge.
Here’s a link to the Fred graph.
https://fred.stlouisfed.org/series/UMCSENT
🤣
I just posted this, so I’ll repost it:
The Michigan consumer sentiment survey – that’s the big one – has become completely politicized, and it oversamples Democrat-leaning consumers. Look at the results split by Democrat-leaning and Republican-leaning consumers. They’re diametrically opposed, and when the party in power switches, the sentiment of each line about the economy flips the opposite direction. It’s hilarious. The survey has become a complete joke as an economic sentiment survey. It was made worse when they changed the methodology. It has become a political sentiment survey about the party in power, with oversampling of Democrats. And lots of smart people have pointed this out, but it keeps getting cited in the media as if it were really consumer sentiment about the economy.
So go back and find the links to the Michigan consumer sentiment survey split by party preference 🤣
Talking about “biases” 🤣
I wonder over the last few years how many times you’ve posted that reply. It’s got to be at least 10.
The lesson:
Having a political ideology is like having a distorted view of the world. It’s like a mental illness.
With 6% of GDP fiscal deficit spending, it seems like it would be nearly impossible for anyone to be poor. The government is quickly coming up from behind people and sweeping everything under the rug.
When I feel gloomy by watching too much cnn I switch to fox news where everything is awesome
The new and improved opiate of the people.
Good information, however, this reader is now suspect of every statistic reported by our government including the Fed.
The economy feels like the old Texas proffer when a cowboy says what’s hitting your boots is just rain.
Inflation is perhaps putting a lid on spending disposable income. People do not buy if its too high?
Unfortunately inflation for corporations is a gift since they can now pay off fixed debt with cheaper dollars. The consolidation and buying out of competition since 2008 created by cheap debt thanks to Bernanke’s QE and ZIRP
Was the foundation for our inflation today that gave concentrated pricing power to fewer and fewer corporations ax well as concentrating deposits in a few money center banks. Just another gift from the long term legacy of the Fed.
This is Equifax data (private-sector credit reporting data), not government data. The New York Fed just puts it together and releases it.
I can get most of this data from Equifax directly, but the free public data only goes back to 2020. You have to buy the rest. You’ll see me reporting it for Credit Card delinquencies
Aren’t income numbers from the credit reporting agencies just based on self-reporting by consumers when they apply for credit?
What kind of BS is this? Read the f**king article.
I’ve also noted that most websites – even brokerages – now only show stock price charts back to 2016 or 2017. Maybe I want to see how something behaved during the dot-com bubble?
They’ll have video ads that consume a gigabyte of RAM but can’t hold an extra few kilobytes of data, which is what people came for?
“The term Andrews’ Pitchfork (also known as median line studies) is a technical analysis charting tool developed by Dr. Alan Andrews to identify support, resistance, and trend channels”
Wolf’s pitchfork, on the other hand, has tines pointed UP to impale freeloader wall-climbers when they lose foot resistance and trend down.
Drunken sailors are ready sipping mocktails.
Despite what anyone says, both political parties supported by their constituencies are employing MMT.
This will continue until inflation becomes high enough that interest rates rise significantly and the bond market responds in a large way.
Ok. So basically, dumb speculators got homes and they are mostly doing ok. Housing is not going to be affordable again to many first time buyers. They will continue to be renters of the mostly dumb speculators. I say this because I saw bozos pay 70-100% over asking price of homes during covid and some of them are not able to sell even with 20% discounts. This is in a nice market with major tech names with large offices.
It almost feels like new construction will not be able to fix the housing affordability problem at the slow pace at which it is going. Plus its expensive wrt to the quality of older homes. It just feels like only mass layoffs can fix the housing affordability problem for the first time buyers who can still hold onto their jobs. That sucks and should not be the way.
Or moving to a low cost state will fix the housing affordability problem. I drool looking at all the goodies I can afford in these low cost states. People say they can’t live in these states and I can only laugh, because I can’t imagine living in huge cities around a million people with bumper to bumper traffic. To each their own I suppose.
When I retired 2 years ago, we moved from expensive southern California to Florida. Bought a much nicer and newer, single story home, about the same size (2,500 sq ft), on a 1/4 acre lot, water view, in a 55+ community that is better described as a resort for less than half what our overpriced 50 year old track home in California sold for. If we could have found a home like this in California, it would have cost over $3 million instead of the half million we paid in Florida.
Plus the lower taxes, no nanny state government, etc, makes everything so much better.
Gooberville:
Not all lost cost states are as you described.
Low cost “big cities” maybe… but not the whole state in general.
I have several US relatives who simply live in fear of medical debt or necessary doc visits with their huge co pays. Missing work with no sick bennies? This might have something to do with consumer sentiment.
“Further, estimates suggest that inability to afford costs of medical care contributes to at least 530,000 personal bankruptcy filings annually. Approximately two-thirds of personal bankruptcies in the U.S. are associated with medical expenses or illness-related loss of work.
The second chart of debt/disposable income is really quite mind boggling. At first glance it looks like a great improvement, but then the scale reads 80% !!!!!
So, there are many snide comments above about consumer sentiment as if it is some kind of lefty delusion, certainly never to be understood at Fox or Breitbart. Think about it. 80% of your after tax dollars are committed before, BEFORE you buy groceries, before you pay the utilities, buy the school clothes, whatever. And many rent. I always say if you rent you are still paying a mortgage; the landlords or the owning corporation’s.
80%. And yes many own their own homes outright or have 3% mortgages. They probably own stocks, too. But most likely a younger family starting out is barely getting by, and some months will go in the hole. School starts soon and Christmas is a comin’.
People can pooh pooh consumer sentiment polls because feelings are not data, and not easily measured. But you try and tell that to someone close that their feelings are similarly inconsequential. Good luck with that, the lawyer’s office is thata way. How people feel is a very very powerful economic force. It can propel the ones losing into, “Oh, well, it won’t matter anyway” so they go buy something they cannot afford. It makes others batten down the buy hatches. And then everyone who drives can watch the metter tick upward at every fill these days.
I would not be sanguine with these numbers. People are pissed out there. Take them at their word….it is their truth. And I wouldn’t advise telling people their feelings about the economy are simply wrong. 84 days until the midterms, then gridlock X 100 and unending investigations in January. And it looks like the war will still be ongoing for the next 2.5 years.
“The second chart of debt/disposable income is really quite mind boggling. At first glance it looks like a great improvement, but then the scale reads 80% !!!!!”
🤣 You’re in Canada, you know this: The debt-to-disposable-income ratio in Canada is 175%, per StatCan, more than double the US ratio (under 80%). And that’s due to real estate loans. But the ratio has come down from 188% in mid-2022 since home prices have skittered lower in the biggest markets, and by a lot in the GTA.
So what’s consumer sentiment like in Canada with a debt-to-income ratio of more than twice the US ratio??? How “pissed off” are you Canadians buckling under your debts? You guys are truly debt slaves. You see that the 80% ratio is minuscule. USians are NOT over-levered unlike you Canadians. US consumers are in really good shape, unlike you Canadians.
Paul S…
I know of plenty young people just starting out that are doing well, good wages, benefits, stocks, home owner etc. Blue collar middle class, making it happen.
The American dream is alive and well, maybe even more achievable than ever…..
(maybe a slight stretch)
But as everyone who came before us knows it is earned and not deserved.
Instead of just spending energy being angree, and jealous, put that energy to good use.
“Student loan balances amount to $1.65 trillion, and so the impact of those delinquency rates is visible.”
And still, effectively no wage garnishment. At least Biden was going to require minimum payment. Trump has decided to indefinitely suspend any payment. Few people are aware of this. Trump has been an even better deal for student deadbeats than Biden was.
The $30 trillion Treasury market is facing a painful reckoning. How rising yields could squeeze your portfolio.
Rising yields are good for future buyers of yield investments, such as said Treasury securities… they’ll pay more interest!
Somehow, consumers don’t seem to be doing too great in the real world. Here’s what’s currently going on in vehicle sales:
“What runs the other way is duration and the share of value financed, with a record share of the book extending past 72 months and a smaller share of price covered by cash at signing. Longer loans, thinner equity at origination, and an elevated share of loans written above the value of the collateral remain the watchpoints, compounding duration and collateral risk across the book even as credit quality holds.”
Are you saying that consumers are using a 30-year mortgage to finance a home purchase because they’re not “doing to great in the real world?” Even rich people borrow because it makes sense to borrow. The useful life of today’s motor vehicles is far longer than it used to be. We sold a 12-year old car that looked nearly new. Why not finance a new vehicle over 6 years? Lots of people LEASE their vehicles, rich people, and they may not have any equity ever in their vehicle. They lease corporate jets too. What is your problem??? Is your brain kaput?
The fact that the spreads are narrowing, and many loans are being written for over 100% the value of collateral, with 31% of the loans having terms greater than 72 months, it smacks of (1) desperation to get those cars sold, or (2) desperation to write loans (spreads narrowing), or a combination of both.
BS. The upside-down balance gets added to the new loan. On used vehicles, this is especially easy to do and super common, and always has been. We did that back in the 1980s and 1990s, already. It’s part of the car business. So what? These clickbait BS articles are written by clueless journalism majors to titillate the internet.
My take on Wolf’s numbers are: 1) Average income is higher because of wealth disparity. So it doesn’t portray the Lower K. 2) Of course income has gone up in all sectors but particularly Upper K (and I’m not talking super wealthy. People with “have to” jobs are roughly staying up with inflation. 3) This is what inflation does…..it minimizes debt burden since debt is fixed and incomes rise; albeit in a somewhat disorderly fashion. 4) If long term rates stay higher as currently seen, this ration will go even lower. Only Upper K can afford these higher rates. This also to some degree explains why housing sales are down.
“Average income is higher because of wealth disparity. So it doesn’t portray the Lower K.”
BS. This is NOT average income. And it does NOT include the biggest portion of the rich people’s income, namely capital gains. Read the f**king article before posting BS.
I’m not one of your readers. . .but now I am!
I like your analytical no nonsense style.
Wolf, since you have to keep repeating yourself about the consumer confidence survey flaws, maybe you want to do a post on the Fed survey showing that 75% of households say they are doing well while only 25% say the national economy is doing well?
To me it explains a whole hell of a lot.
No one reads these kind of things. People only read nonsense about the consumer collapsing or cracking or living from paycheck to paycheck or not being able to buy a loaf of bread without a credit card or K-shaped BS.
I’m really burned out on consumer surveys.
It still perplexes me how so many people in the United States want to believe so badly that the average person is barely making it. Especially when the actual numbers prove otherwise, that the average US citizen is well off.
Why does doom and gloom get sold and perpetuated so much better than prosperity.
I understand there are problems out there that need fixin’…. But for god’s sake…
the global economic collapse story, and worthless USD story gets kinda old. I will gladly take your worthless paper dollars, because I find them very useful.
The US, and many other countries throughout the world have been prospering for decades. Many third world countries have been pulled out of extreme poverty and still making gains in prosperity.
I understand that poverty exists here and am in no way downplaying the seriousness of it. But Just because Elon Musk has a boat load of money, does not mean nobody else has any, and are all poor.
So if I understand this correctly, at the household level debt seems somewhat Ok, or at least not getting worse. But the governments are going further and further in debt in behalf of everyone. If I am reading it correctly, about $300,000 debt for every household.
It seems the data support a conclusion that the typical consumer is NOT at all overstretched. So the next recession may be caused by:
a) inflation and interest rates, or
b) corporations getting overleveraged or a banking crisis
Healthy consumers also explain why the housing market has only slowly deflated, instead of popping. The levels of consumer debt in the pre-GFC years was, in hindsight, the red flag that a consumption frenzy was about to end.
Our uber-dovish FOMC will read today’s CPI report as a reason to postpone a rate hike until 2027, if it happens at all. If all-items CPI is actually only 3.3%, then a policy rate with an upper limit of 3.75% can be called neutral or slightly restrictive. And political cover is all the FOMC needs at this point.
The next recession will arrive when the AI investment bubble deflates and stock prices plunge by a lot, like they did during the Dotcom Bust (Nasdaq -78%). It took about 18 months of plunging stocks before there was a national recession, though it was already a depression in the affected cities, such as San Francisco.
Thanks for the no emotion, data driven news.
It is refreshing….and helpful….
Even if a guy like me relies on boots on the ground info…. Your stuff definitely offsets a guys intuition to follow that which is not data driven.
I am stuck in my ways, but vering more toward your stuff.
Thank you for your work… it is appreciated.
Inflation sucks, poverty sucks and it definitely needs correcting.
But I know many people who should be well off due to their income, but always struggle due to poor financial decisions, poor financial literacy, and impatience.
And that responsibility lies with the individual, and not with the government, or wealthy people.