
The bond market is functioning again after the Fed’s interest rate repression between 2008-2022 had broken it.
By Wolf Richter for WOLF STREET.
The US government sold $728 billion of Treasury securities during the week, spread over eight auctions.
Of them, $607 billion were Treasury bills with maturities from 4 weeks to 26 weeks, spread over six auctions. Four of these auctions were over $100 billion each. Most of these sales replaced maturing T-bills. The “investment rate” – which is the yield that is comparable to the yield of notes and bonds – on all of them was over 4%.
And $121 billion of the auction sales were 3-year and 10-year Treasury notes and 30-year Treasury bonds. Yields at these three auctions blew through the yield ceiling in a big way, with yields higher than they’d been at auctions in over 20 years, which was what it took to sell all $121 billion of these notes and bonds.
And at these higher yields, some more demand emerged, and the bond market settled down and breathed a sigh of relief that it wasn’t any worse.
| Treasury note and bond auctions this week: | |||
| Notes & Bonds | Auction date | Billion $ | Auction yield |
| Notes 3-year | Oct-06 | 59 | 4.932% |
| Notes 10-year | Oct-07 | 39 | 5.300% |
| Bonds 30-year | Oct-08 | 23 | 5.618% |
| Notes & bonds | 121 | ||
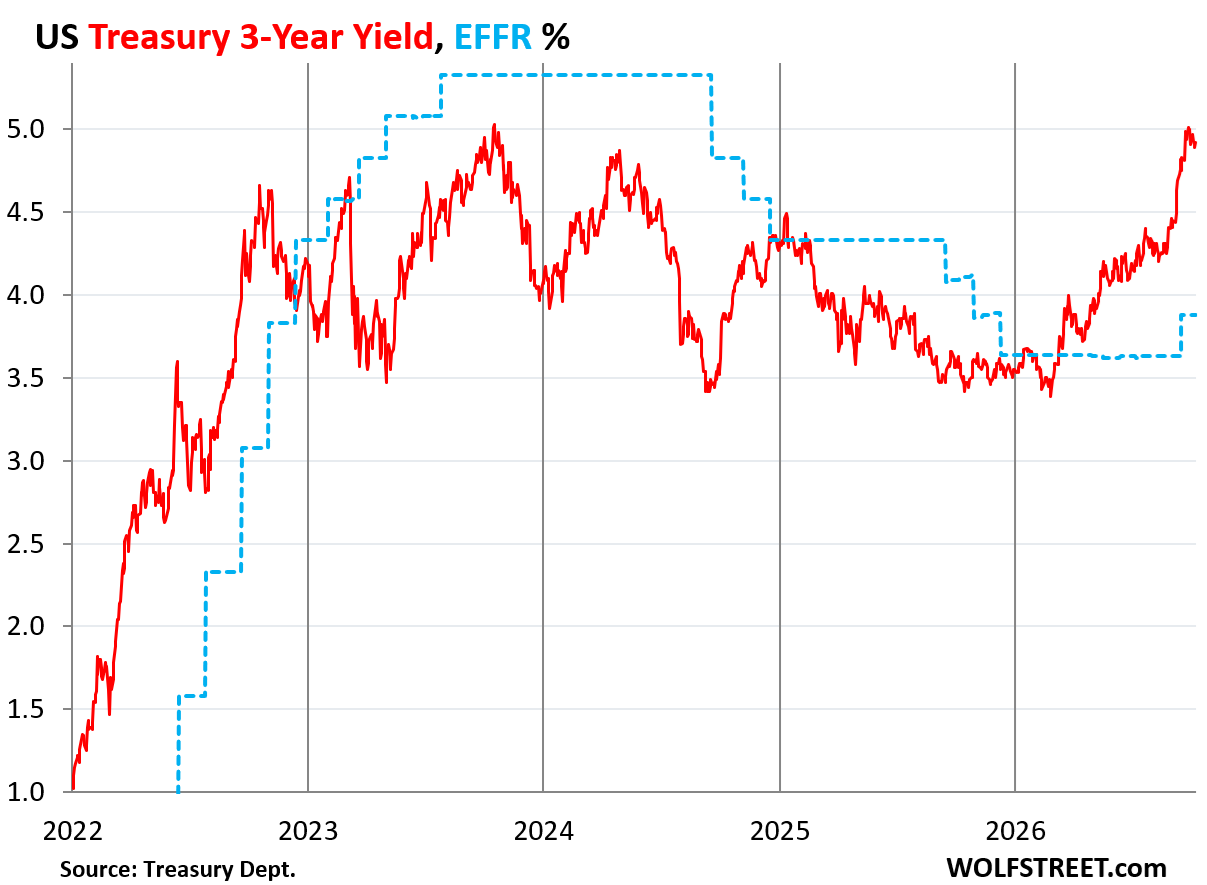
The 3-year Treasury notes sold at auction on Tuesday at a yield of 4.932%, the highest auction yield since the 3-year auction in May 2006, and up from 4.474% at the prior auction a month ago.
But in the secondary market, the 3-year yield had already traded at just over 5% in late September, and the day before the auction traded as high as 4.98%. After the auction and for the rest of the week, volatility continued, with yields ranging from 4.88% at the low end to 4.96% at the high end. And it closed the week at 4.92%.
Since February, the 3-year yield has surged by 150 basis points, pricing in multiple rate hikes, in addition to the September rate hike:
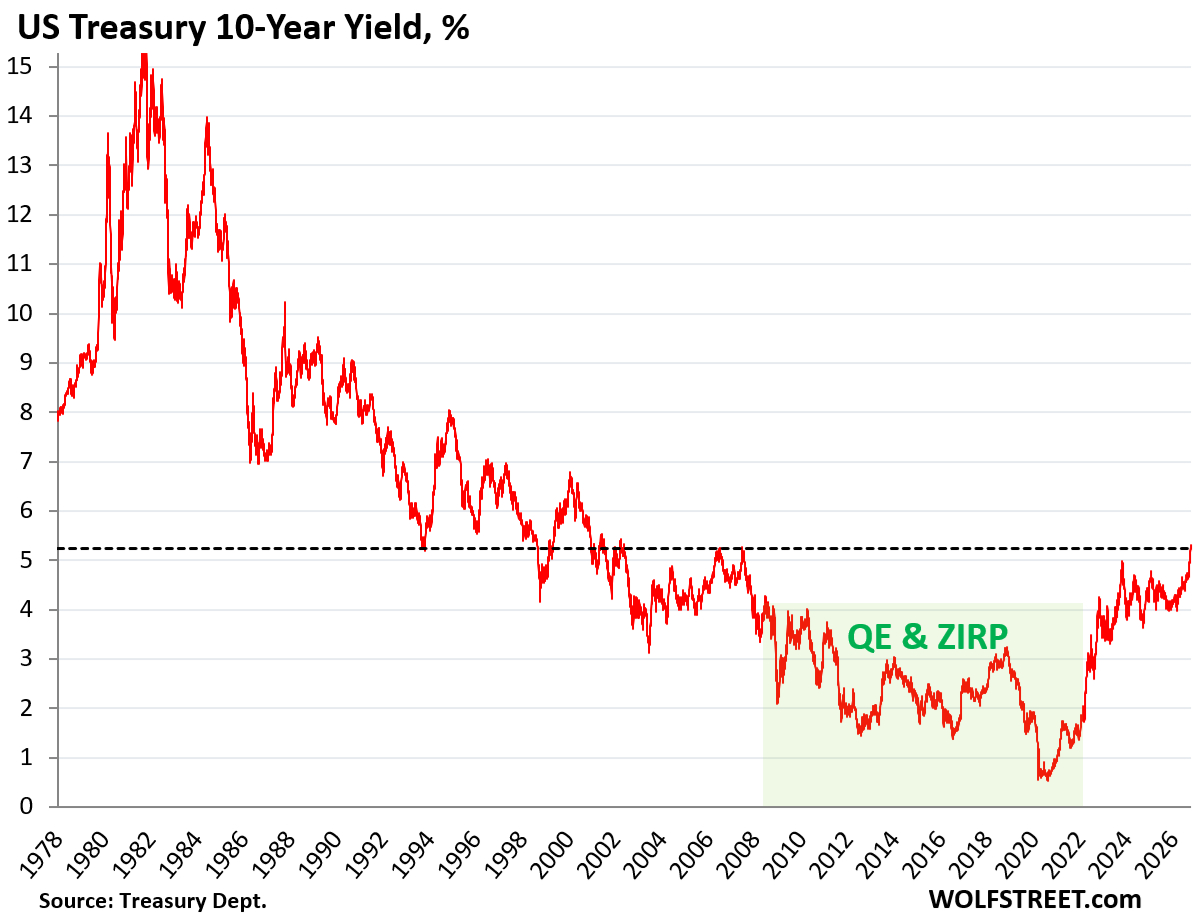
The 10-year Treasury note sold at auction on Wednesday at a yield of 5.30%. That’s what it took to sell all $39 billion of those notes. It was the highest auction yield since November 2000 when yields were declining because the Dotcom Bubble was in full implosion mode by that time, slowing down demand growth and employment growth, which would morph into a recession by March 2001. In the first half of 2000, the 10-year auction yields were in the 6.5% range.
The fact that the auction wasn’t worse, that it wasn’t as ugly as the when-issued trading had expected it to be (I discussed the 10-year Treasury auction in detail here), calmed down the market.
So, in the secondary market, the higher yield began to pull in some additional demand, and the yield began to edge down right after the auction and closed on Friday at 5.24%.
The bond market was very ready to take a breather, after the harsh ride since late February, during which the 10-year yield soared by over 130 basis points at the time of the auction, and now by 125 basis points.
Higher yields mean lower prices for existing bondholders who’d bought the notes some time ago at lower yields. That’s the bond bloodbath of rising yields: They crush existing holders. But higher yields are appealing to buyers, and pull in new buyers, and create new demand, and that’s what it took to sell those Treasuries, and that’s the fear of the market that the tsunami of supply of new Treasuries would require still higher yields to rope in new buyers, thereby crushing the buyers who’d just bought.
The government deficits continue to pile up at a rate of about $2 trillion a year, and they have to be financed with new debt sales, and those new debt sales have to pull in new buyers. At the same time, AI companies are selling huge amounts of debt at much higher yields – the yield of the SpaceX 10-year notes traded at 7.20% on Friday, nearly 200 basis points higher, at a much higher risk, than 10-year Treasuries, and the government has to compete with those AI bonds.
And through it all weaves inflation, which has refused to go back into the bottle. Inflation is the biggest threat that holders of Treasuries with long maturities face over the long term because inflation destroys the purchasing power of long-term investments, and the yield needs to be high enough to compensate them for inflation over the term of the security.
Here we’re looking at the first six years of the current bond bear market (when yields rise, bond prices fall) that followed the 40-year bond bull market from 1981 through August 2020 (when yields fall, bond prices rise).
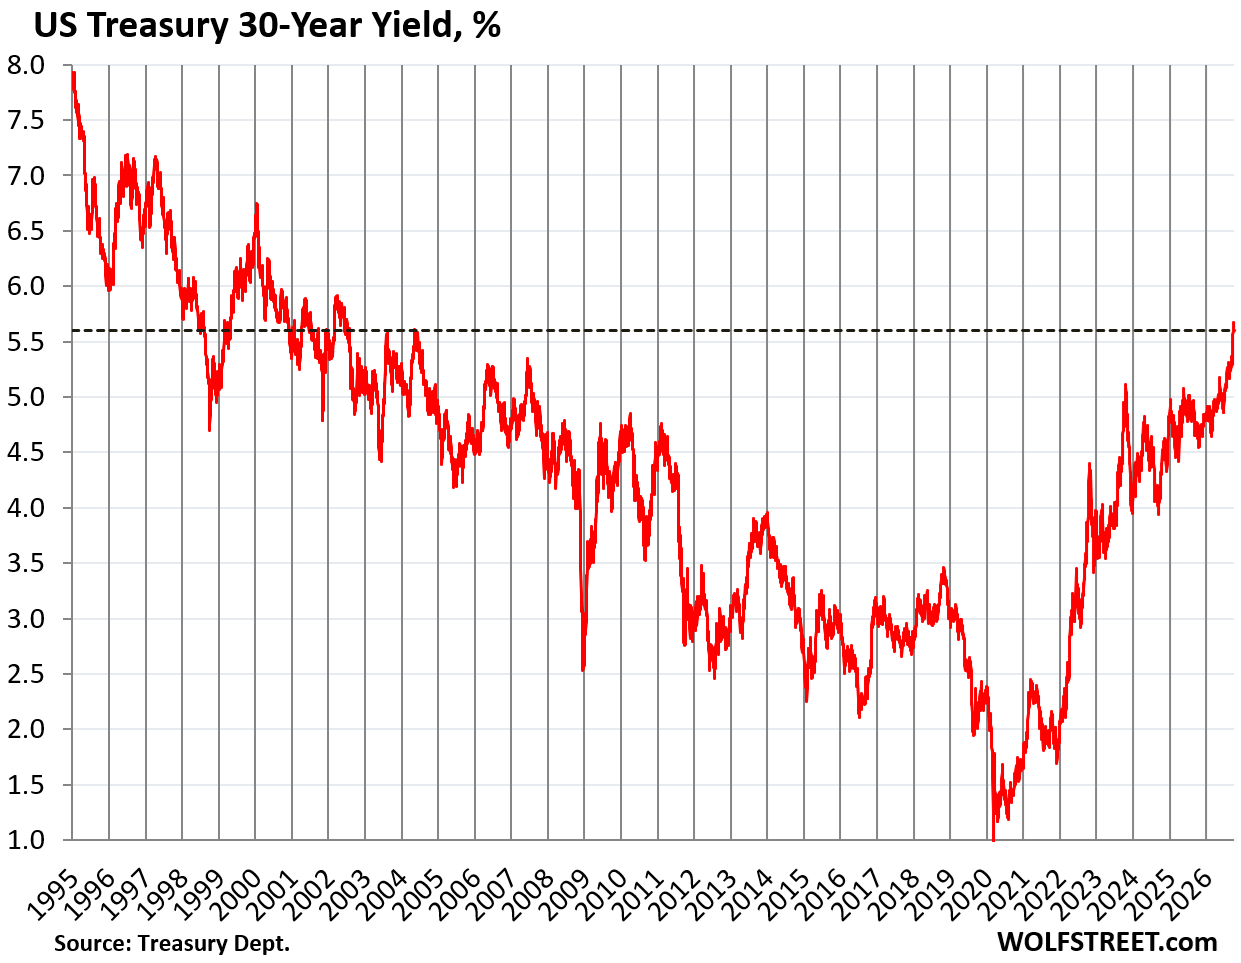
The 30-year Treasury bonds sold at auction on Thursday at a yield of 5.618%, the highest auction yield since the auction in August 2000. That’s the yield it took to sell all $23 billion of bonds.
But there were no 30-year bond auctions between August 2001 and 2005, as the government figured that the coming budget surpluses would obviate the need for the long-bond. By 2005, with deficits re-exploding left and right, the 30-year bond was reintroduced. So there was no auction yield during that four-year gap. And there was a period in 2002, when secondary market trading produced yields of 5.8%.

In overnight trading before the auction, the 30-year yield was trading as high as 5.72%, and that was the yield that opened the mini-floodgates of demand, and as buyers piled in, the yield dropped sharply before the auction, and so the auction yield was a lot lower than hours earlier, and the bond market breathed another big sigh of relief. Sooner or later, higher yields bring out the demand.
On Friday, the 30-year yield closed at 5.60%. Since the end of February, the 30-year yield has risen by 100 basis points. That range of yield in the secondary market is still the highest in 22 years, and over the past two days, it has brought out more buyers.
Thirty years is a long time for stuff to go wrong; for inflation to spiral higher; for the fiscal condition of the federal government to spiral down to where even higher inflation is required to deal with it; for the private sector to start looking for a huge amount of capital to build the next big thing, like the AI bonds currently that the government has to compete with…
All kinds of things can happen in 30 years, and investors want to be compensated with higher yields to take those risks.
But there is vibrant disagreement among investors about how much risk there is, and these differences in opinions is what makes a market where buyers see deals while sellers want to get the heck out. But the Fed had killed those market dynamics with QE from 2008-2022.
At 46 cents on the dollar. The Fed’s QE repressed long-term bond yields. The Fed’s mega-QE starting in March 2020, when it purchased $3 trillion of securities with newly printed money in three months, which repressed the 30-year yield to 1.0%.
This interest rate repression recklessly created a generation of long-term securities that became toxic when yields began to rise.
For example, in November 2020, the government sold a 30-year Treasury bond (CUSIP 912810SS8) at a yield of 1.68%. That bond has now lost more than half its market value.
Here is a price of an official auction: As part of its buyback auctions, the Treasury Department, on October 8, bought back $2 billion at face value of this bond at 46.8 cents on the dollar, paying $936 million for $2 billion of bonds.
Several regional banks, topped by SVB and First Republic, collapsed because they had loaded up on long-term bonds at those toxic yields. There was nothing more reckless that the Fed has ever done than the interest rate repression in 2020-2022.
The government sold $607 billion of Treasury bills this week, at auction yields that reflected the September rate hike plus expectations of at least one more hike over the next few months.
Yields of T-bills react to the Fed’s policy rates and to expectations of the Fed’s policy rates in the near future. They’re less influenced by inflation and supply fears – unlike long-term Treasury securities.
And there’s a lot of money now flowing through those auctions. This week, four T-bill auctions were over $100 billion.
| Treasury bill auctions this week: | ||||
| Type | Auction date | Billion $ | High Rate | Investment Rate |
| Bills 4-week | Oct-08 | 119 | 3.980% | 4.048% |
| Bills 6-week | Oct-06 | 102 | 3.945% | 4.018% |
| Bills 8-week | Oct-08 | 114 | 3.980% | 4.060% |
| Bills 13-week | Oct-05 | 102 | 4.050% | 4.149% |
| Bills 17-week | Oct-07 | 81 | 4.105% | 4.219% |
| Bills 26-week | Oct-05 | 88 | 4.165% | 4.314% |
| Total T-bills | 607 | |||
The $88 billion of 26-week T-bills were sold at the auction on Monday at a “high yield” of 4.165% or at an “investment rate” of 4.314%.
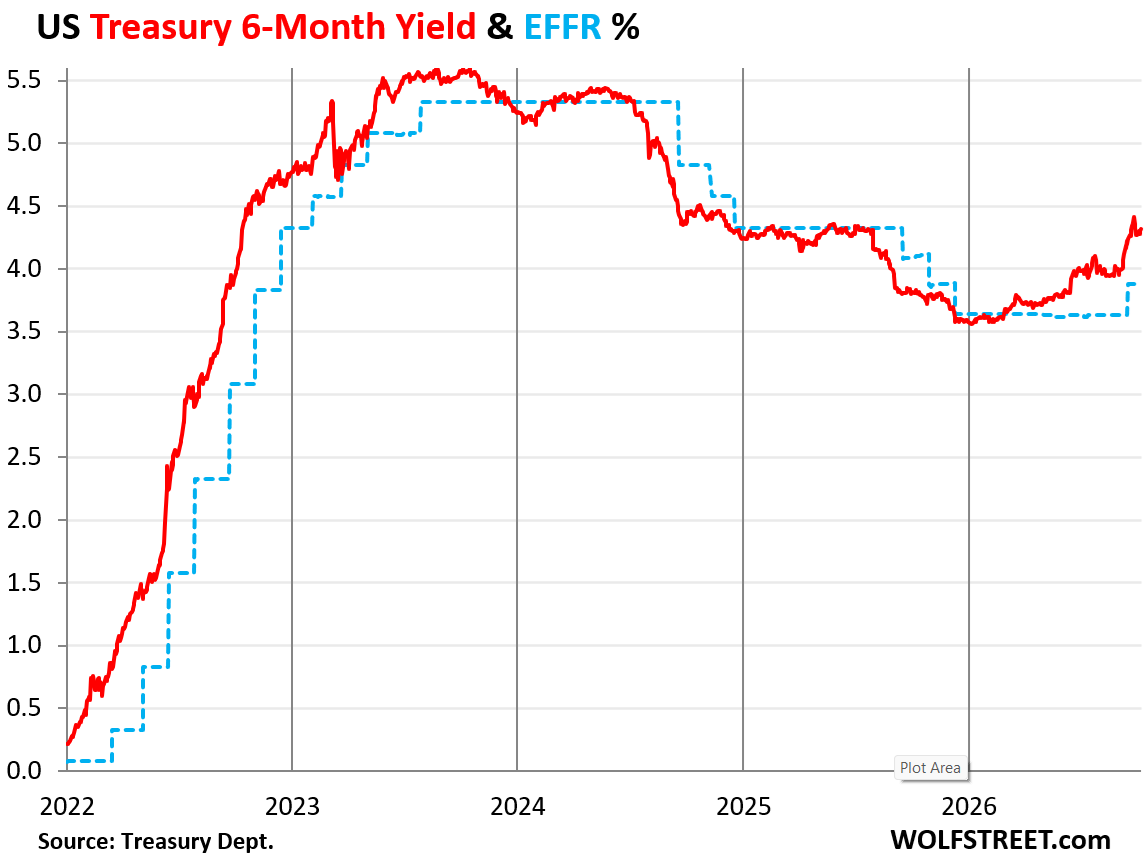
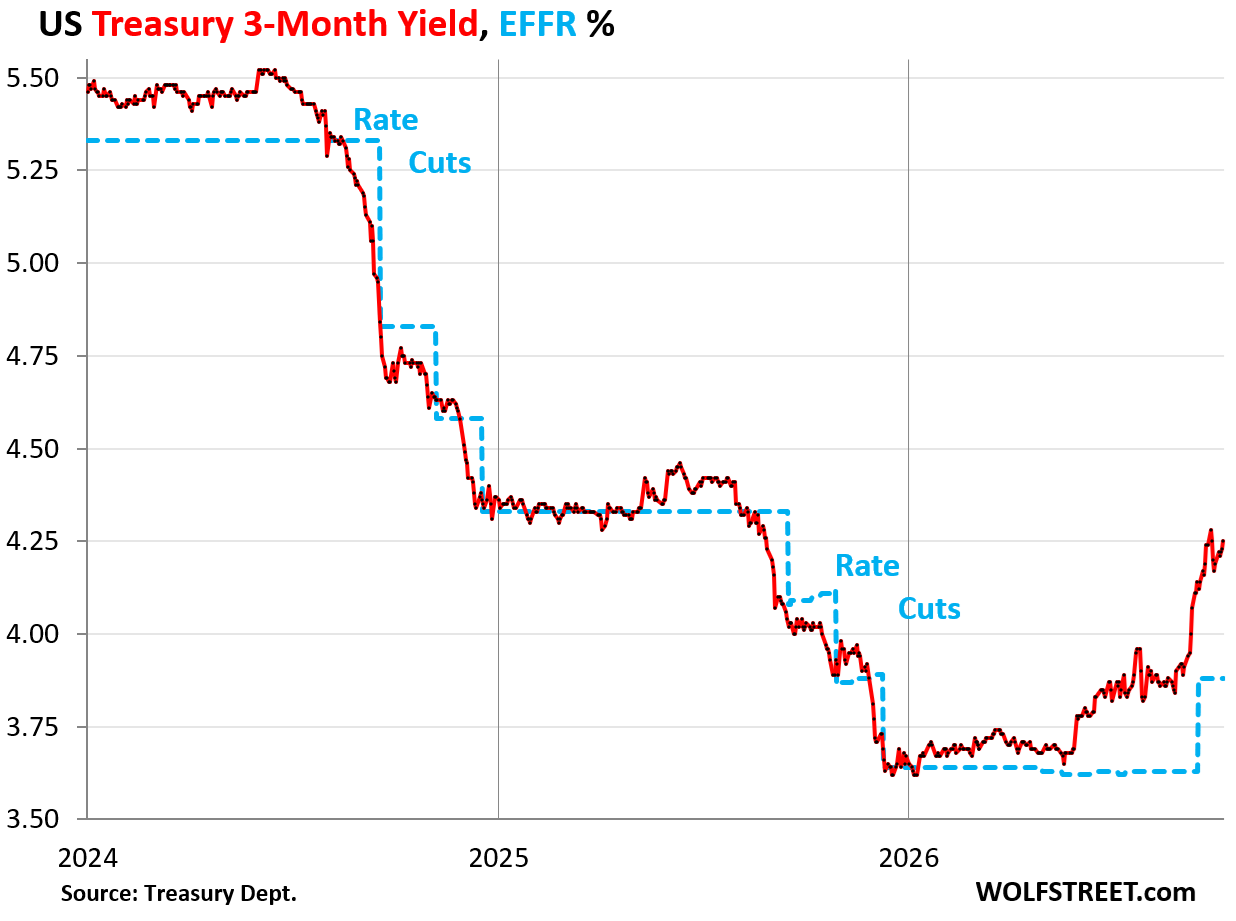
In the secondary market, the 6-month Treasury yield closed at 4.32% on Friday, 44 basis points above the Effective Federal Funds Rate (EFFR, dotted blue, 3.88%), which the Fed targets with its policy rates. This indicates that the Treasury market expects at least one rate hike over the next several months within the time window of this maturity.
The 6-month yield is a pretty good predictor of changes in the Fed’s policy rates. It started lifting off in early 2026 as inflation began to surge, knocking the Fed off its easing bias.
The $102 billion of 13-week T-bills were sold at the auction on Monday at a “high yield” of 4.050% or at an “investment rate” of 4.149%.
In the secondary market, the 3-month yield continued to rise and on Friday closed at 4.33%, the way market indices calculate short-term yields (similar to the “investment rate” at auction); and at 4.25% the way the Treasury Department calculates short-term yields (similar to the “high rate” at auction).
In case you missed it: Despite the AI Debt Pileup, Bond Market Still in La-La-Land, Investors Chasing Yield, Backed by Sky-High AI Stock Valuations
Enjoy reading WOLF STREET and want to support it? You can donate. I appreciate it immensely. Click on the mug to find out how:


I am a buyer here 🍻
Good luck because inflation is going higher
Just curious, but what are you buying? 3 yr, 5 yr, 10 year, 20 yr, longer?
Bullet, or ladder (i.e. “nibbler”)?
Respectfully.
AI debt is better than govt debt?? /s
AI debt is A-rated (’26), B-rated (’27), CCC-rated(’28 and beyond)
grifters in CONS gress are at best CCC rated with 5.6% yield
never intending on paying it back
so we need to convert govt debt(today) into equity($1)
Wolf, Thanks for this great explanation of where we are in the Bond market today. I am very invested in the Bond market and your explanations give me comfort. You should write another book on Bonds.
Agree, like totally dude or dudette!!
But while reading almost all of Wolf’s Wonder,,, I would be very pleased and happy to see only his usual clear explanations regarding the formulae for determining the price/yield of bills and notes and especially bonds when the current market yield/price goes either/both ways???
Just trying my best to understand the reality to do the best I can for my beloved younger spouse due to the very likely continuing ”degradation” of US$, AKA inflation…
Thanks, as always for Wolf and SO many commentors!
When MMMFs stop growing, this is a signal of peak policy rates.
see the history of tops: https://fred.stlouisfed.org/series/WRMFNS
They are about liquidity preference, t-bills vs. bank cds. Bank CDs and deposits are private‑sector liabilities with credit risk, duration risk, and slower repricing.
When rates are rising, t-bill yield rise faster than bank cds. Thus the public migrates into MMMFs. When rates flatten, MMMFs stop growing.
You linked “retail” MMFs, which are $3.0 trillion. They’re part of “Household” MMFs, which are $5.1 trillion as households also hold MMFs indirectly in their 401k and other funds that were NOT “retail” MMF.
Total MMFs, including institutionally held, rose to a record of $8.5 trillion, quarterly data through Q2.
https://wolfstreet.com/2026/09/14/money-market-funds-cds-americans-pile-on-low-risk-investments-despite-so-so-yields-higher-inflation/
You’re right. Institutional MMMFs don’t track bank CDs. Only retail MMMFs do.
When I first saw the relationship, I asked Chat gpt why? I just got carried away with the realization.
“Institutional MMMFs — corporate cash management; repo‑market funding; part of institutional liquidity plumbing.”
The 3.9% IORB vs 4.32% 6‑month T‑bill 42 bps spread reflects a tight policy. I got this wrong initially.
Banks arbitrage overnight, not term:
T‑bills carry duration risk
They require capital (SLR + IRRBB/FRTB)
A Supplementary Leverage Ratio (SLR)
IRRBB stands for Interest Rate Risk in the Banking Book
FRTB capital refers to the minimum market risk capital a bank must hold
The FED is expected to keep policy firm with this spread.
Note: A banking book is the part of a bank’s balance sheet that contains long‑term, hold‑to‑maturity assets and liabilities—mainly loans, mortgages, and customer deposits—accounted for at amortized cost and primarily exposed to credit and interest‑rate risk.
In a taxable account it is almost Nil
However you may be beating inflation, IF the inflation readings are correct.
In a non tax account might be a 1% to the good. Wooo! /s
But anyhow corporate bonds and these treasuries may be headed to double digits in years to come.
> But anyhow corporate bonds and these treasuries may be headed to double digits in years to come.
100% agree.
And nobody should buy long-term bonds — even at 6% — if there is a reasonable chance that yield will double in a few years.
And I think it can happen.
That is the problem. 10 to 30 years from now your dollars will purchase very little, so the immediate return on your bonds must me.much higher than the inflation rate. Inflation is the best way for a government to pay off its debt, period.
*Inflation is the best way for a government to default on its debt.
Sometimes I’m surprised though, I look back at a previous Amazon purchases from say 2016. I paid more back then on some things than today or it is very similar.
Today’s prices of lots of things have the inflation yeah but also the greed factor. Companies just want more profit because consumers will just blame inflation or whatnot then pay the price.
If companies start seeing slow sales perhaps they cut the greed.
yields ok for safety $$
but investment requires safe 15% ROI
not enough blood in street
I still think the wild card is the massive AI funding/debt that is in the shadows. And they must be suffering some hefty paper losses. IMO
All the hysterics by Big AI about how dangerous a rogue AI is are a preparation to shift blame when the house of cards crumbles. They know it.
You know it all might be some scam to get bigger bonuses for productivity! 💵
“Guys have I thought of a great plan!”
Haha /s
“There was nothing more reckless that the Fed has ever done than the interest rate repression in 2020-2022.”
Who is to blame and where is the accountability? Congress has legal oversight of the Fed, the President appoints the board members, and they are approved by the Senate. The Fed is self-funded, and so Congress cannot cut off its funding.
Jerome Powell was the Fed Chair over 2020-2022, and he is now on the board, so no accountability there for recklessness. Were any board members over the 2020-2022 time frame removed for recklessness?
I guess this all gets accounted for by the market–the future “reckless Fed risk.” There is a risk that the Fed could make bad interest rate decisions again, and that gets factored in by the market demanding some incrementally higher return for that risk.
Howdy Youngins. Govern ment ZIRPed you . Welcome to the real world. I dug up my old dust covered original bank book from Lemay Ferry Bank from a state I like to call MISERY. MO. Still has old blue ink showing my bank balance. Sorry, bringing tears to my eyes as happy days are here again.
Party on CASH Loving Sailors.
good explanation for long term trends. my take is usually around 20 years in rising rates and 40 years in falling rates. the cycles are counted in human generations. the great anthropology books, by graeber, ” dawn of everything” and “5000 year history of debt” are must reads. i bet one 9 out of ten bond traders have no clue what the first debts that traded, by human primates, were.
This is approximately true but varies a lot.
For 10-year Treasuries (after inflation adjustment), total returns followed this pattern:
1860-1900: 40 years positive return
1900-1920: 20 years negative return
1920-1940: 20 years positive return
1940-1980: 40 years negative return
1980-2020: 40 years positive return
2020-present: ?? years negative return
Is this going to be like 1900-1920 or 1940-1980?
If you zoom in more, you see that almost all of the negative return is concentrated in a couple of episodes:
1916-1920
1941-1948
1978-1981
2020-2022
Those 4 time periods account for most of the losses.
There are also several periods of almost no gain or loss
1900-1916 (low inflation, low yields)
1948-1978 (high inflation, high yields)
2011-2020 (low inflation, low yields)
2022-present
THANKS FOR THAT. bottom line. the trends are decades long. i remember selling beer and soda on gas lines in 70s. marked up the cost by 10x for price to pay. cops bought beer from me….. teenage logic.
Time to stick a toe in I believe.
If you’re a money manager sticking other people’s toes in.
“If you’re a money manager sticking other people’s toes in.”
…and we have Bingo!
ME en fuego for real now, EU blaming Russia for its own failings, US mid terms….The Donald openly blaming the piano playing Zelensky….
Any attempt at QE will be met with explosive inflation.
As they say in old proverb… if the shoe fits. 👠
Also why would anyone dislike the EU? We’ve saved the dang place at least 3 times from falling by the wayside.
The EU is Americas nice second house.
Has anyone seen Rocky 5? Like what are you people smoking?
Oh sorry Rocky 4.
Rocky 5 was just horrible
Without FED interest rate repression, probably the rates will continue rising. It may look like an extreme scenario, but 10Y rates of 1990s (5-8% may be the new normal.
This is the baseline scenario. In the other scenario, if the FED is forced to repress rates again, the rates may go down for short term, but in that case, FED will loose its credibility and this will quickly lead to skyrocketing to the two-digit rates of 1980s.
Than you, Wolf, for another super informative post.
Interest rates are still low because the US is attracting a good portion of the savings of the whole world. In other countries, with decent economies and prospects, the rates are much higher. In Brazil, the ten-year treasury notes trade at about 12.6%. The inflation rate there is 4.6%. In Indonesia, the ten-year treasury is at 7.2% with inflation roughly the same as the US.
If we go with the old empirical rule that the 10-year should trade by the nominal GDP growth, then the rate should be 6.5%. Perhaps this rule is nonsense, or market participants anticipate that the nominal GDP will slow, but to me the treasuries in the US are not a bargain.
Inflation? Look at the CRB commodity index beginning this year. No wonder there’s an inflation premium:
https://tradingeconomics.com/commodity/crb
When will those who suffered from the Fed’s interest rate repression between 2008-2022 be made whole?
Never. During that time period, a good number of people were made whole plus some. I think that’s how it works over time…
No one is owed anything. Investments are at your own risk. Positive return on savings is not and never has been a guarantee. In fact, for most of human history it wasn’t a thing.
Approximately never ;^)
The quantity of 28- and 56-day T-bills auctioned last Thursday set another new all-time high: $119 b and $114 b respectively.
I tallied all Treasury issuance (bills, notes, bonds) for the last ten years for the period stretching from Jan. 1 up to (and including) Treasury’s annual October auction of 29-year-10-month bonds, in trillions:
2016 = $ 6.5
2017 = $ 6.8
2018 = $ 8.1
2019 = $ 9.3
2020 = $ 16.6
2021 = $ 15.2
2022 = $ 13.2
2023 = $ 16.9
2024 = $ 22.8
2025 = $ 23.9
2026 = $ 25.4
Notice: current year issuance (for the first 40 weeks) is almost 4x that of 2016.
The 10-year CAGR = 13.5%, a rate at which it doubles again in ~ 5.5 years.
2016 US GDP = $18.6 trillion.
2026 US GDP = probably $31 trillion
Ten years: Treasury debt issuance quadrupled, GDP grew 1.7x.
I just want to figure out why the 3 year was 4.93 and the 5 year coming up only going to be 5.05
For 12 extra points people will let the bond be whipping in the wind an extra 2 years?
Look at the short bills vs the 3 year.
an extra .6% of interest for 2.5 years of risk? The buying power lost in 2.5 years of potential Fed rate bumps is easily .6%
I suppose the traders are thinking in 3 years the 3 year will be yielding significantly less than 4.92%…IOW, a bet FED does more rate suppression. In that case, buyng a house now might make more sense.
I lean towards rates settling higher in the 5.5 to 7.5 range for a Ten Year bond. In that scenario, mortgages bounce between 7-9%.
My opinion (as good as anyone else’s opinion) is that it is a bit early yet. At some point in the not-too distant future the inevitable recession/depression is coming, and with it falling interest rates, but not quite yet. I agree the Fed really screwed things up- for years every time there was an opportunity to start raising rates, they found an excuse not to. I TOLD them that people were going to get used to artificially- low rates: I remember screaming it at the television screen when the nightly news announced “Fed holds rates steady.” Anyway, 68 years old and 100% in insured CD’s getting right about 4.0% APY across the whole portfolio, although that is slowly rising as stuff matures and new CD’s are opened. Staying short- nothing longer than 11 months, but at some point I gotta decide when to go long. Call-protected 5 yr brokered CD’s @ about 5.15% at the moment. If those will go a bit higher then maybe…..
“At some point in the not-too distant future the inevitable recession/depression is coming, and with it falling interest rates, but not quite yet.”
If the bond market starts seeing this scenario, long-term yields will begin to fall, and investors will be chasing them down for various reasons including the safe-haven trade. Obviously, this turning point will be one of the toughest calls to make in advance, without the benefit of hindsight.
The idea of long-term fixed income investments is to sit through that scenario with a decent yield and have to nail that call and not have to worry about it (while the market value of your Treasury portfolio goes up as yields drop).
Having 100% in anything is a risky proposition IMO. You are trying to capitalize on a near term drop in stock, bond, and RE markets. If that drop never happens, your share of the wealth pie will shrink, particularly if inflation stays high and they keep ST rates at a relatively low level. As the past 30 years shows, it is hard to overestimate the dovishness of central bankers and Congress.
I would always hold at least 30% in other diversified assets, consistent with the Ben Graham approach to investing. Nobody knows for sure what’s going to happen.
permanent portfolio is my ideal. 25% in gold,bonds,stocks and cash. i went with 5 buckets. 20%each including rental properties. no debt. forthe past few decades. of course we have had easy times in usa since the civil war….. glad i lived in charleston SC for a decade. learned who and how they held onto their mansions and plantation lands………..minority did. sold confederate and US bucks and bought gold was the common thread.
“The year-over-year change in real disposable personal income (after tax, adjusted for inflation) is down to just 1.3% versus the long-term average of 2.5%. So far, slowing income growth has not significantly affected consumption as the savings rate has dropped to compensate.” -Joseph Y. Calhoun III
Party on!
What you said is that disposable income is still outgrowing inflation by a good margin, so then why should spending slow???
It shows inflation is increasing at the expense of wages. Sumner says of his N-gDp level targeting: “Some of the best ideas are wrong”.
“This is important because NGDP has four components: wages, capital income, indirect business taxes and depreciation. As a result, NGDP has been rising more than 6.5%/year even as average hourly earnings growth has slowed to 3%:”
No, it doesn’t show that. The bigger portion of inflation in GDP (+4.4% yoy) is business-facing inflation (PPI +5.4% yoy), it’s far higher than consumer-facing inflation (PCE price index +3.4%). Inflation has been hitting businesses far more than consumers, that’s what this shows. All “Sumner” (who is he?) has to do is look a the data.
Sumner is a Ph.D. economist from Chicago that advocated N-gDp level targeting. He didn’t say inflation had replaced wages, I did. Notice the quotes.
With the implicit price deflator @6.1% for Q2, I don’t think that’s an exaggeration.
But I like your explanation better.
Still take issue with the term interest rate repression. The FED responded (correctly or incorrectly) to the RMBS debacle and COVID by increasing demand (its own) for agency RMBS and Treasuries. (Whether they overcompensated everyone can debate.) The Fed’s increased demand was terminated (QT) in 2017, before Covid and again in 2022 after Covid. Since January 2026 the Fed has been neutral on QT.
Concurrent from Jan 2026 has been Bessent’s (imho) mishandling of Treasury issues and the flood of USGovt debt. Supply and demand are responding accordingly.
“interest rate repression” is the technical term for what the Fed did. It’s also called “financial repression.”
Whether that was justified or not, or good or bad, or evil or divine is a judgement different people make differently. But it is called “interest rate pression” and “financial repression,” and there is zero you can do about that.
“ US Government Sold $728 Billion of Treasuries this Week.”
We live in interesting times – at the beginning of this month, the man in the big, white house made the comment that if the Democrats win the midterms, we will have an economic depression. (‼️). That’s quite a change from another comment he made recently when he said that ‘We are doing better (economically) than we ever have.’ Considering the economic depression comment, it will be interesting to see how many $Billions of Treasuries will be sold, if any, at this time next year.
the house dad built in 1959, is now worth 100x more than his cost to build. 100x. 30k to 3million USD/aka electronic digits……. means my benjamin today was like a george washington/barbara bush single of yesteryear. for the upscale wall street bedroom community…….i grew up in.
@Wolf – How dare foreigners demand higher interest rates from us? Can’t we just force them into taking lower rates by threatening to Bomb their nations or call our NGOs in those nations to start their fake protests and topple their government?
We did it successfully in Pakistan, Sri Lanka, Bangladesh and Nepal. In Pakistan, we successfully installed a military controlled government. We have been trying regime change in India also with mixed success. Possibly in France too. How dare these foreigners demand higher rates?
Hi Wolf. Why would someone want to buy riksy long duration (10 year) AI bonds like the SpaceX one when one could get lower duration ones from US govt instead?
Those AI bonds should probably be paying maybe 30-50 more interest than their current rates, given the tendency of the US govt to print money at the first opportunity. The USTs should pay more too.
I don’t know who bought those. It wasn’t me.
Another good illustration of the profound impact of Fed interest rate repression would be to overlay a “US Fed Debt-to-GDP” chart over that 10 year Treasury rate chart going back decades.
Despite the relentlessly worsening Fed debt-to-GDP ratio, until unZIRP the Fed managed to print enough money to buy enough Treasuries so that the 10 year Treasury rate actually more or less continuously declined – even to the point of getting within shouting distance of 0-1%(despite ever worsening Federal financials).
In the real economy, worsening financials result in *higher* not *lower* borrowing rates for normal entities.
But the Fed’s ability to print magic money deranges that relationship.
At the cost of inevitable inflation.
Because there is no free lunch.