
Rent growth is re-accelerating in all 25 metros and spiking in AI IPO epicenter San Francisco.
By Wolf Richter for WOLF STREET.
Rent growth is re-accelerating, both for single-family rentals and for apartments in multifamily properties, after a period of substantial deceleration off the spike.
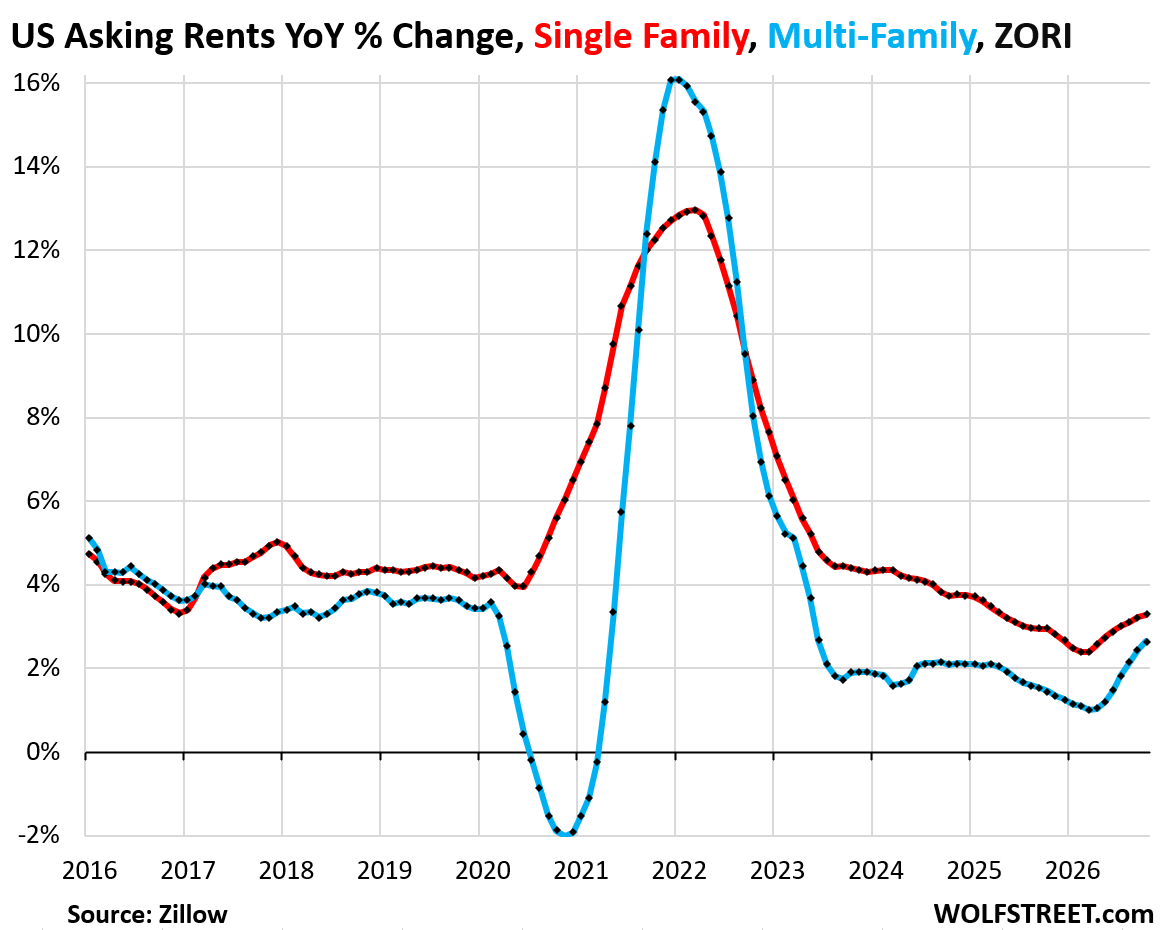
Single-family mid-tier asking rents across the US rose by 0.3% in October from November, and by 3.3% year-over-year (red in the chart), the fastest year-over-year growth rate since April 2025, when rent growth was still decelerating, according to data from the Zillow Observed Rent Index (ZORI).
Multifamily mid-tier asking rents in apartment buildings across the US rose by 0.3% in October from November, and by 2.7% year-over-year, the fastest year-over-year growth rate since June 2023 (blue in the chart below). A multifamily construction boom during the pandemic has flooded many urban areas with new higher-end supply that has been coming on the market over the past few years, causing substantial downward pressure on rents, causing multifamily rents to decline for a while in numerous markets. But that’s largely over.
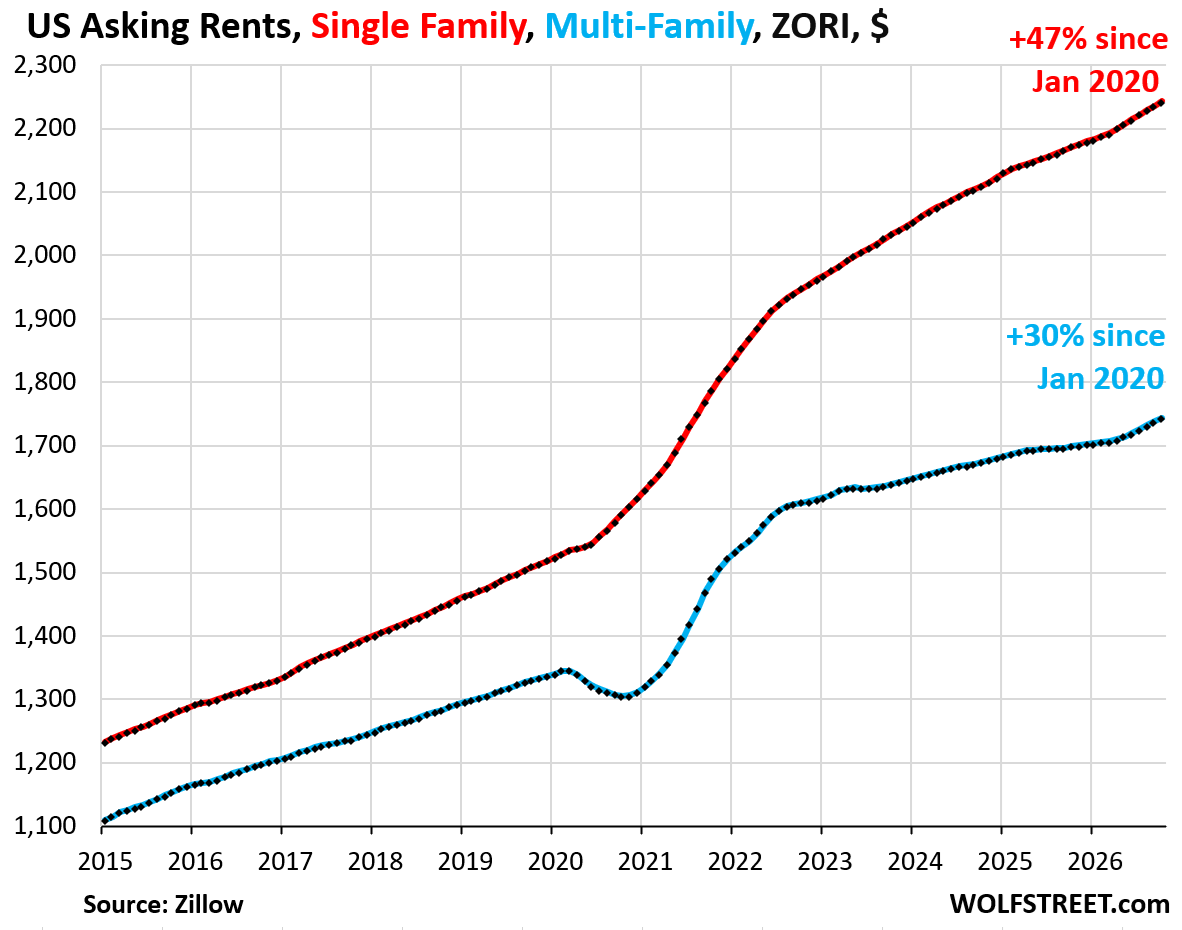
In the chart above, note the re-acceleration this year, visible in the steepening slopes of the lines.
In percentage terms: This chart shows the year-over-year rent increases on a national basis. Note the acceleration:
Since January 2020, asking rents for apartments in mid-tier multifamily buildings across the US have soared by 30%, despite declines in 2024 and 2025 in many markets, and also in 2020 briefly.
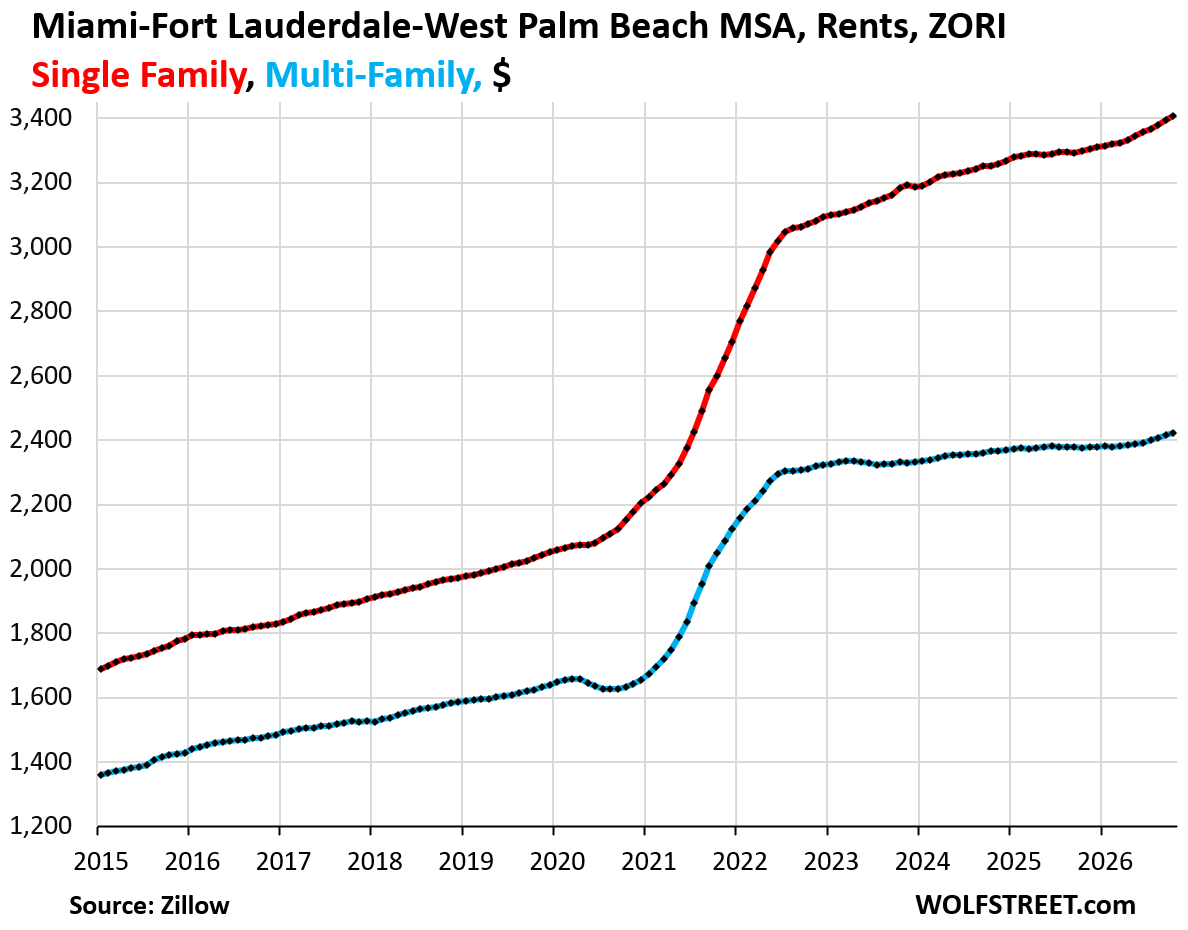
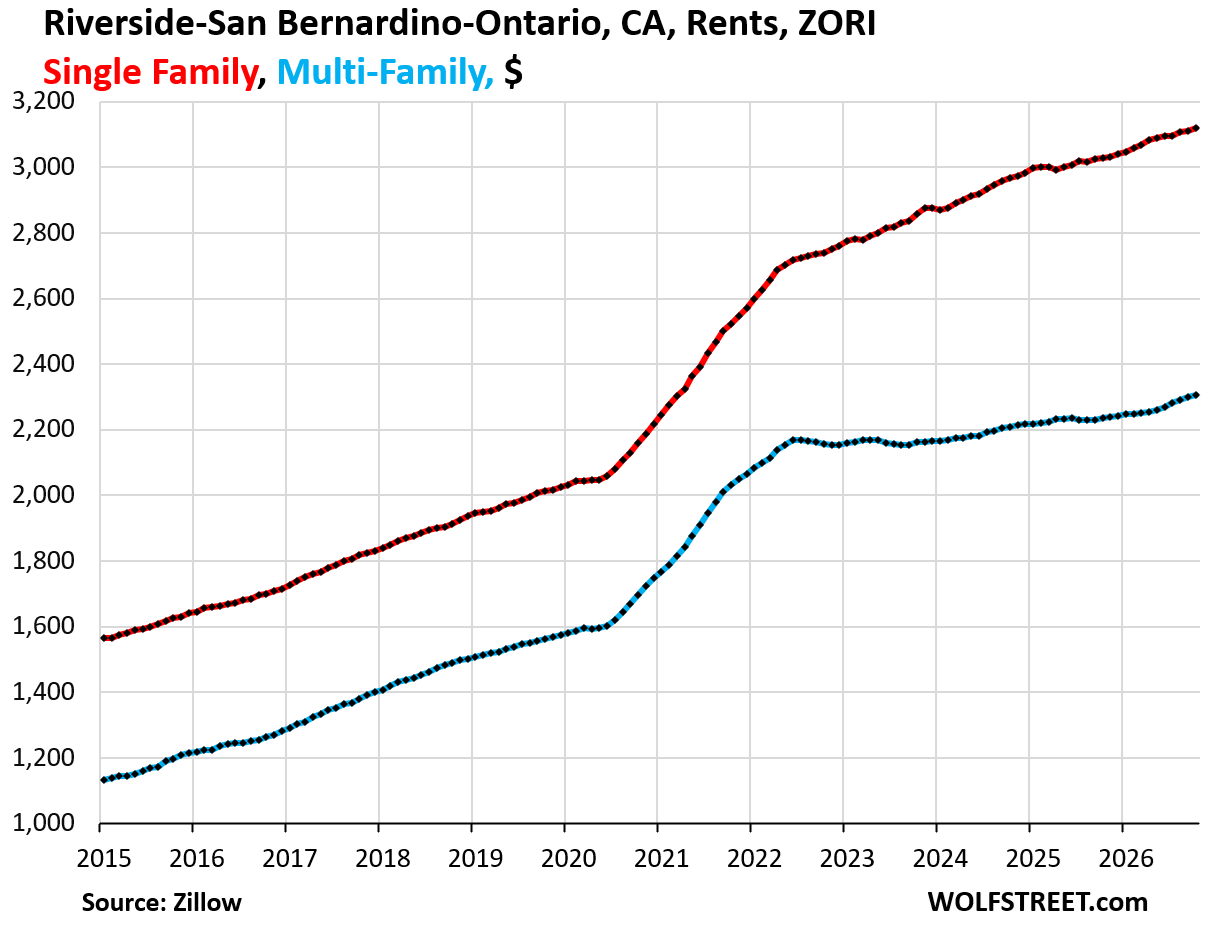
In some metros, the rent increases since January 2020 were far bigger, for example +47% in the Miami-Fort Lauderdale-West Palm Beach metropolitan statistical area (MSA) or +41% in the Riverside-San Bernardino-Ontario MSA in southern California and also in the Tampa Bay Area.
For single-family rentals, asking rents have exploded by 47% since January 2020, with some MSAs booking massive rent explosions, such +65% in the Miami MSA or +60% in the Cleveland MSA.
Asking rents are what landlords want to get for their vacant units that are advertised for rent, but don’t include incentives, such as two months free rent. Asking rent metrics don’t track the actual rents that current tenants are paying. All data here is from the mid-tier Zillow Observed Rent Index (ZORI).
By contrast, actual rents paid by current tenants and new tenants are tracked by the Consumer Price Index for rent (CPI Rent of Primary Residence), based on a large sample of rental units by address, where tenants come and go over time. But this CPI rent data lacks granularity, such as single-family rents versus multifamily rents.
Asking rents are an indicator of the direction of actual rents. Sharp increases in asking rents make their way into actual rents as more new tenants sign leases and as current tenants renew at higher rents. Asking rents are now showing rent pressures building up again.
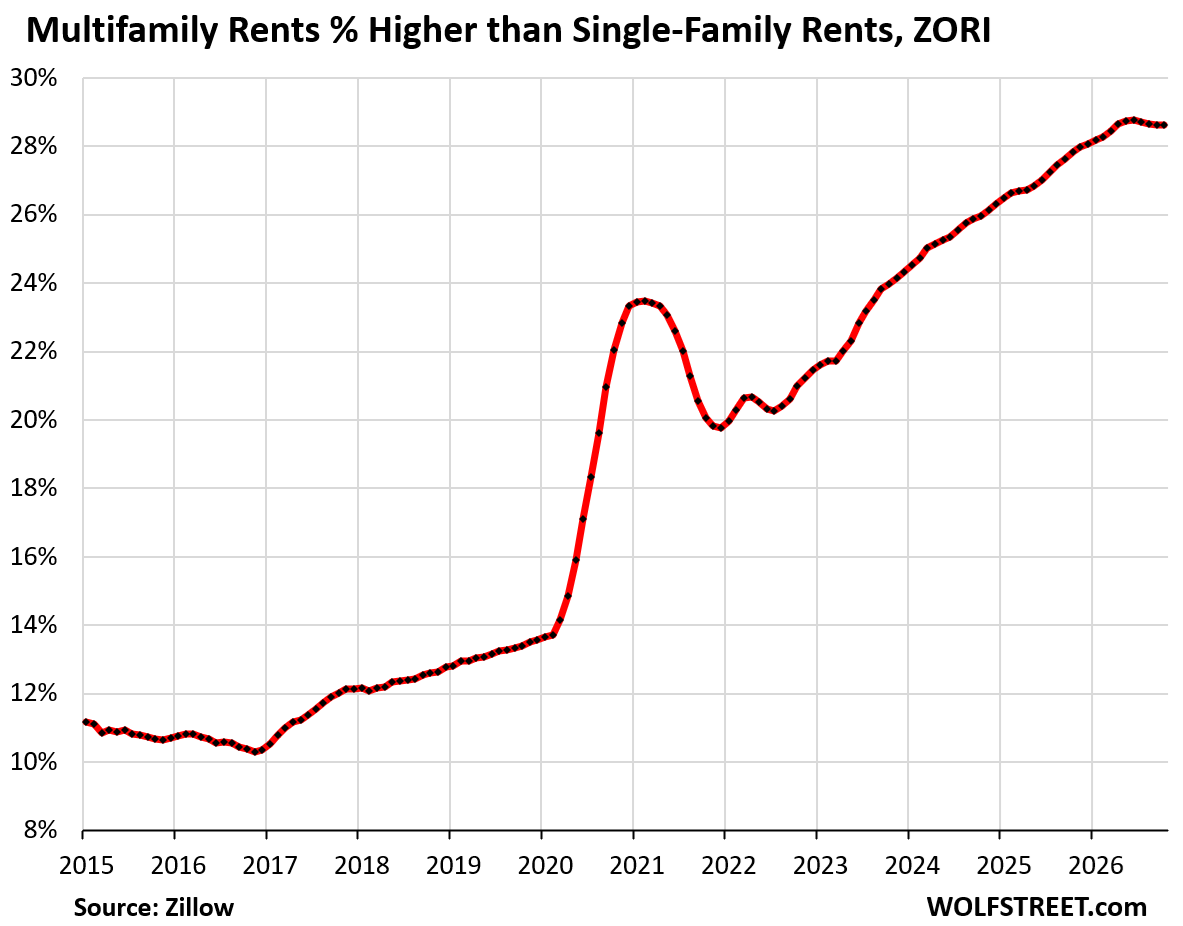
The gap between the single-family and multifamily ZORI had widened dramatically since 2017 and exploded during the pandemic.
In the years before 2018, rents in single-family rentals were about 10% to 12% higher than in multifamily rentals. As single-family rents exploded starting in 2020, while multifamily rents fell at first before also shooting higher, the gap widened massively. At the widest point in May 2026, single-family rents were 28.8% higher than multifamily rents.
In October, the single-family ZORI was 28.6% higher than the multifamily ZORI, as multifamily rents have been re-accelerating at a slightly faster pace than single-family rents, and so the gap has narrowed marginally.
Single-family & multifamily rents in 25 large US metros.
Below are 25 of the largest metropolitan statistical areas (MSAs), each with a population of at least 2.2 million people, for a combined population of 140 million.
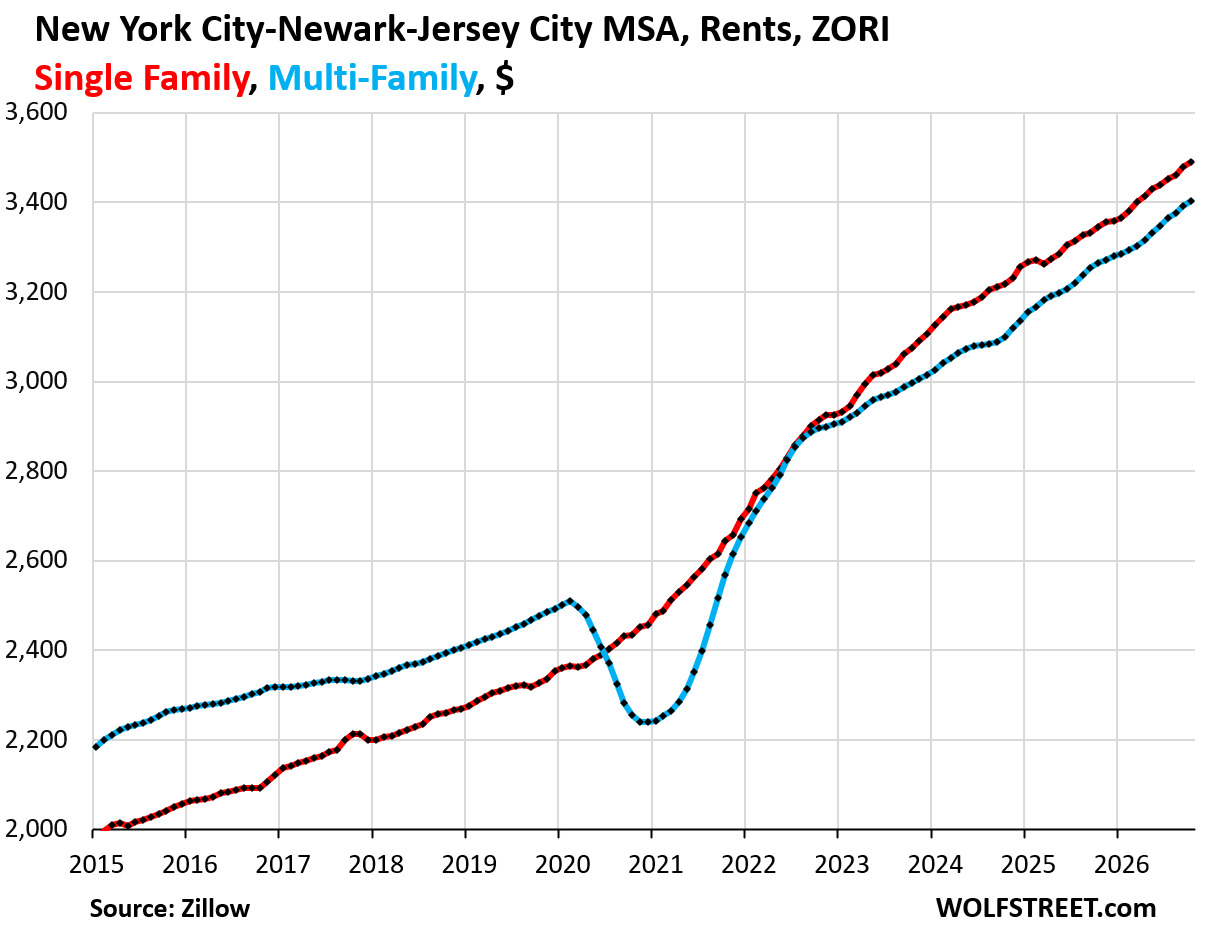
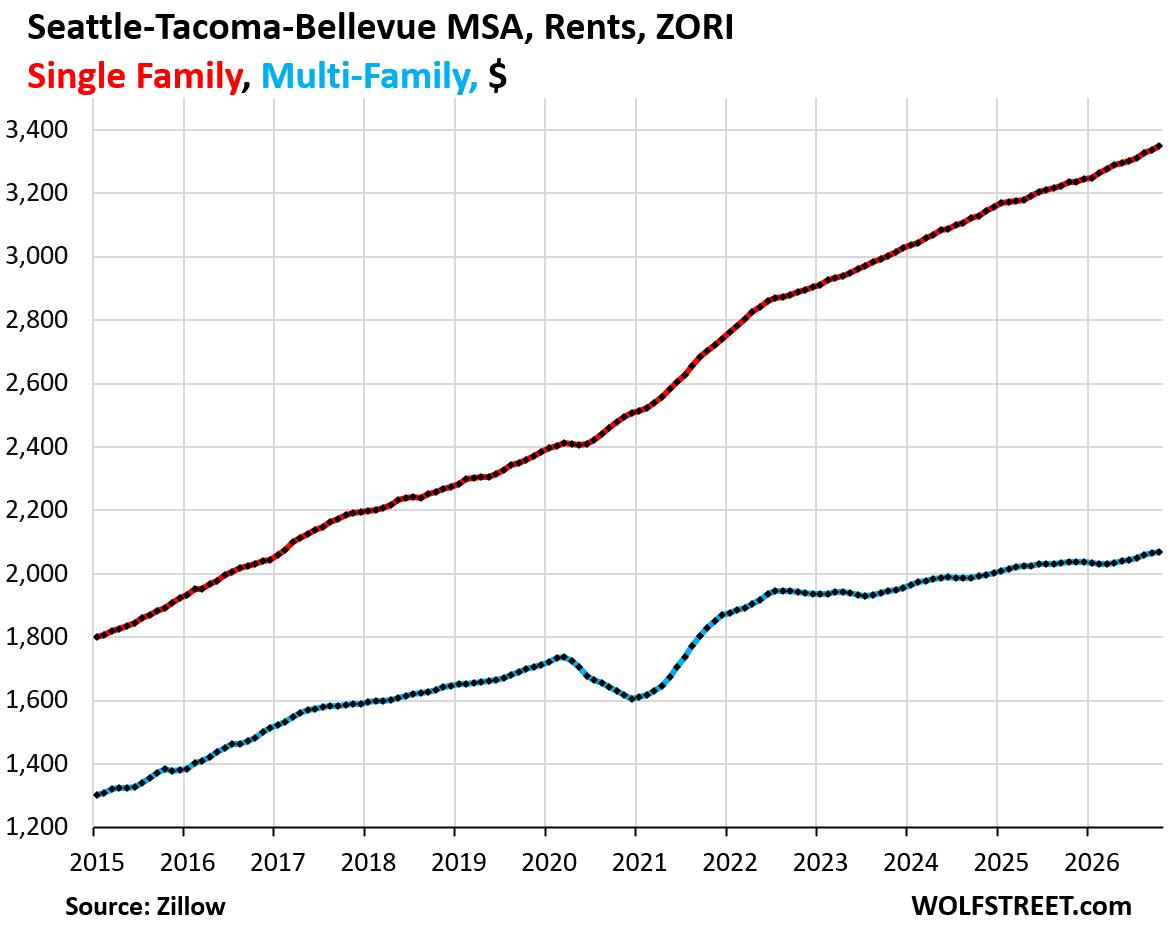
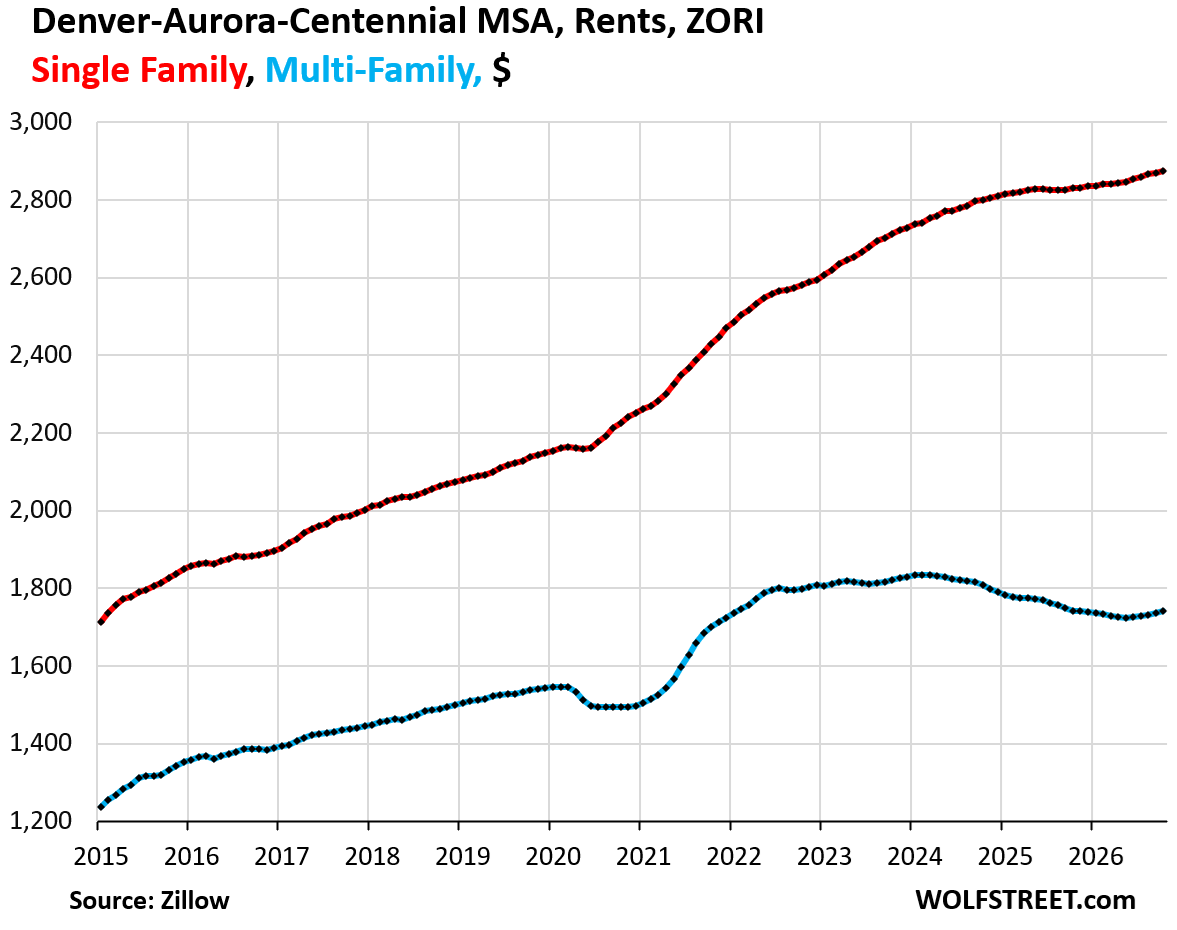
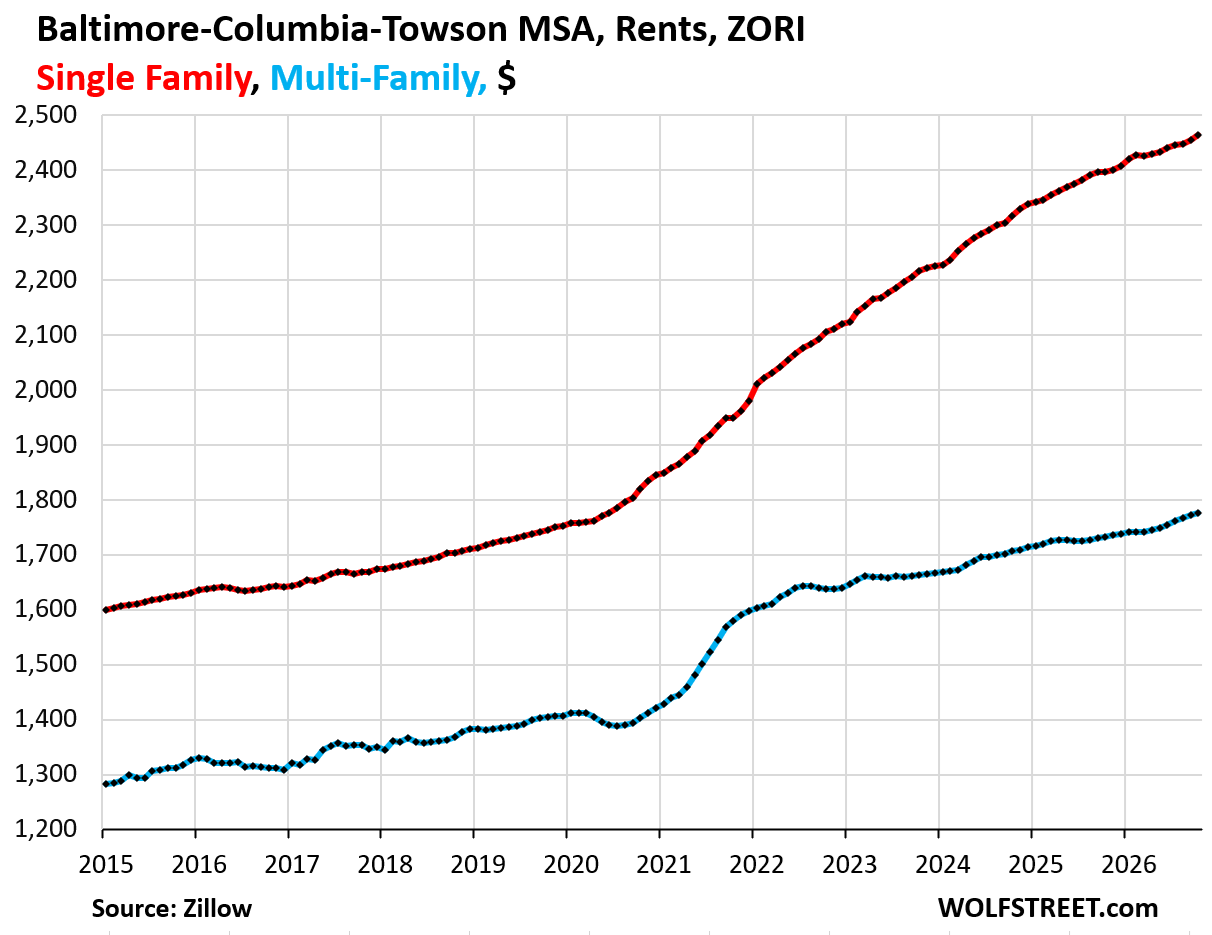
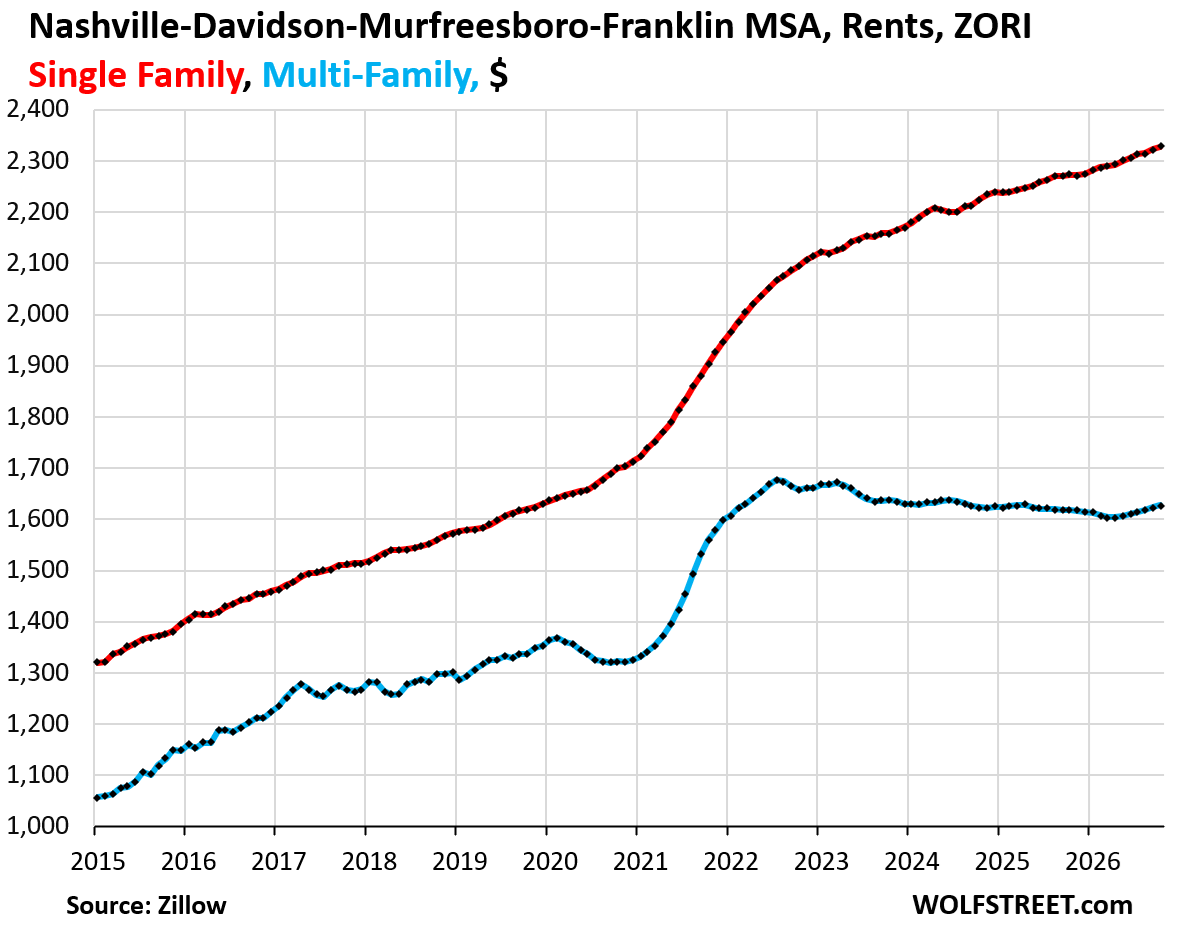
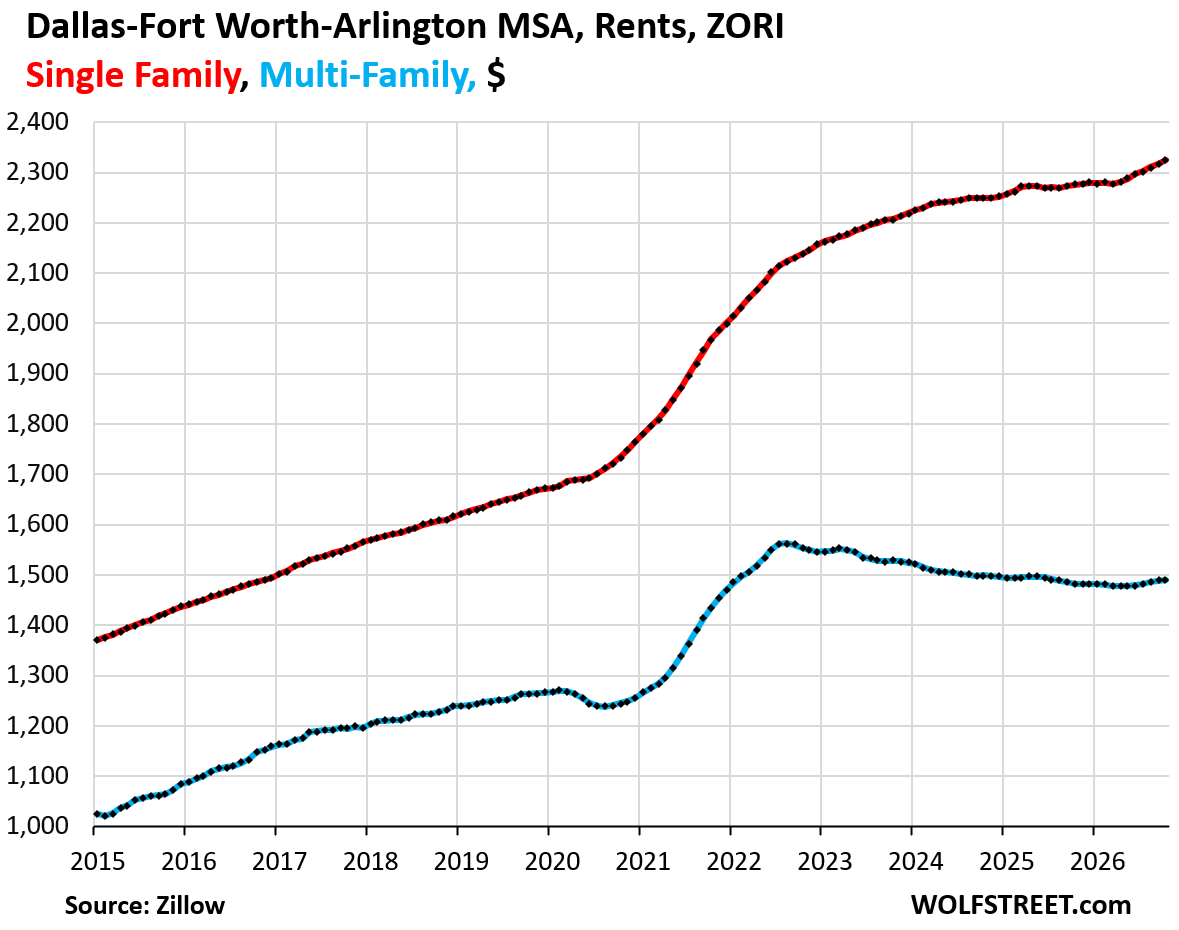
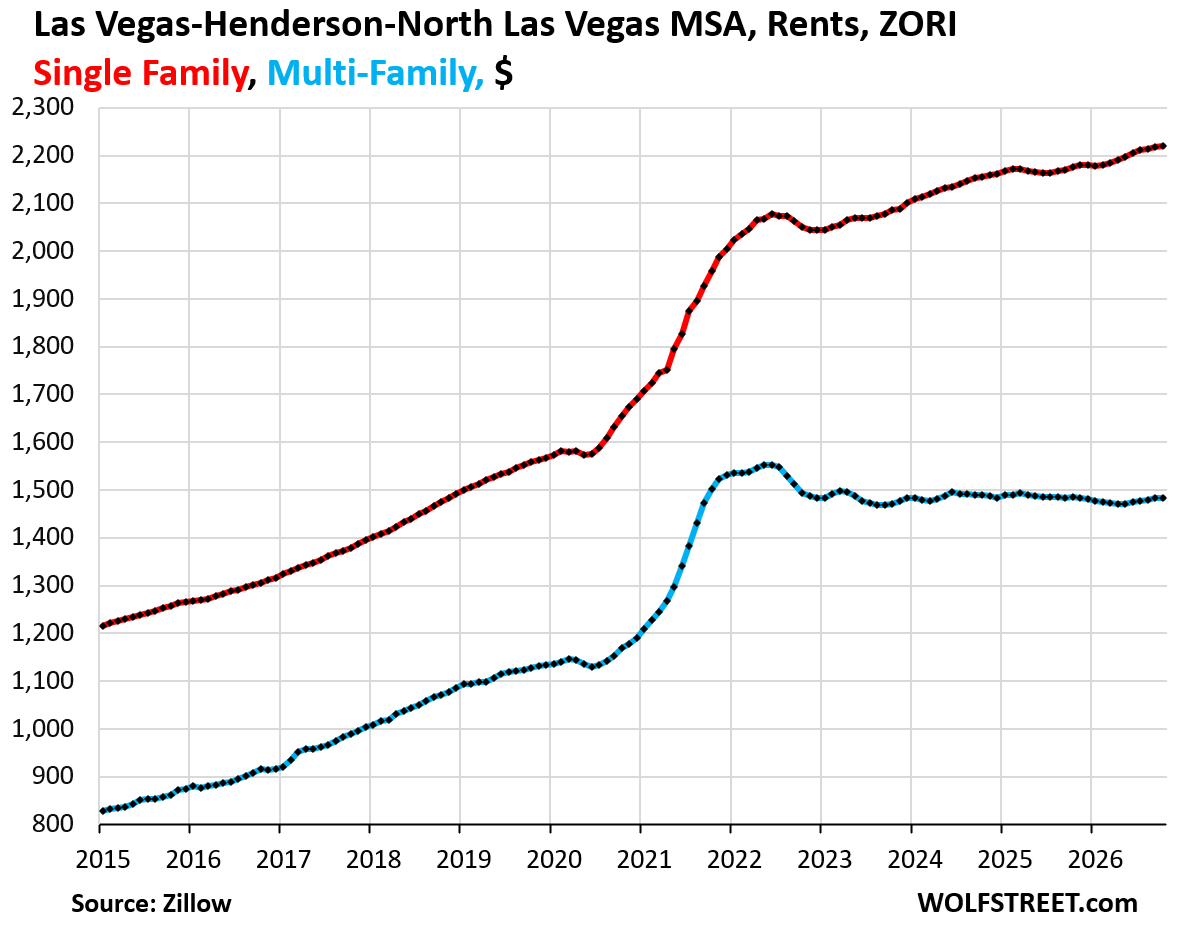
Each chart shows single-family asking rents (red) and multifamily asking rents (blue). The little tables show the month-over-month (MoM) change, the year-over-year (YoY) change, and the increase since January 2020, for each.
| New York City-Newark-Jersey City MSA, Rents | |||
| MoM | YoY | Since 2020 | |
| Single-family | 0.4% | 4.3% | 47.9% |
| Multifamily | 0.3% | 4.2% | 36.1% |
The New York City MSA is the only market in this lineup here where single-family and multifamily rents have not dramatically diverged, but have increased in near-lockstep and are close together, like driven by the immensely expensive multifamily rental market in New York City itself.
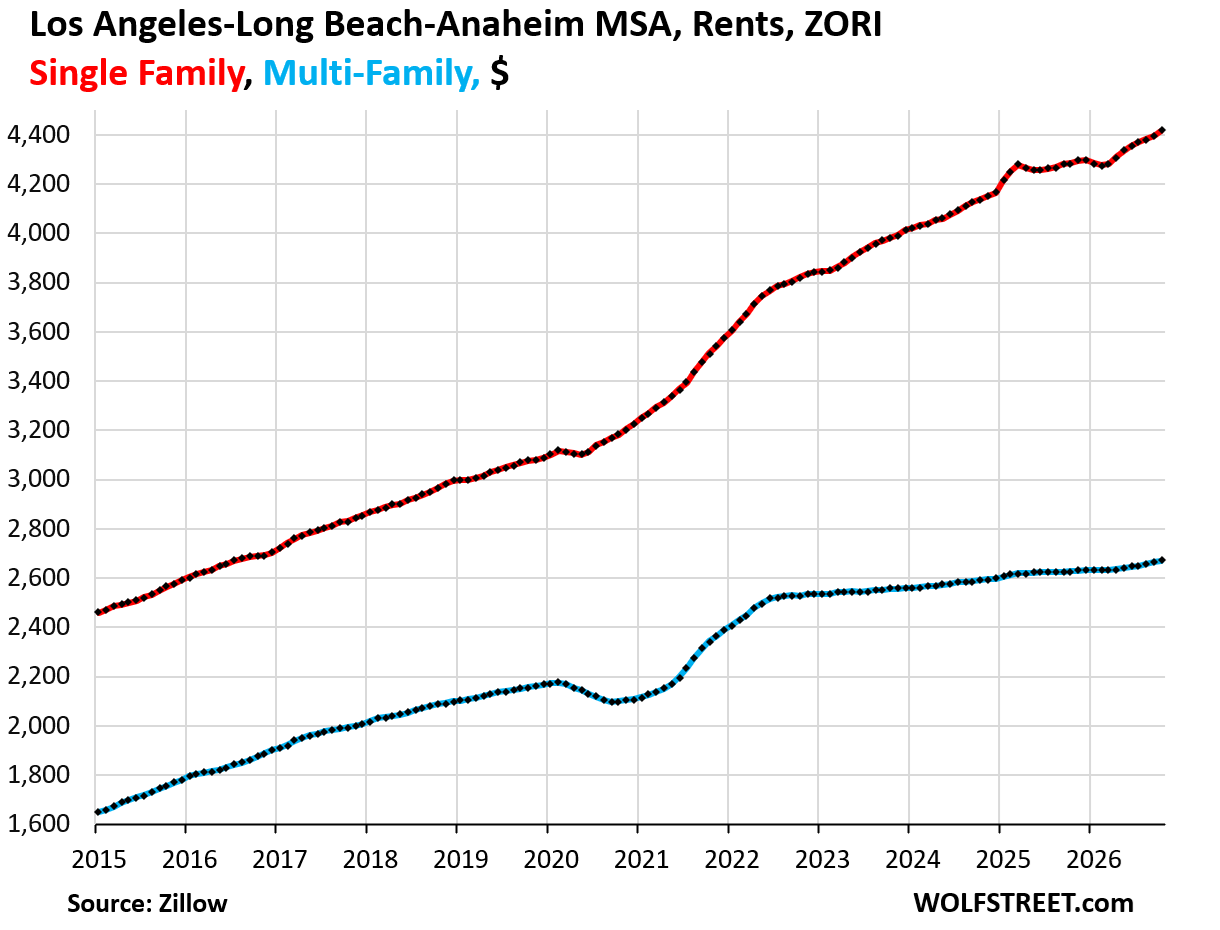
This vast and diverse metro has the most expensive multifamily rentals in this lineup, but the single-family rents are far more expensive in the Los Angeles-Long Beach-Anaheim metro and in the San Francisco–Oakland–Fremont metro.
| Los Angeles-Long Beach-Anaheim MSA, Rents | |||
| MoM | YoY | Since 2020 | |
| Single-family | 0.5% | 3.1% | 42.5% |
| Multifamily | 0.2% | 1.6% | 22.8% |
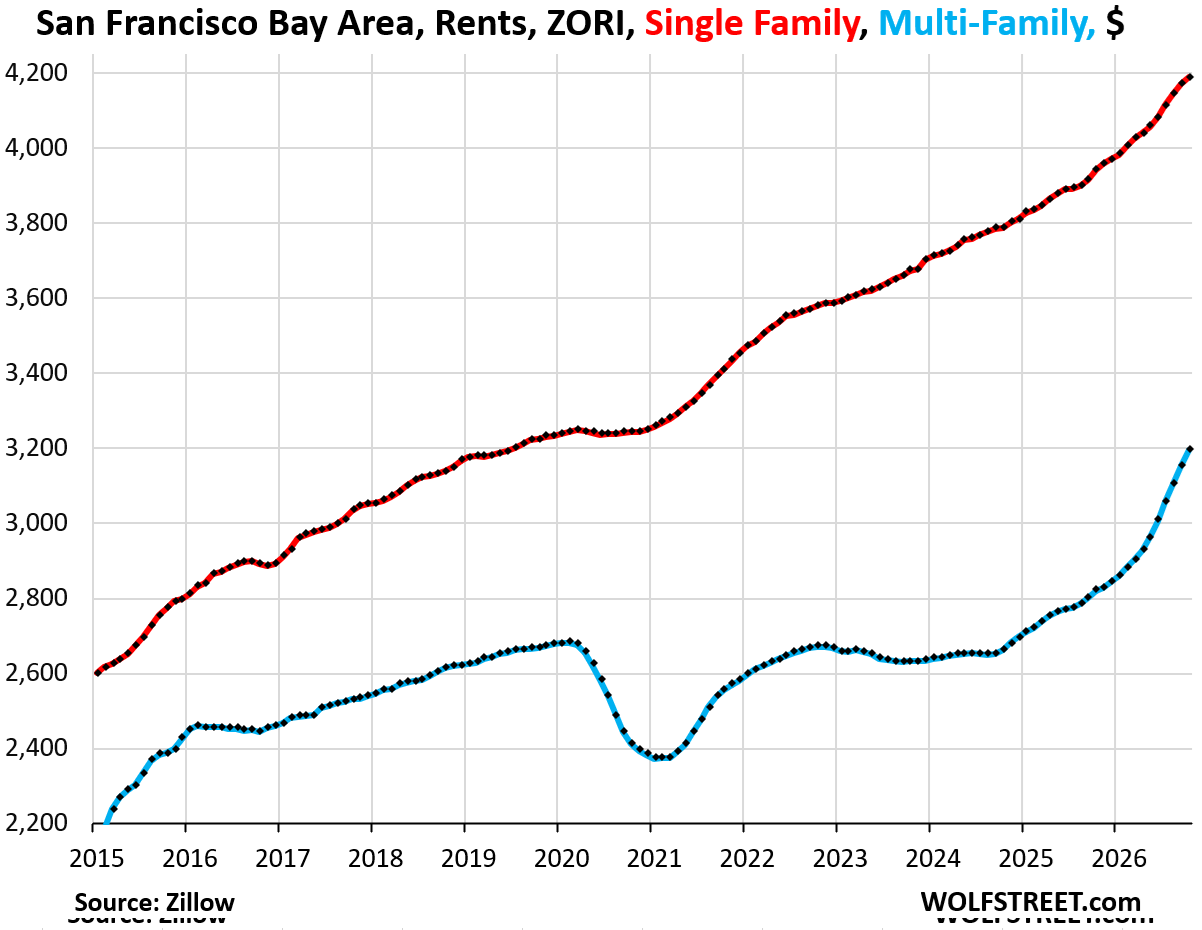
| San Francisco–Oakland–Fremont MSA, Rents | |||
| MoM | YoY | Since 2020 | |
| Single-family | 0.5% | 6.2% | 29.4% |
| Multifamily | 1.4% | 13.3% | 19.1% |
AI mania has taken over the City of San Francisco, including the rental market, and rents are spiking massively. But here we’re looking at the San Francisco–Oakland–Fremont MSA, which includes Oakland and many other cities where rents are not spiking, thereby watering down the rent spike in the chart:
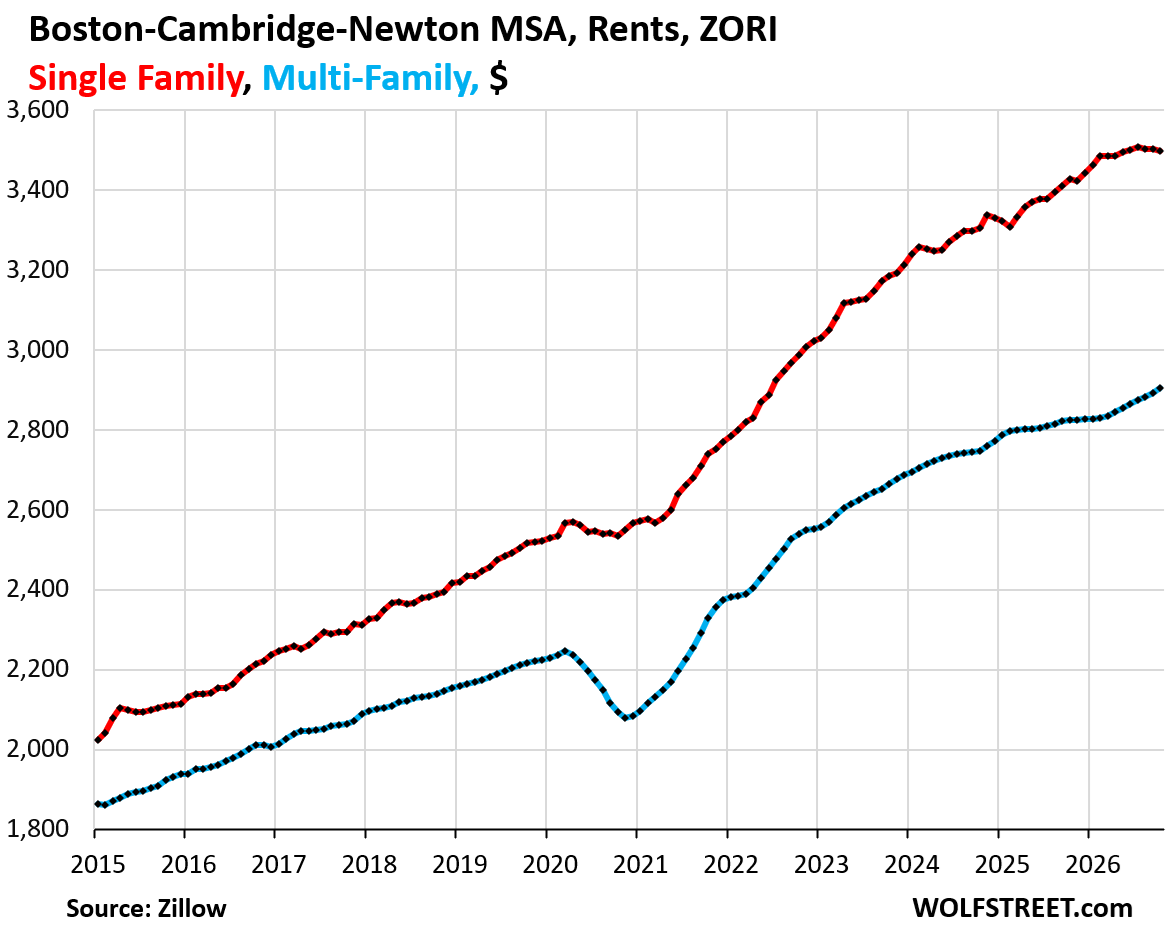
| Boston-Cambridge-Newton MSA, Rents | |||
| MoM | YoY | Since 2020 | |
| Single-family | -0.1% | 2.0% | 38.3% |
| Multifamily | 0.4% | 2.8% | 30.3% |
| Miami-Fort Lauderdale-West Palm Beach MSA, Rents | |||
| MoM | YoY | Since 2020 | |
| Single-family | 0.3% | 3.3% | 65.6% |
| Multifamily | 0.3% | 1.9% | 47.0% |
| Seattle-Tacoma-Bellevue MSA, Rents | |||
| MoM | YoY | Since 2020 | |
| Single-family | 0.3% | 3.6% | 39.8% |
| Multifamily | 0.2% | 1.5% | 20.1% |
| Riverside-San Bernardino-Ontario MSA, Rents | |||
| MoM | YoY | Since 2020 | |
| Single-family | 0.3% | 3.1% | 53.6% |
| Multifamily | 0.3% | 3.2% | 45.8% |
| Denver-Aurora-Centennial MSA, Rents | |||
| MoM | YoY | Since 2020 | |
| Single-family | 0.1% | 1.6% | 33.4% |
| Multifamily | 0.3% | -0.1% | 12.6% |
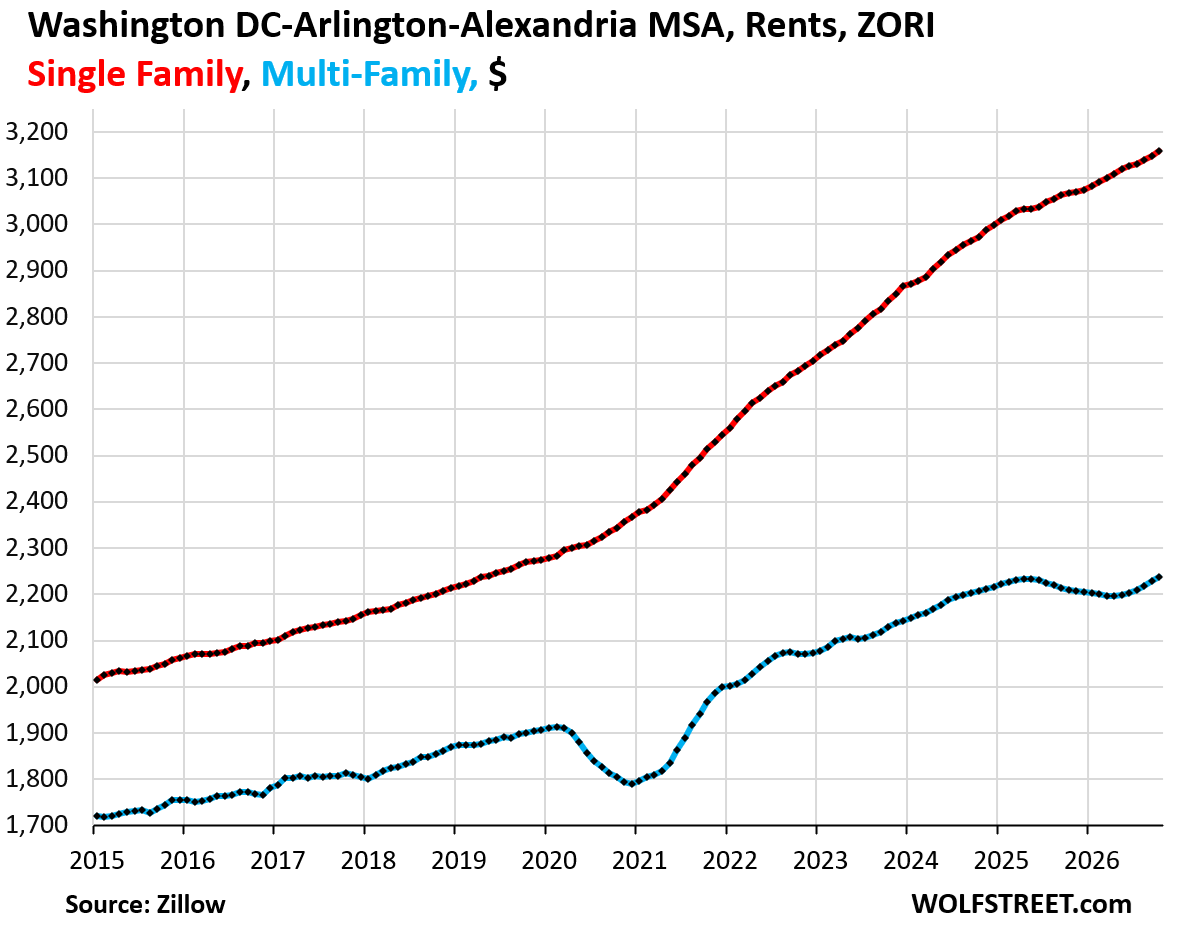
| Washington DC-Arlington-Alexandria MSA, Rents | |||
| MoM | YoY | Since 2020 | |
| Single-family | 0.3% | 3.0% | 38.6% |
| Multifamily | 0.4% | 1.3% | 17.1% |
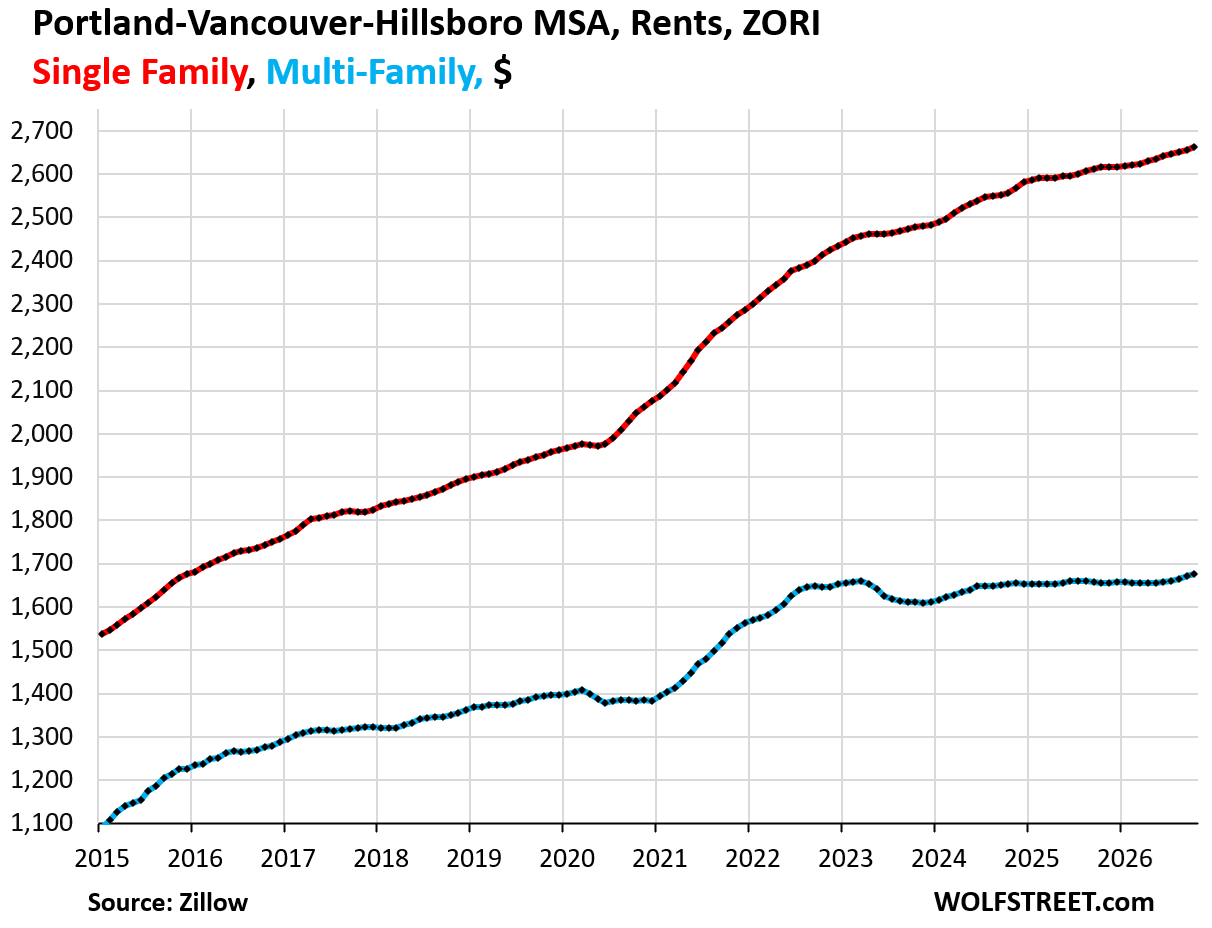
| Portland-Vancouver-Hillsboro MSA, Rents | |||
| MoM | YoY | Since 2020 | |
| Single-family | 0.2% | 1.8% | 35.4% |
| Multifamily | 0.3% | 1.3% | 19.8% |
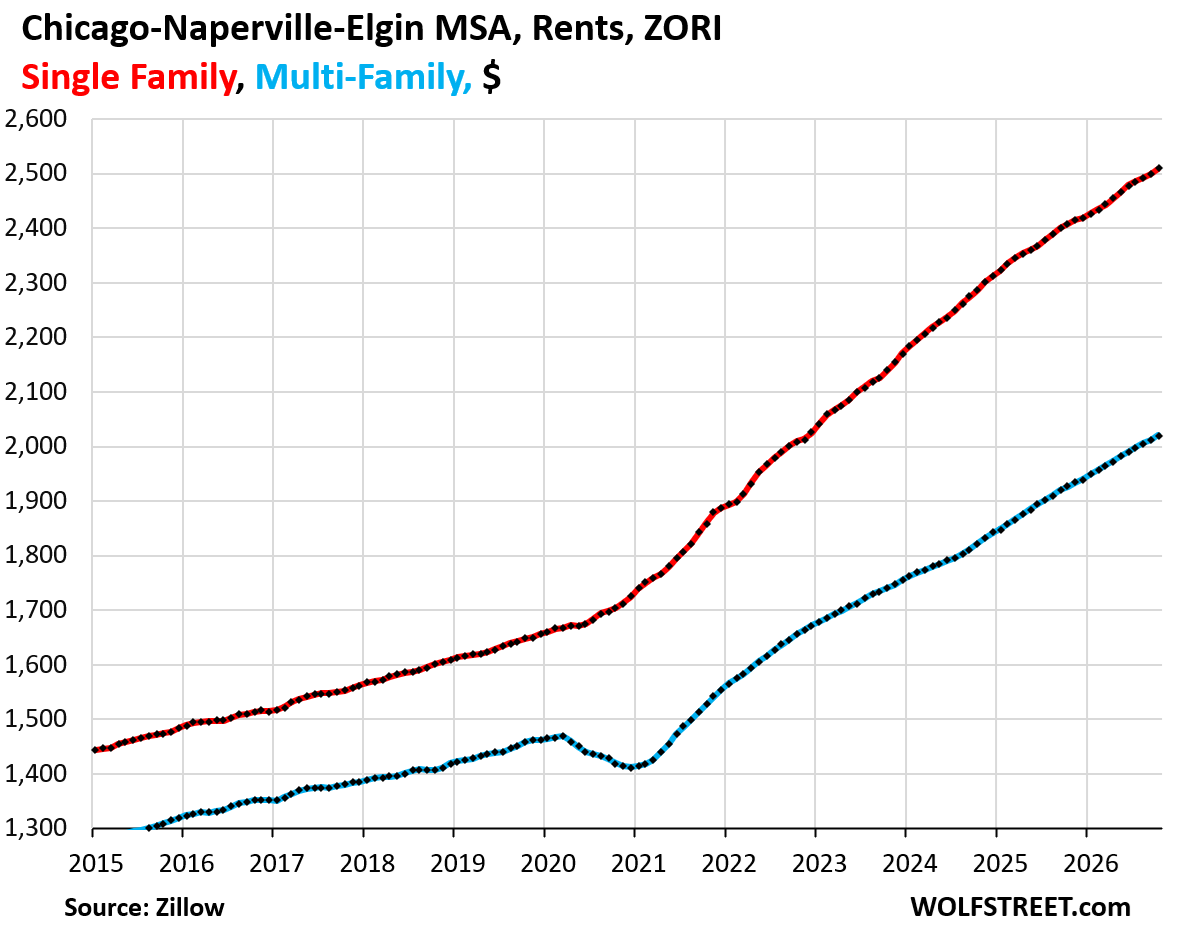
| Chicago-Naperville-Elgin MSA, Rents | |||
| MoM | YoY | Since 2020 | |
| Single-family | 0.4% | 4.2% | 51.2% |
| Multifamily | 0.4% | 4.9% | 38.0% |
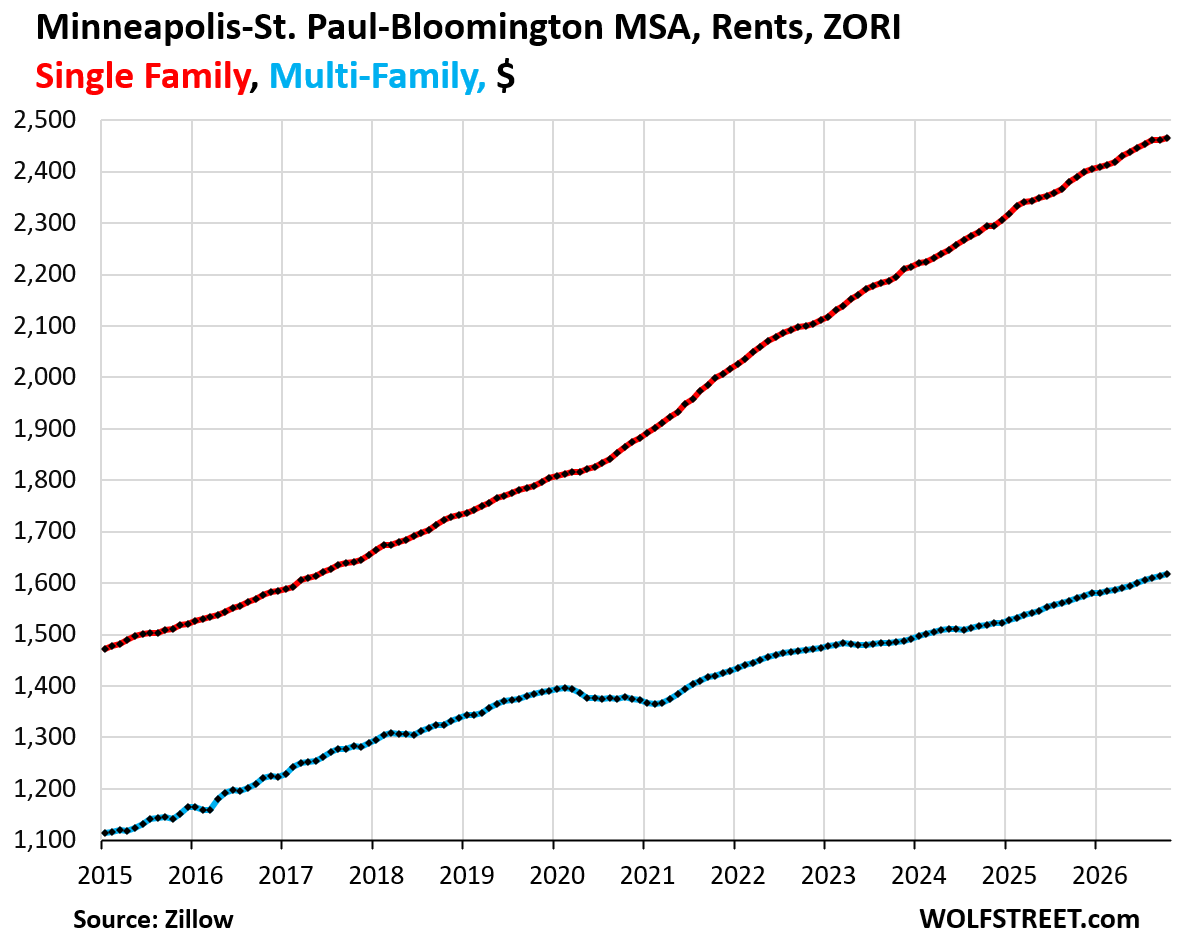
| Minneapolis-St. Paul-Bloomington MSA, Rents | |||
| MoM | YoY | Since 2020 | |
| Single-family | 0.1% | 3.2% | 36.3% |
| Multifamily | 0.2% | 2.9% | 16.0% |
| Baltimore-Columbia-Towson MSA, Rents | |||
| MoM | YoY | Since 2020 | |
| Single-family | 0.3% | 2.8% | 40.1% |
| Multifamily | 0.3% | 2.6% | 25.8% |
| Nashville-Davidson-Murfreesboro-Franklin MSA, Rents | |||
| MoM | YoY | Since 2020 | |
| Single-family | 0.2% | 2.4% | 42.2% |
| Multifamily | 0.3% | 0.6% | 19.2% |
| Dallas-Fort Worth-Arlington MSA, Rents | |||
| MoM | YoY | Since 2020 | |
| Single-family | 0.3% | 2.2% | 39.0% |
| Multifamily | 0.1% | 0.5% | 17.6% |
| Las Vegas-Henderson-North Las Vegas MSA, Rents | |||
| MoM | YoY | Since 2020 | |
| Single-family | 0.1% | 2.0% | 41.1% |
| Multifamily | 0.1% | -0.1% | 30.7% |
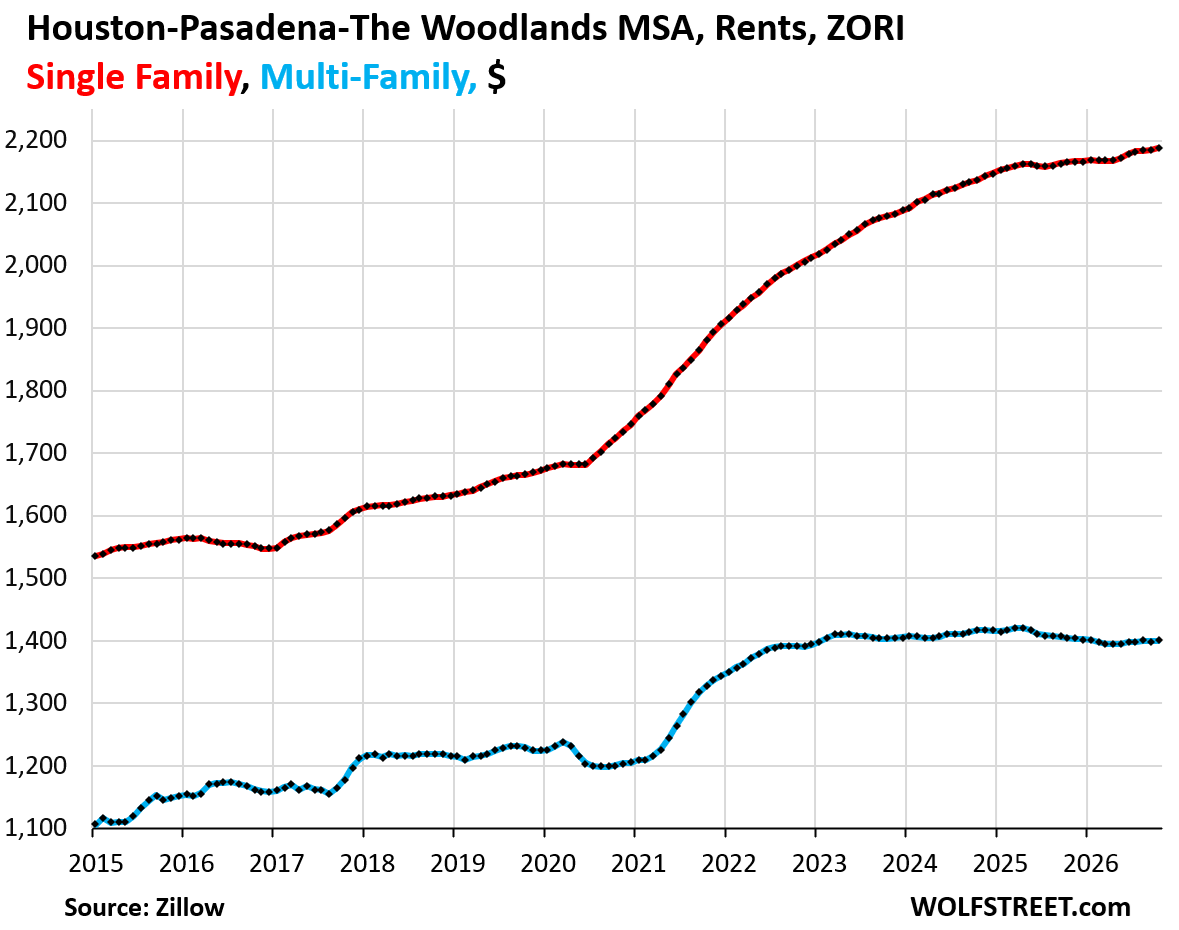
| Houston-Pasadena-The Woodlands MSA, Rents | |||
| MoM | YoY | Since 2020 | |
| Single-family | 0.1% | 1.0% | 30.5% |
| Multifamily | 0.0% | -0.3% | 14.2% |
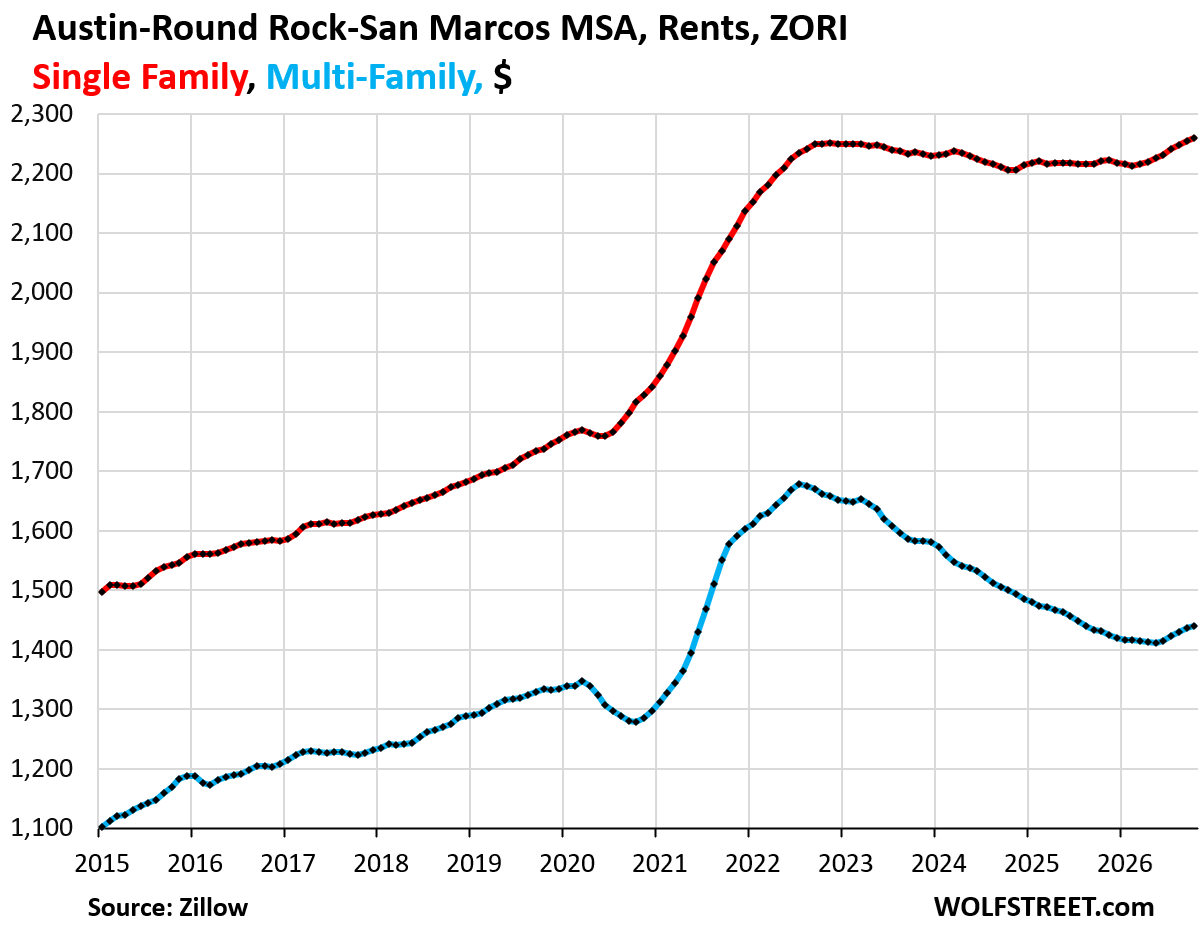
| Austin-Round Rock-San Marcos MSA, Rents | |||
| MoM | YoY | Since 2020 | |
| Single-family | 0.2% | 1.8% | 28.3% |
| Multifamily | 0.3% | 0.6% | 7.6% |
Multifamily rents dropped by 16% from the peak in mid-2022 through early 2026, amid an onslaught of supply. But they’ve started to re-accelerate again.
Single-family rents eased only faintly between 2022 and early 2026, and have also started to re-accelerate again.
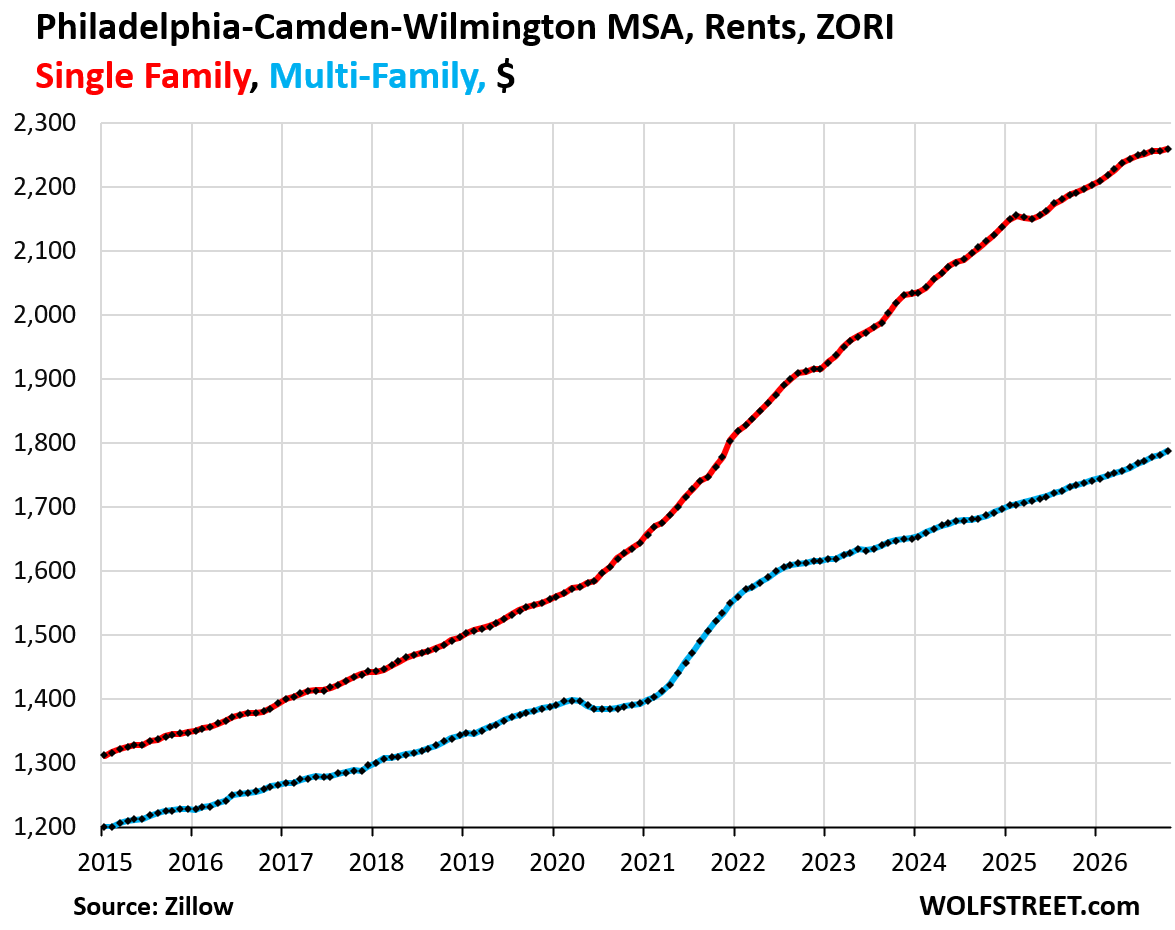
| Philadelphia-Camden-Wilmington MSA, Rents | |||
| MoM | YoY | Since 2020 | |
| Single-family | 0.1% | 3.1% | 44.8% |
| Multifamily | 0.3% | 3.1% | 28.6% |
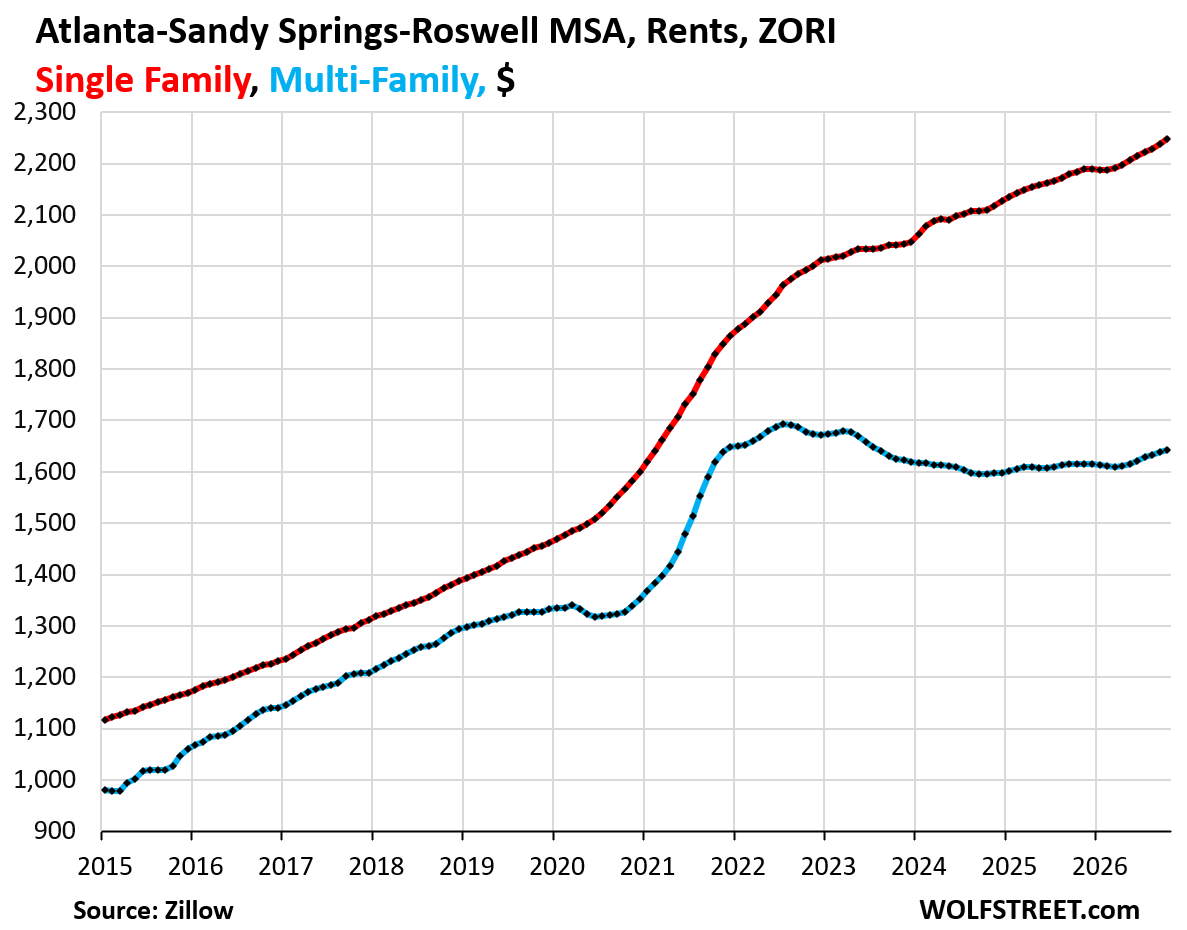
| Atlanta-Sandy Springs-Roswell MSA, Rents | |||
| MoM | YoY | Since 2020 | |
| Single-family | 0.4% | 2.9% | 53.1% |
| Multifamily | 0.3% | 1.7% | 23.1% |
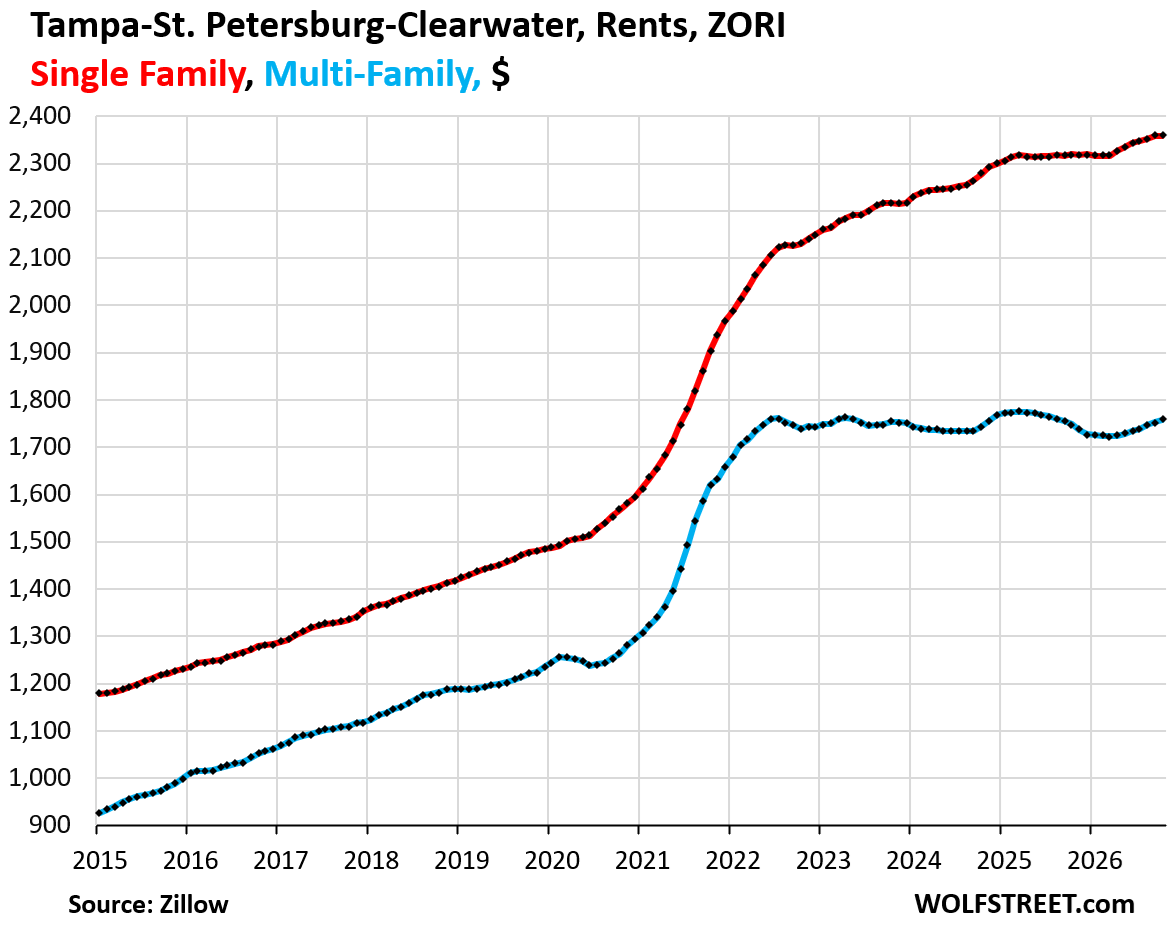
| Tampa-St. Petersburg-Clearwater MSA, Rents | |||
| MoM | YoY | Since 2020 | |
| Single-family | 0.2% | 2.4% | 42.2% |
| Multifamily | 0.3% | 0.6% | 19.2% |
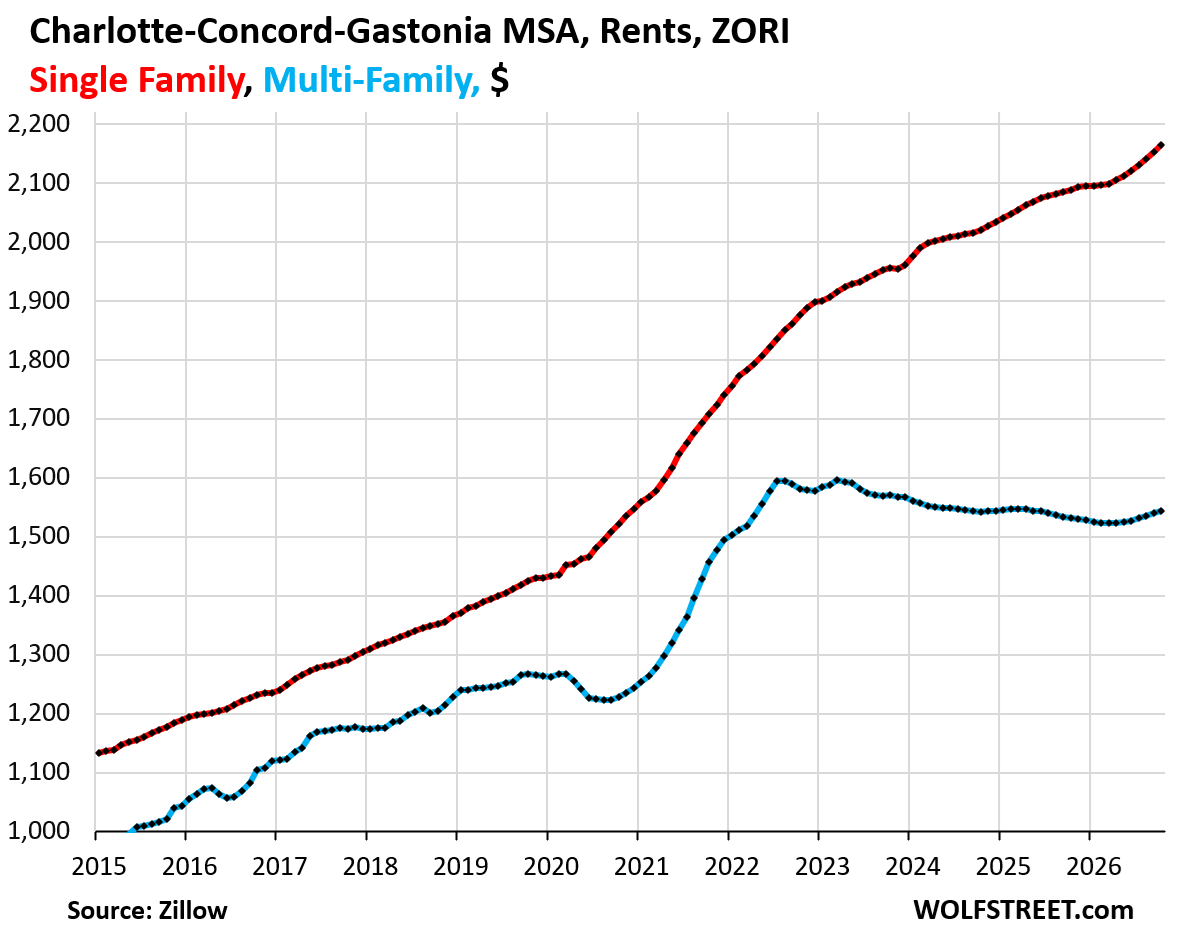
| Charlotte-Concord-Gastonia MSA, Rents | |||
| MoM | YoY | Since 2020 | |
| Single-family | 0.5% | 3.7% | 50.9% |
| Multifamily | 0.2% | 0.8% | 22.4% |
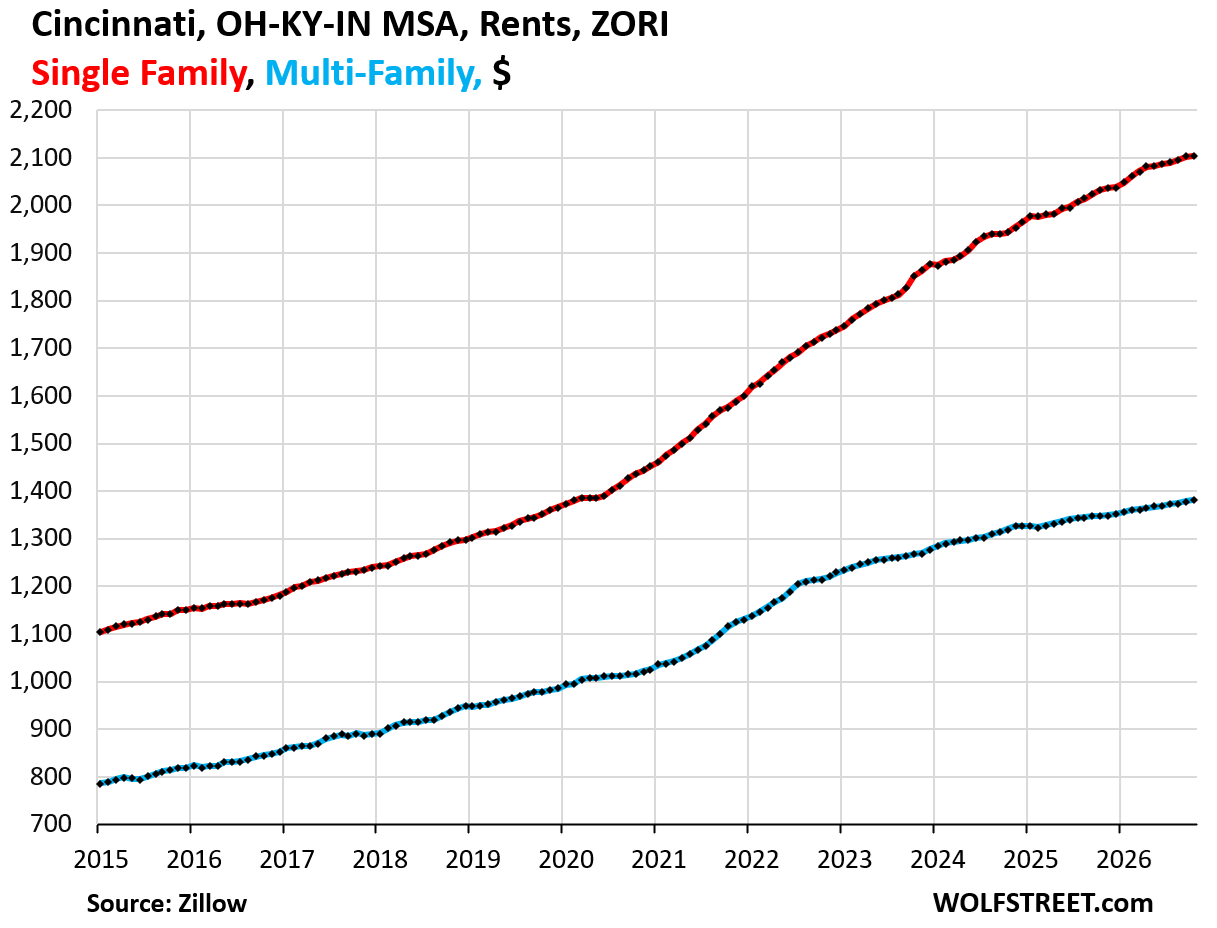
| Cincinnati, OH-KY-IN MSA, Rents | |||
| MoM | YoY | Since 2020 | |
| Single-family | 0.1% | 3.6% | 53.2% |
| Multifamily | 0.2% | 2.6% | 39.1% |
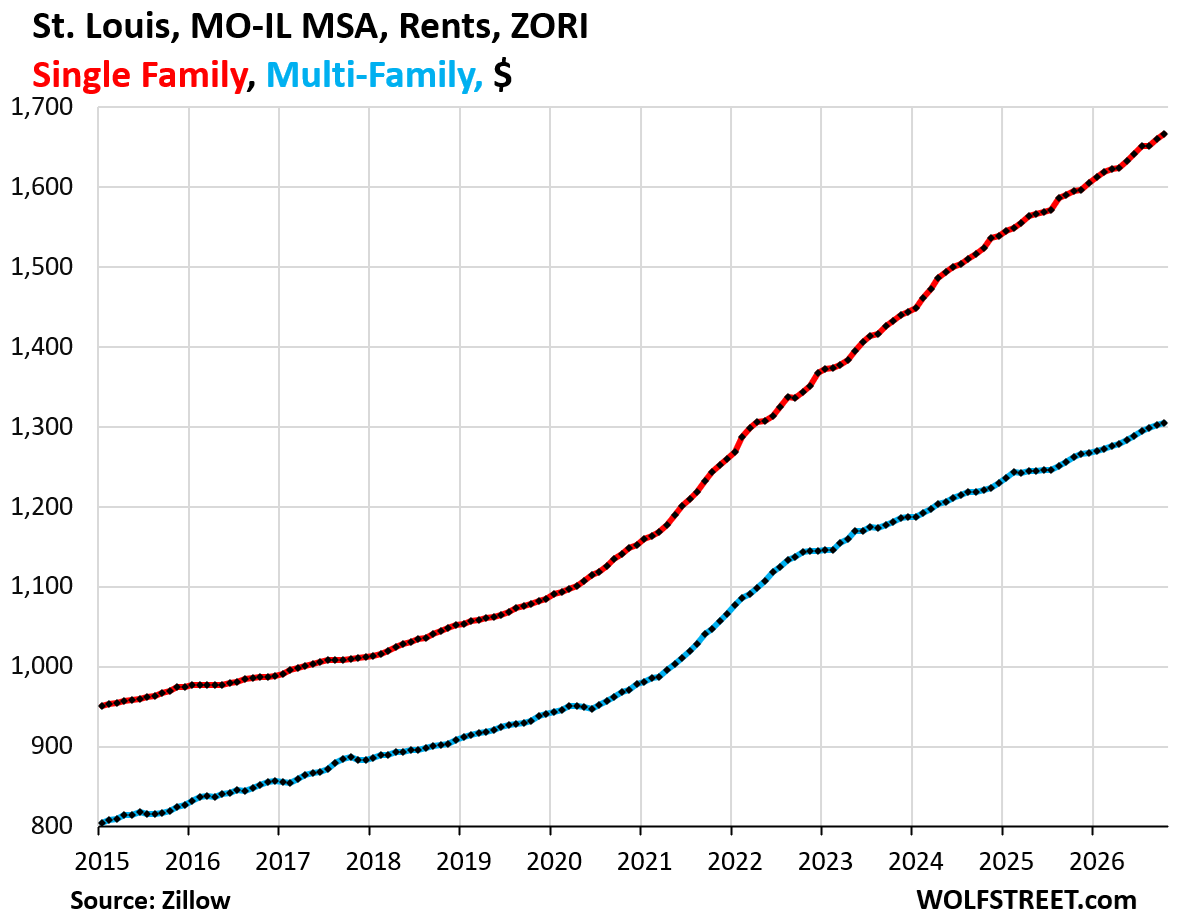
| St. Louis, MO-IL MSA, Rents | |||
| MoM | YoY | Since 2020 | |
| Single-family | 0.4% | 4.5% | 52.8% |
| Multifamily | 0.2% | 3.4% | 38.4% |
Turmoil in multifamily land.
Multifamily is funded by about $2.3 trillion in commercial real estate (CRE) loans. The US government, via Fannie Mae and Freddie Mac, guarantees about half of that. The rest is held around the globe by banks, insurance companies, real estate funds, alternative asset managers, holders of Commercial Mortgage-Backed Securities (CMBS) and Collateralized Loan Obligations (CLOs).
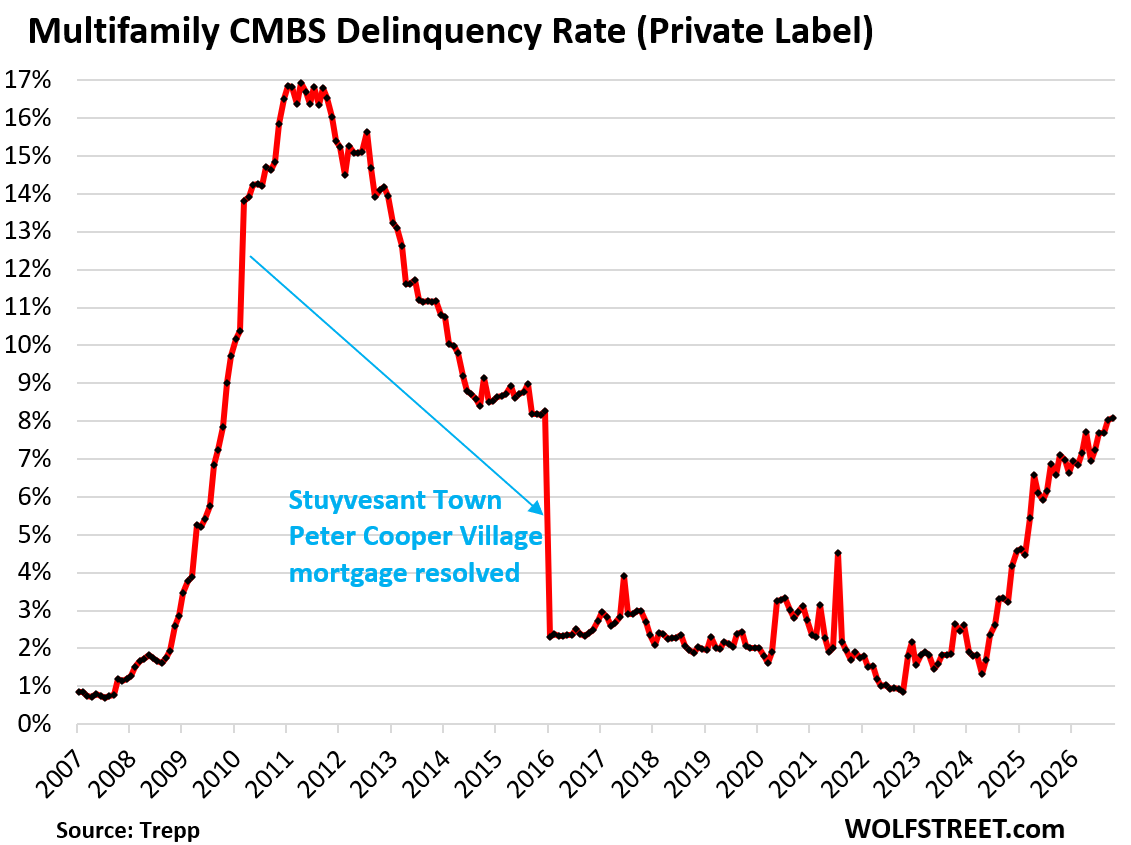
All of them have gotten hit by the multifamily mortgage meltdown. The current interest rates make it very difficult or impossible to refinance maturing balloon payments, or even make interest payments on variable-rate loans pegged to SOFR, which jumped when the Fed started hiking its policy rates in 2022. A lot of this debt, taken on when interest rates were ultra-low, doesn’t pencil out at today’s interest rates and rents. Big multifamily defaults have ricocheted across the US, and the multifamily CMBS delinquency rate hit 8.1% in October.
Enjoy reading WOLF STREET and want to support it? You can donate. I appreciate it immensely. Click on the mug to find out how: