
Americans are buying fewer vehicles than decades ago, but more expensive vehicles, as automakers keep going upscale.
By Wolf Richter for WOLF STREET.
The overall 60-plus-day delinquency rate for auto loans and leases, at 1.50% in September, was down by 7 basis points year-over-year, the fifth month in a row of year-over-year declines, according to Equifax (red in the chart below). The available monthly Equifax data only goes back to 2020, the free-money era when delinquency rates dropped to ultra-low levels. The increase since then is from those artificially low free-money levels. We lack the comparison to the pre-pandemic normal years.
The 60-day-plus subprime delinquency rate, at 6.27% was down by 19 basis points year-over year, the third month of year-over-year declines, after hitting record levels in 2025 and in early 2026, according to Fitch, which rates the subprime auto-loan Asset-Backed Securities (ABS) that these loans have been packaged into (gold line in the chart). The spike in delinquencies occurred when several specialized subprime dealer-lenders imploded – including Tricolor amid a pile of fraud allegations – and many of their customers stopped making payments.
The 60-day “Prime” delinquency rate at 0.49%, was up 2 basis points year-over-year, according to Fitch, which tracks prime auto loans that were securitized into ABS (blue in the chart). The delinquency rates have normalized after the near-zero levels during the free money era.
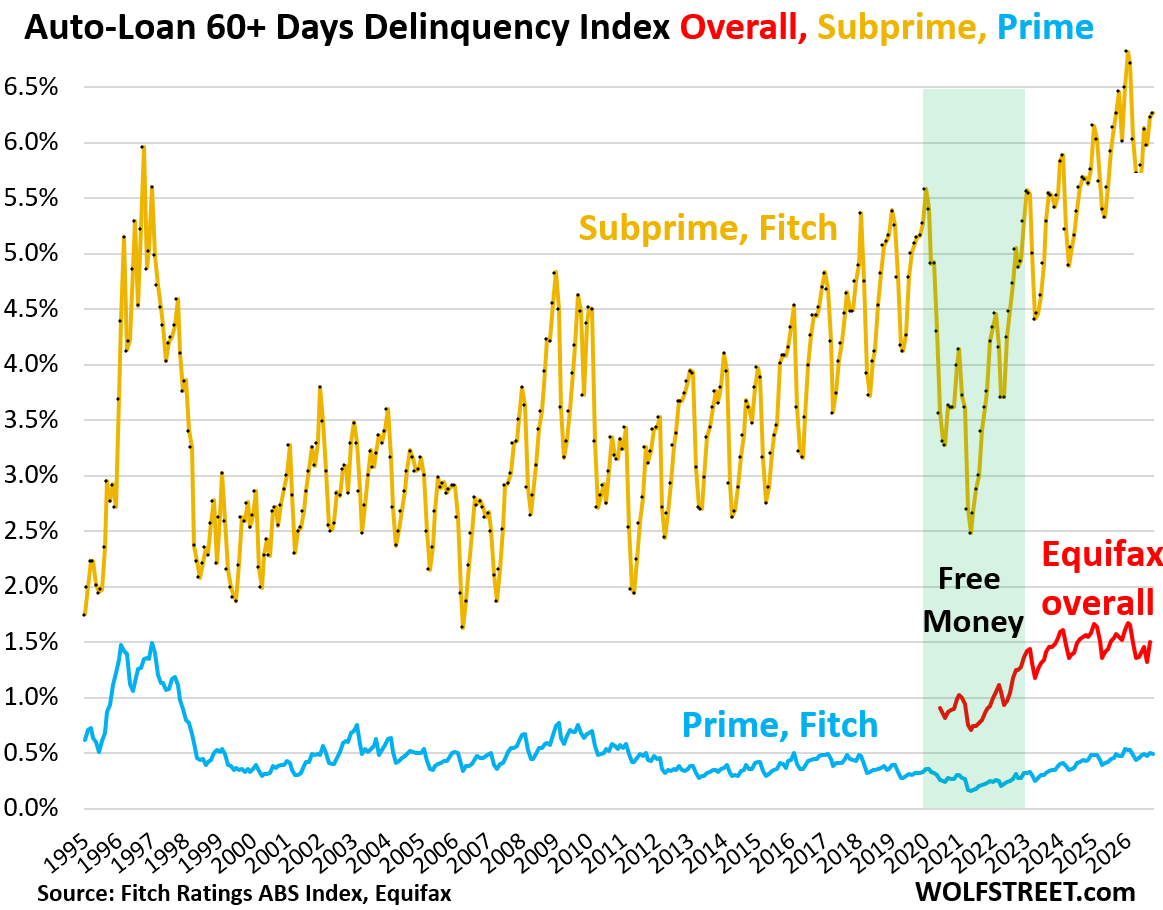
Delinquency rates of auto loans are reliably seasonal, with highs in January or February, and lows in April at the end of tax refund-season. Tax refunds are closely watched by the auto industry because they make great down-payments, and big tax refund seasons boost sales, prices, and gross profits. Tax refunds also allow borrowers to catch up with their payments they’d fallen behind on over the holidays.
Subprime means “bad credit,” not “low income.” Borrowers get a subprime credit score if they have a history of not paying their bills and obligations. The young dentist that got into it over his head is a classic example of high-income subprime. They’ll get it worked out. Subprime is not permanent. People’s credit scores fall into it and rise out of it.
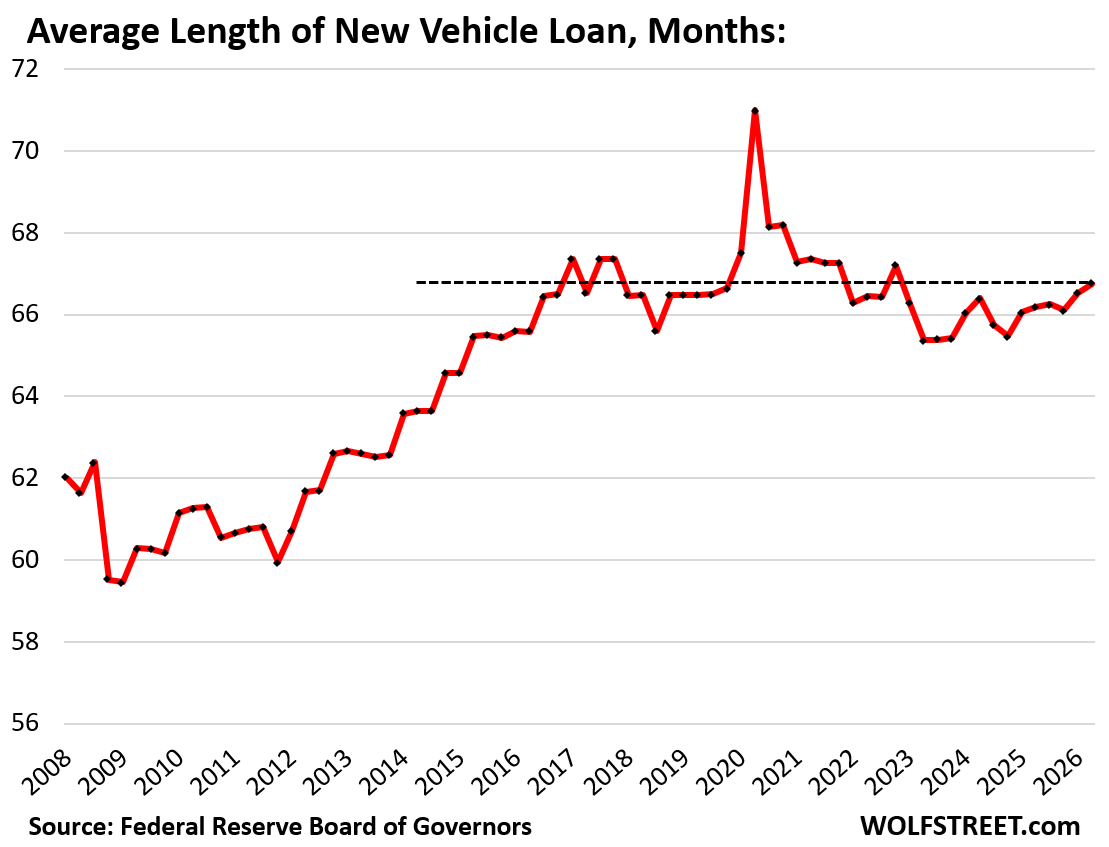
The average length of new vehicle loans ticked up to 66.7 months in the second quarter, a level it first reached in 2017, according to Federal Reserve data.
The spike in Q2 2020 was likely a distortion stemming from the collapse of new vehicle sales during the lockdowns. Without that one-quarter spike, the average length of the new vehicle loans has been in the same range for a decade and is now lower than it was in 2017.
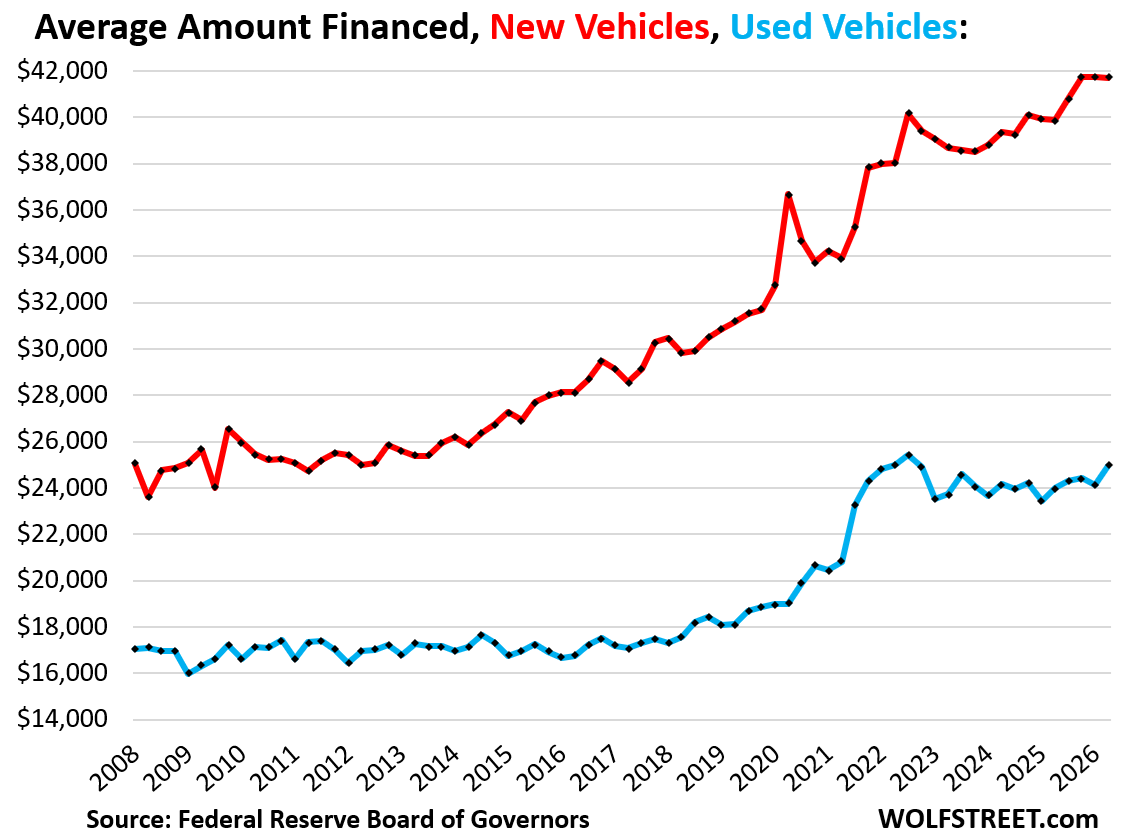
The average amount financed for new-vehicle loans has been roughly unchanged for three consecutive quarters, at just under $42,000, according to data from the Federal Reserve (red line in the chart below).
The average amount financed rises with the price of vehicles, and with the mix of vehicles sold that has shifted upscale. Automakers have been shifting upscale for years, selling ever fancier, more powerful, and bigger vehicles, for ever more dollars, making the $100,000 pickups practically a common sight because enough Americans love them and buy them.

American automakers, in their infinite wisdom, stopped selling entry-level sedans years ago, though foreign brands still dabble in them, but even their entry-level vehicles have gone upscale.
All this is visible in the average amount financed for new vehicles (red line).
For used vehicles, the average amount financed rose to nearly $25,000, but still a hair below the peak in 2022.
The surge of the amount financed from the beginning of 2020 through the peak in Q3 2022 was caused by the 50% price explosion during the pandemic.
Used-vehicle prices have declined from their peak in 2022, and the average amount financed also backed off (blue line).
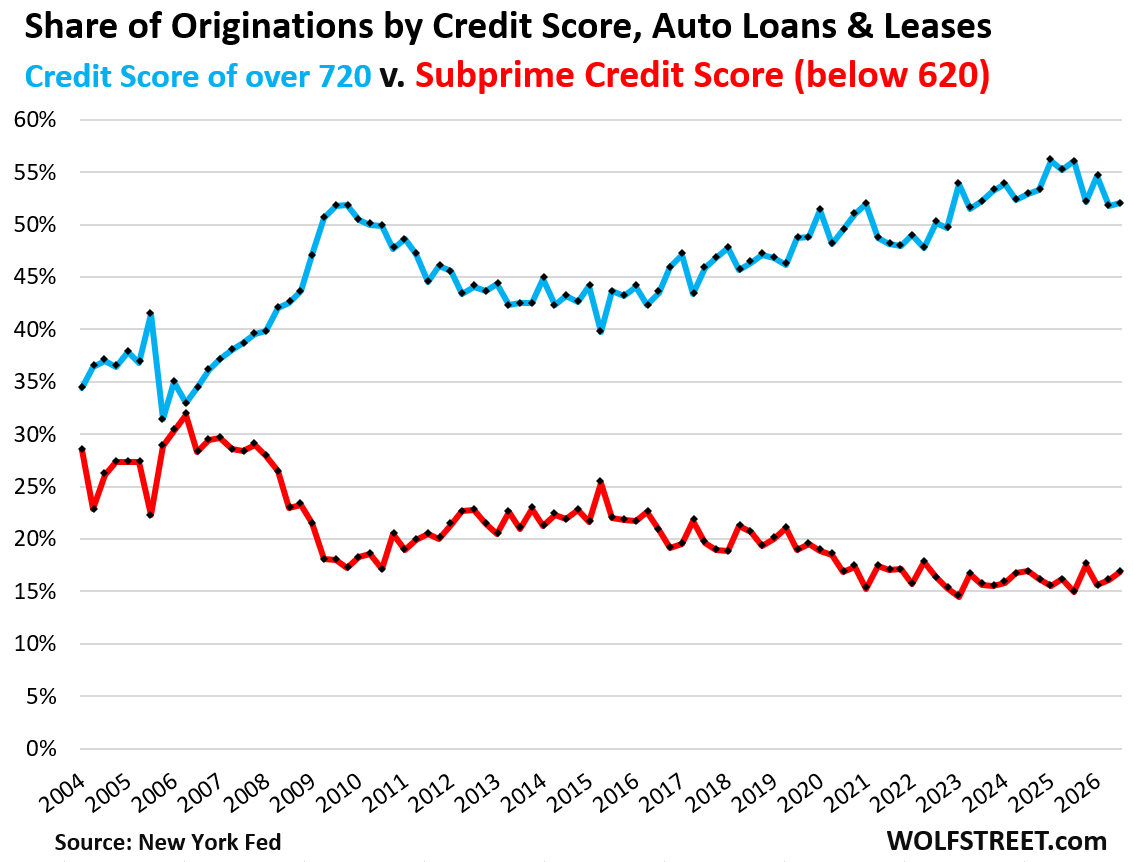
Auto loan originations by credit score: Over half (52%) of the auto loans and leases originated in Q3 were made to borrowers with a prime credit score of 720 and higher, according to the New York Fed’s Household Debt and Credit report, based on Equifax data. The record in the data was set last year at 56.1% (blue in the chart below).
The share of subprime originations has hovered in recent years around a relatively low range of 15-17%, down from the prepandemic range of 20-21%. And it was higher before the Financial Crisis.
Share of origination by credit score in Q3:
- 760 and over: 40.6%
- 720-759: 11.5%
- 660-710: 19.0%
- 620-659: 12.1%
- Below 620: 16.8%
Total outstanding loans and leases for new and used vehicles rose by $23 billion in Q3 from Q2, and by $79 billion (+4.8%) year-over-year, to $1.73 trillion, according to the New York Fed’s report on consumer credit, based on Equifax data.
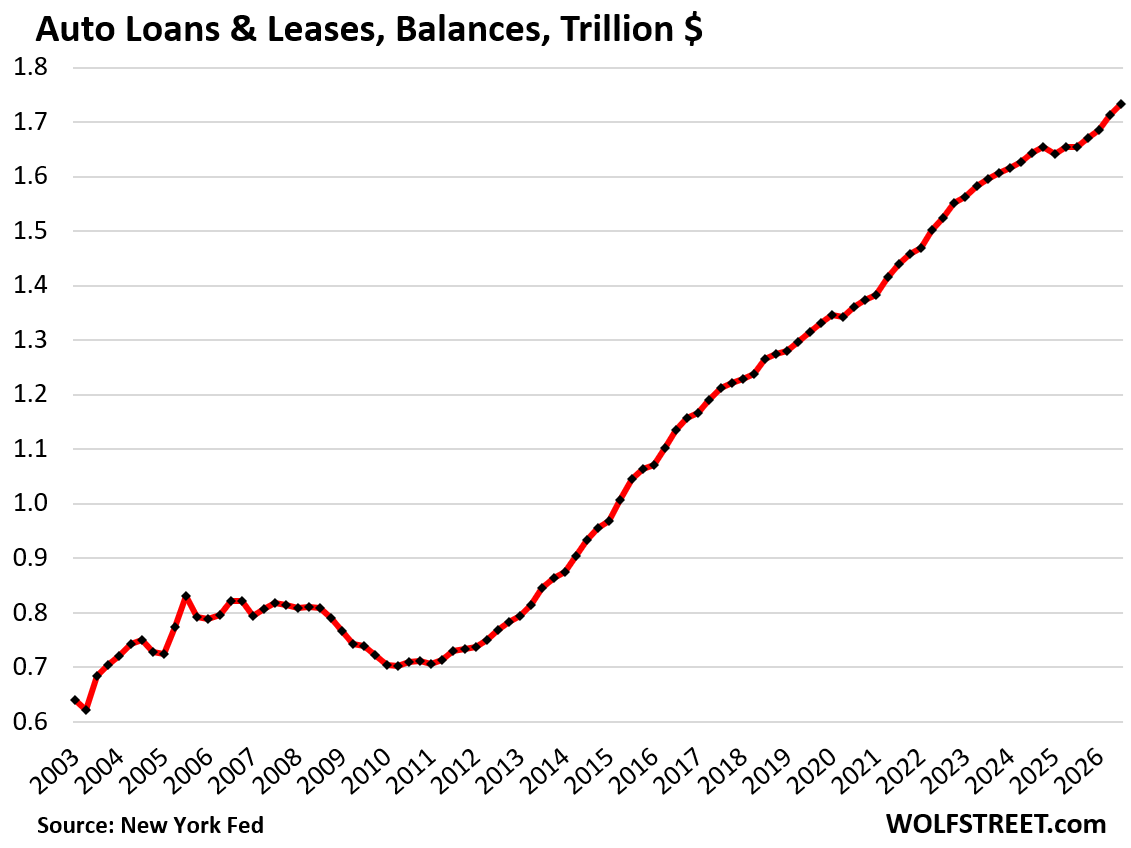
Auto loan balances have risen over the years with vehicle prices.
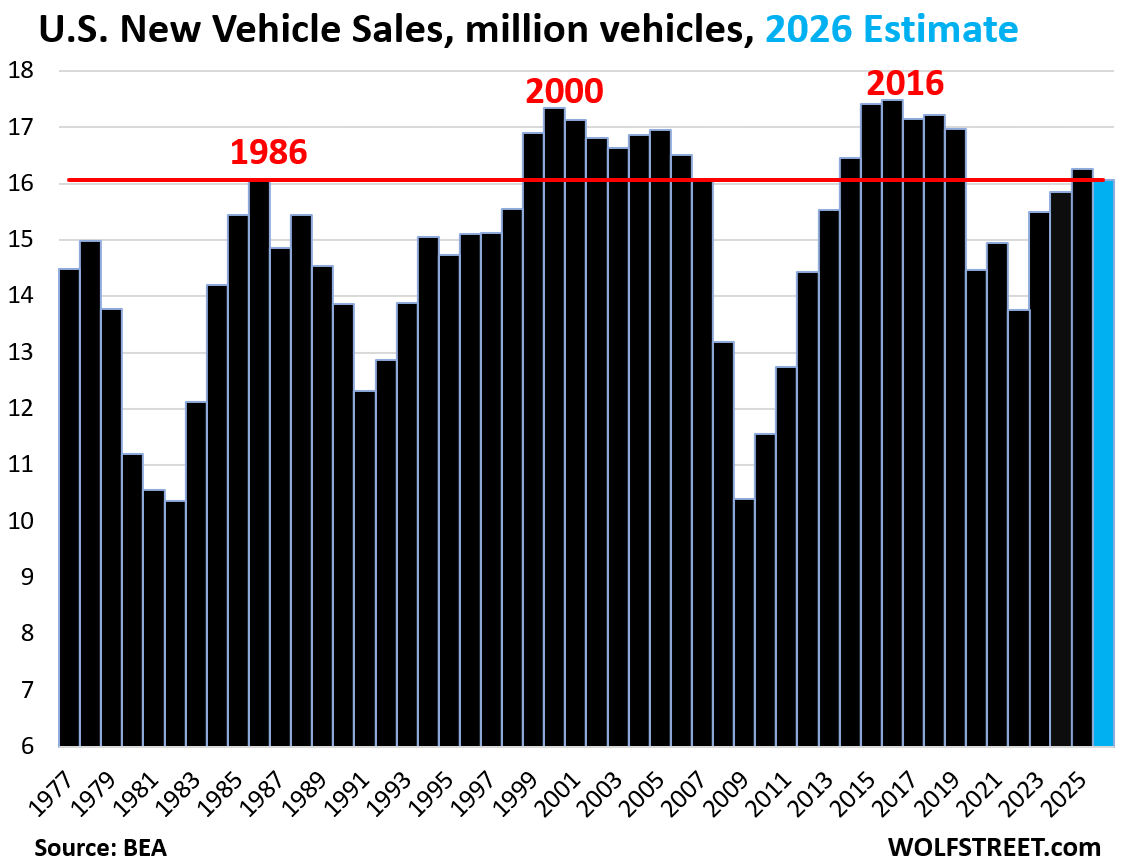
But two factors have not contributed to rising loan balances in recent years: Average length of new vehicle loans (in Q3, it was shorter than in 2017) and the number of vehicles sold.
The number of new vehicles sold in the full year 2026 will likely end up just below 2025, and back where they’d first been in 1986 (WOLF STREET estimates based on sales through October).
Americans are buying fewer new vehicles than they used to; but they’re buying much more expensive vehicles, and they’re driving them longer.
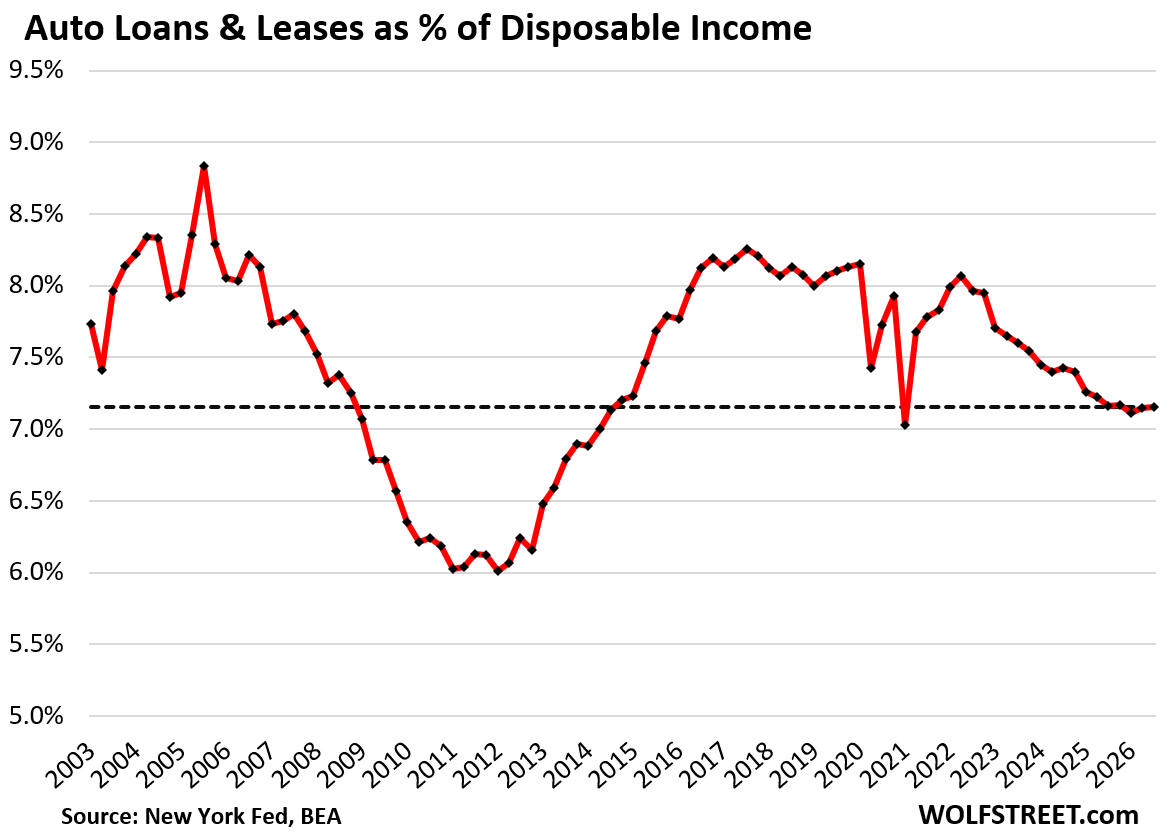
The aggregate burden and risk of default of those auto loans can be evaluated via a debt-to-income ratio. For household income, we use “disposable income” (Bureau of Economic Analysis).
Disposable income consists of after-tax wages, plus income from interest, dividends, rentals, farm income, small business income, transfer payments from the government, etc.
But it excludes capital gains, which is where the wealthy make most of their money. Excluded are thereby income from stock-based compensation plans and capital gains where billionaires make their billions.
Disposable income has grown over time because the number of households has grown, and the income per household has grown, and so total household income has grown.
Over the past three quarters, disposable income has grown about as fast as auto loans, and the debt-to-income ratio has remained at about 7.2%, in the middle of the range of the past two decades.
And in case you missed them:
Enjoy reading WOLF STREET and want to support it? You can donate. I appreciate it immensely. Click on the mug to find out how: