
Supply spiked to the highest level in 12 years. So much for “hitting bottom.”
By Wolf Richter for WOLF STREET.
Pending sales of existing homes in October plunged by 4.7% from the already record-low levels in September, seasonally adjusted, and by 16.7% year-over-year, and by 41% from September 2019, to a new record low in the data, according to the National Association of Realtors today.
The recent multi-month cliff dive was worst in the South and in the West, the two biggest housing-market regions in the US, and began in June 2026. Compared to October 2021, pending sales have collapsed by 49%; compared to October 2019 by 41%.
This metric tracks sales contracts that were signed in October but that haven’t closed yet and could still get canceled. The rate of cancellations has been high. Pending home sales are a forward-looking indicator of closed home sales in future months. So much for “hitting bottom.”
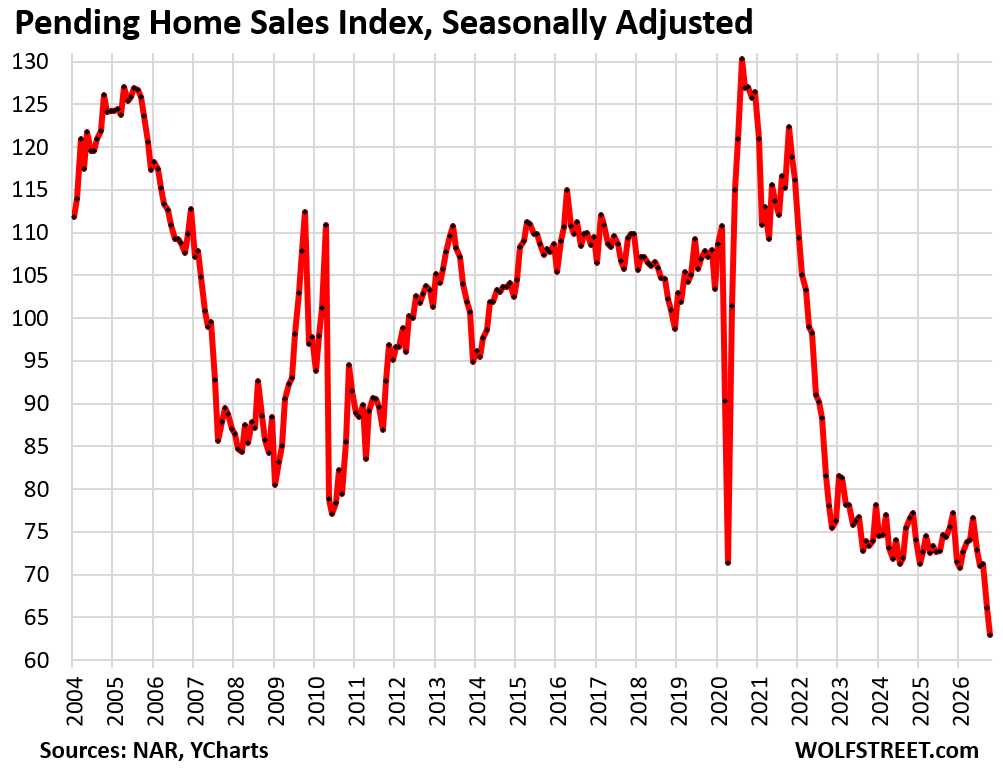
“It is somewhat puzzling that home sales would fall to levels last seen three decades ago, even as the U.S. population has grown by roughly 75 million,” the NAR report said.
No, it’s not puzzling at all; it has been obvious for all to see: Prices are too high after the price explosion from mid-2020 to mid-2022. More and more people understand this. And it has crushed demand, while supply has spiked to the highest in many years.
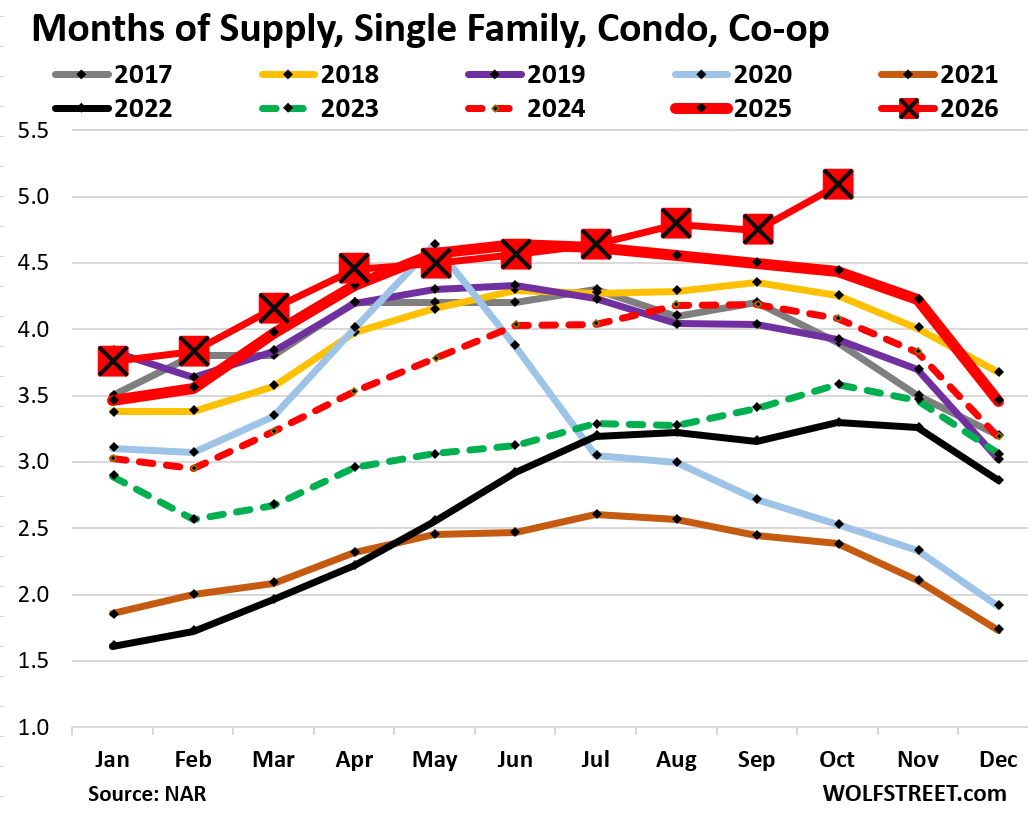
Supply of existing homes has soared to 5.1 months, the highest since 2014, because sales have plunged while inventories have risen, according to separate data from NAR earlier this month.
The reason for the collapse in demand isn’t that “there is nothing to buy,” as some like to say. There are a lot of homes to buy, but prices are too high for where demand is.
“The report helps the real estate ecosystem – including agents, homebuyers and sellers – better understand the housing market by providing data on the level of home sales under contract,” the NAR report said.
Indeed! What they need to understand is that prices are too high, after the price explosion from mid-2020 to mid-2022. Those prices don’t make economic sense.
“Two consecutive months of record-low pending contracts point to very sluggish fourth-quarter home sales closings, and annual existing-home sales could be the lowest since the mid-1990s,” the report said.
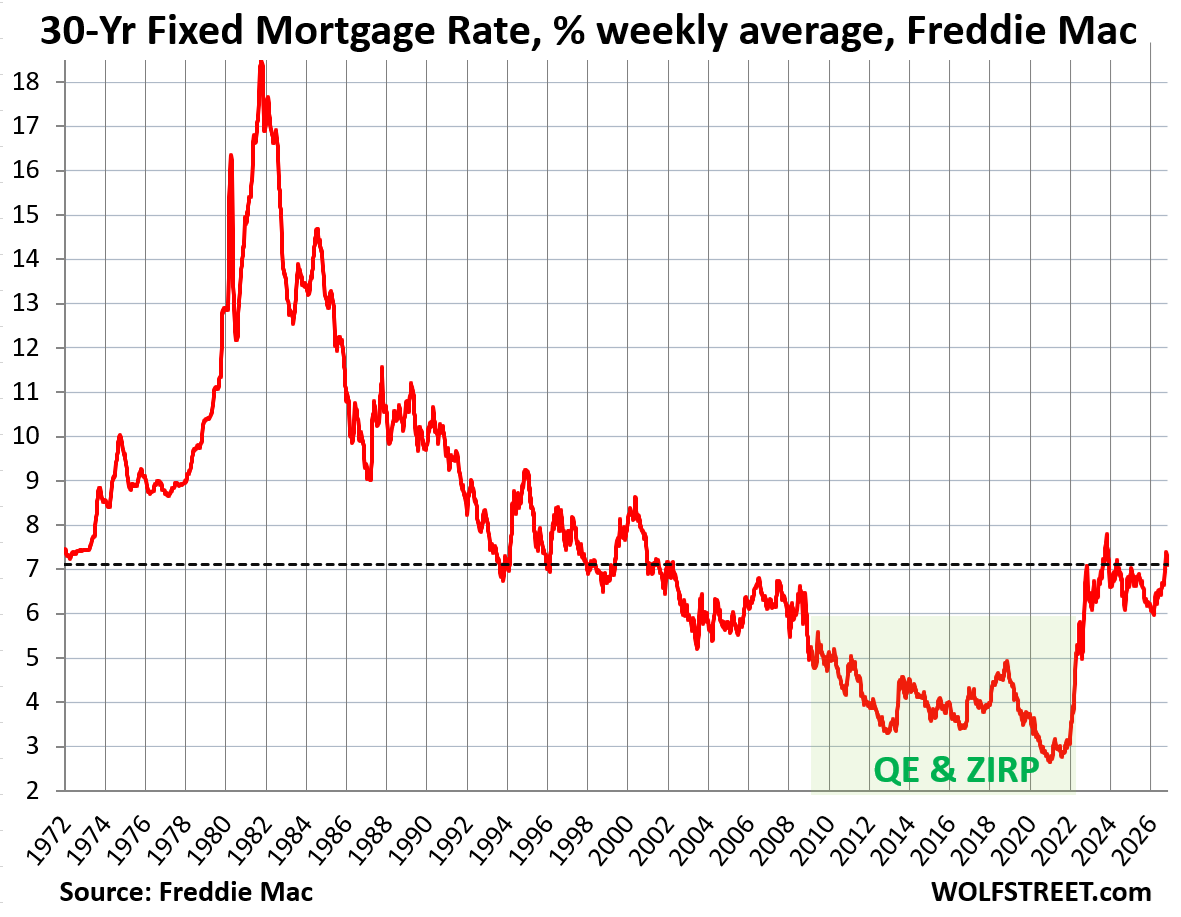
Mortgage rates in October, when these contracts were signed, were in the 7.24% to 7.40% range, according to Freddie Mac.
They’ve been back what is historically the normal range for about four years.
It’s just that there is a generation of buyers and sellers out there who have never seen normal mortgage rates as market-observing adults, and they are waiting for the abnormal Fed-manipulated QE-and-ZIRP-based mortgage rates of 4% or less to return.
Those mortgage rates were the result of the Fed’s financial repression, which started in 2008 and was among the drivers behind the worst inflation in 40 years, and the second wave of that inflation is now here, and higher inflation entails higher yields in the bond market which entail higher mortgage rates.

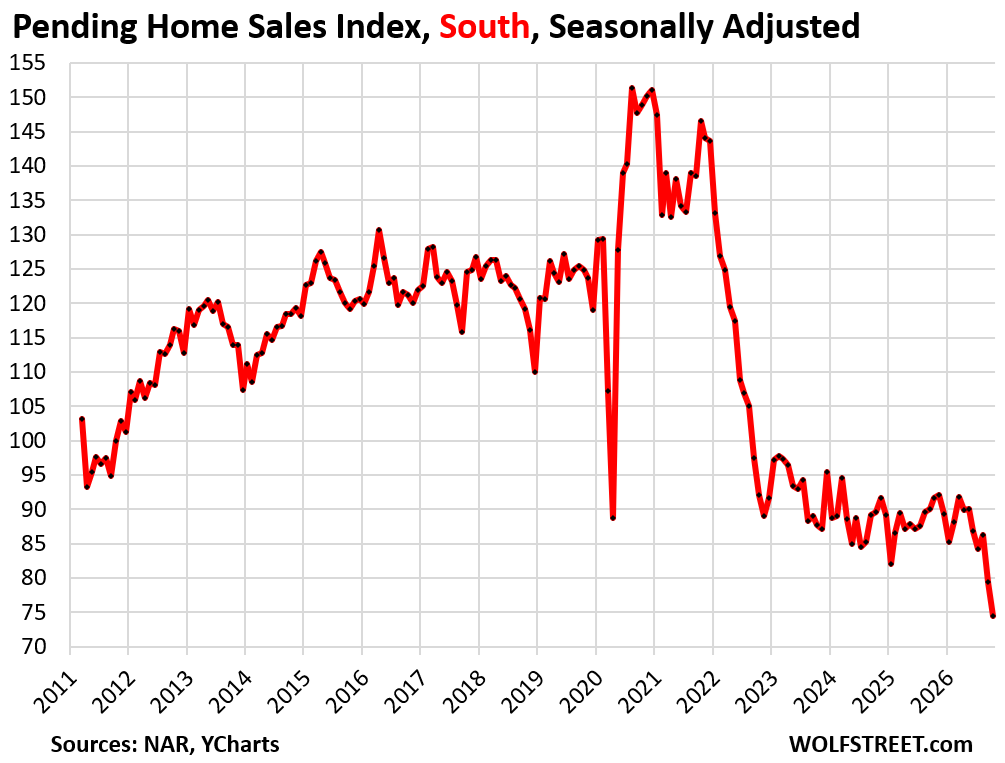
Pending home sales by region.
In the South, pending sales plunged by 6.3% month-to-month in October after the 7.9% plunge in September, seasonally adjusted. The recent cliff-dive started in June.
Compared to Octobers in prior years:
- 2025: -18.7% (year-over-year)
- 2024: -16.9%.
- 2021: -49.2%
- 2019: -40.4%.
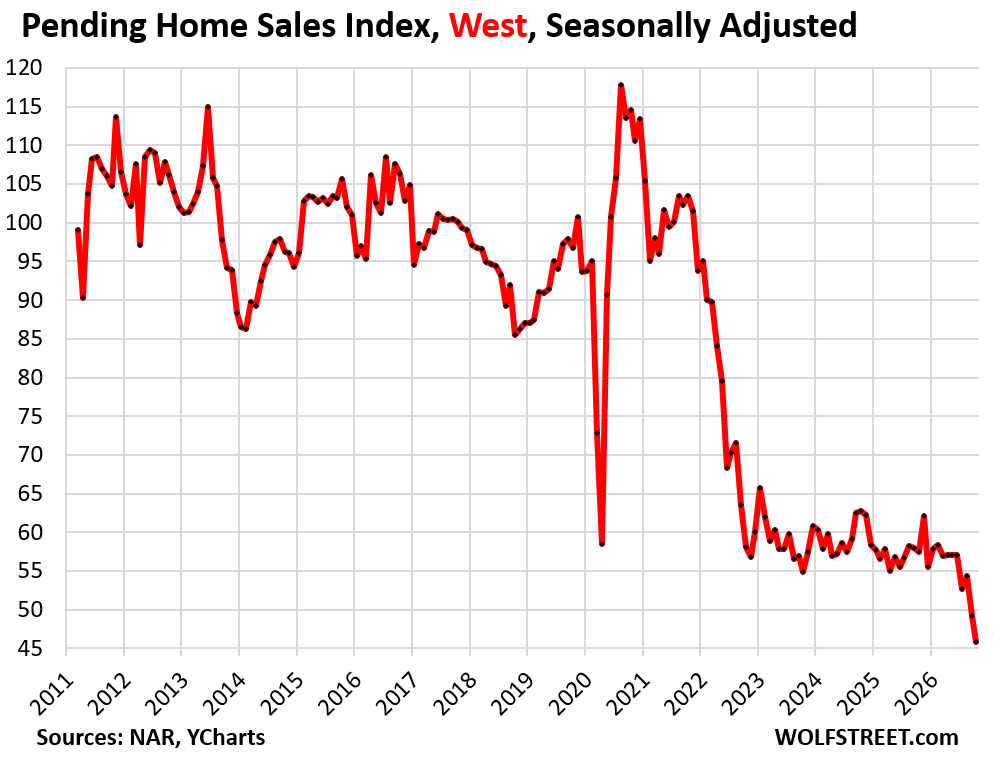
In the West, pending sales plunged by 6.9% month-to-month in October, after the 9.4% plunge in September. The recent cliff-dive started in June.
Compared to October in prior years:
- 2025: -20.3% (year-over-year)
- 2024: -27.0%
- 2021: -55.7%
- 2019: -52.6%.
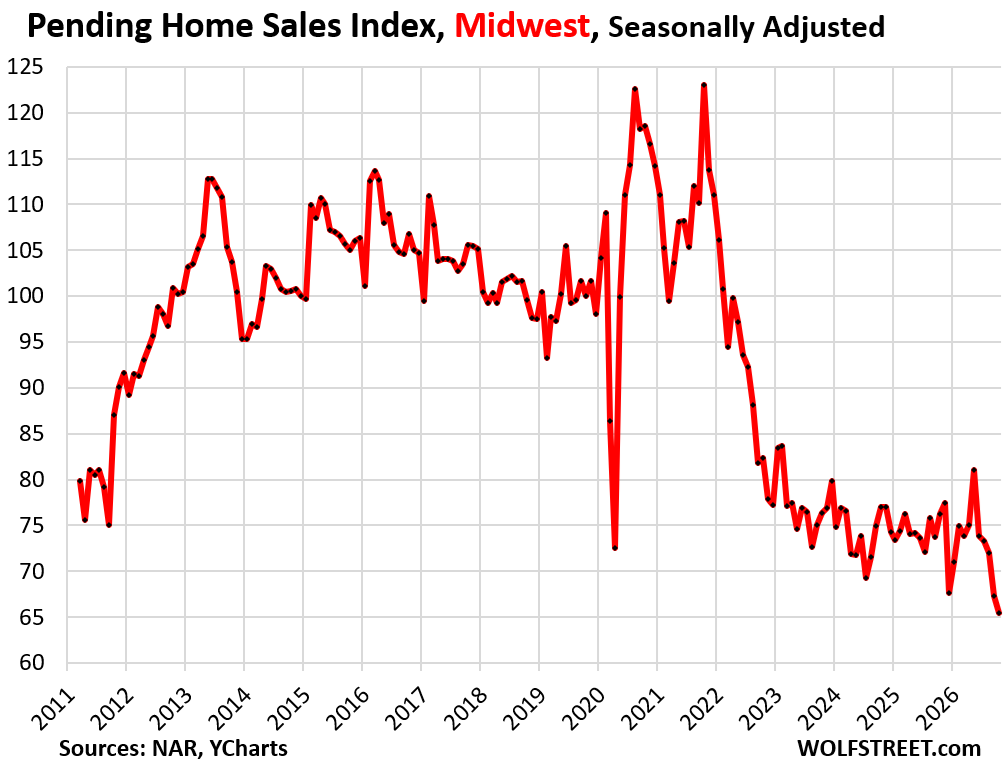
In the Midwest, pending sales dropped by 2.7% in October, after the 6.5% plunge in September.
Compared to October in prior years:
- 2025: -14.0% (year-over-year)
- 2024: -14.9%
- 2021: -46.7%
- 2019: -34.5%.
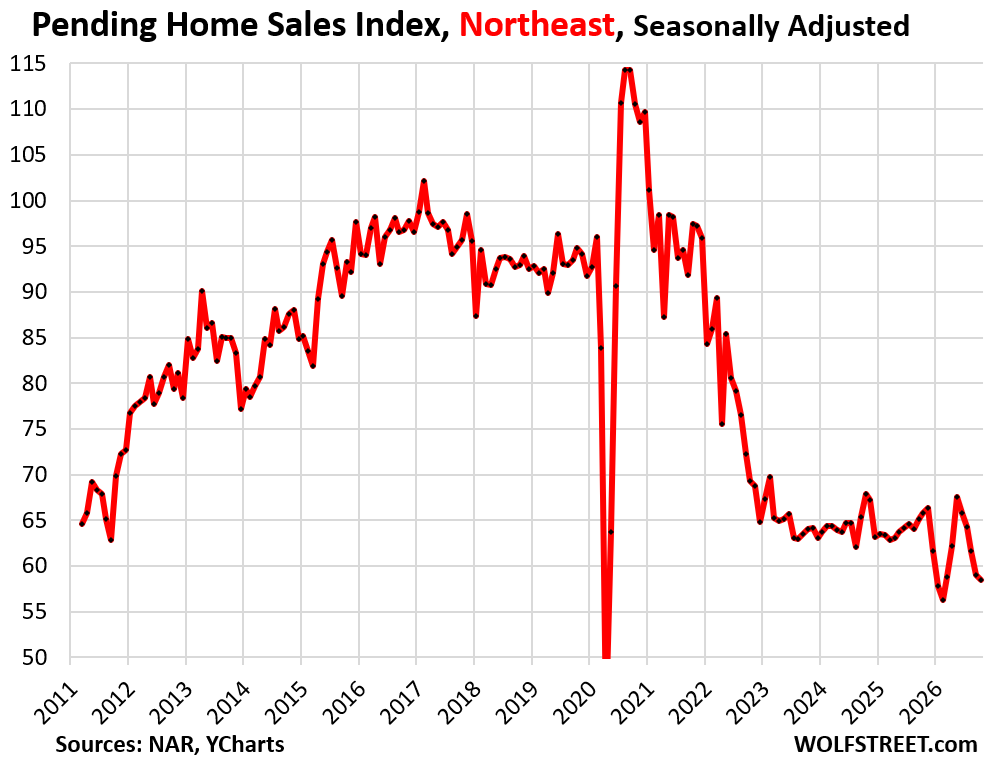
In the Northeast, pending sales declined by 0.8% in October after the 4.2% drop in September, seasonally adjusted.
Compared to October in prior years:
- 2025: -11.1% (year-over-year)
- 2024: -13.8%
- 2021: -39.9%
- 2019: -38.3%.
In case you missed it: Oh Dear, Condo Prices Dropped by 15% to 34% in 40 Bigger Markets Already, and by 8% to 14% in another 28 Markets
Enjoy reading WOLF STREET and want to support it? You can donate. I appreciate it immensely. Click on the mug to find out how: