
Inflation refuses to back into the bottle, especially non-housing services inflation. Prices of food and core goods also jumped. It was ugly all around.
By Wolf Richter for WOLF STREET.
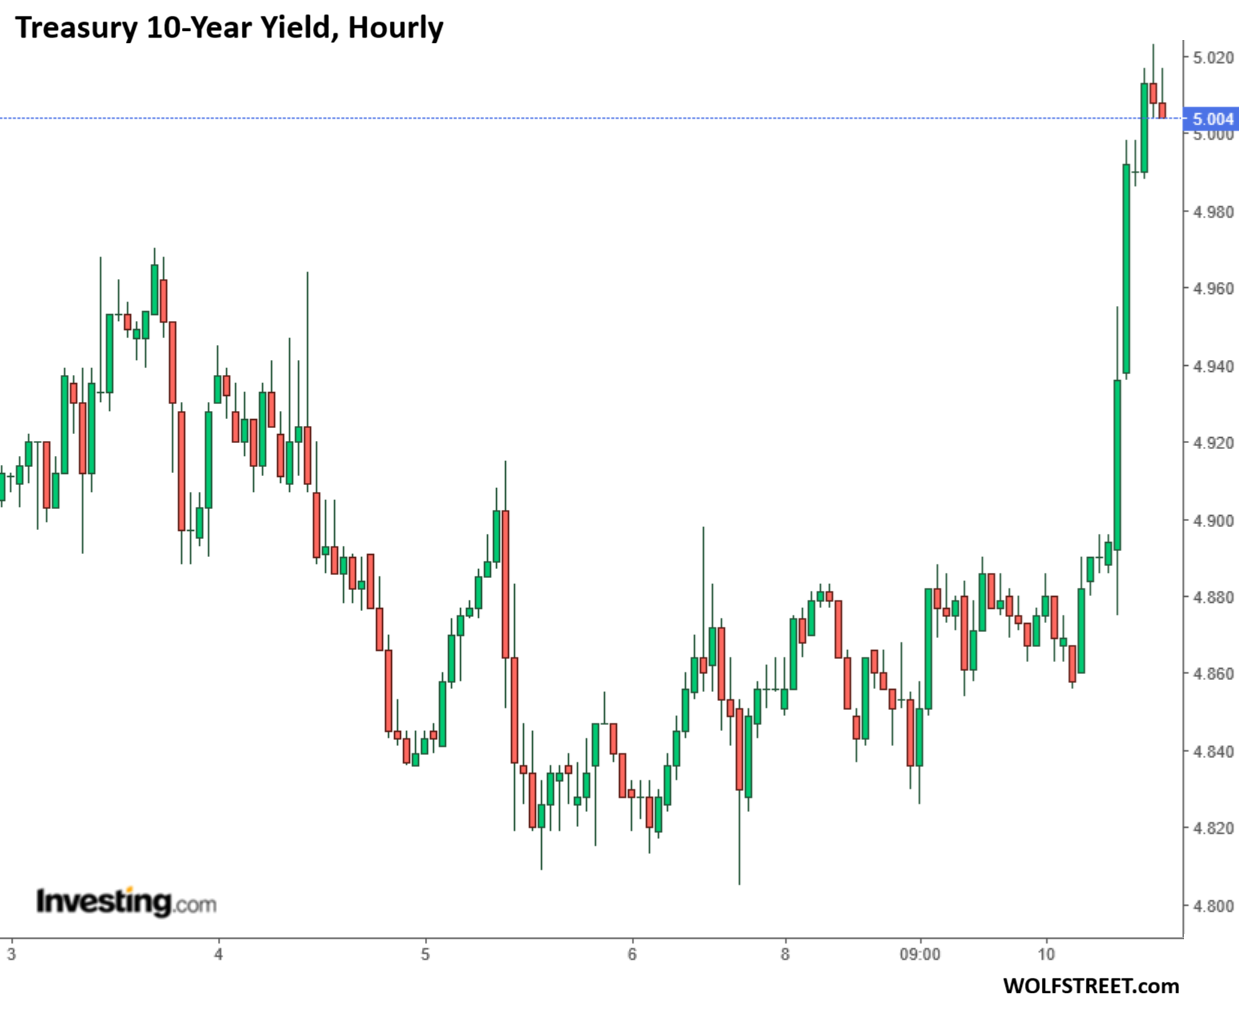
The 10-year Treasury yield spiked by 10 basis points to 5.0% at the moment, upon the release of the hot CPI data this morning which showed that inflation has seeped deeply into the economy, especially non-housing services, but also food, core goods, and still energy. The chart shows the moves in hourly increments.
There were two winkles in today’s CPI release for October:
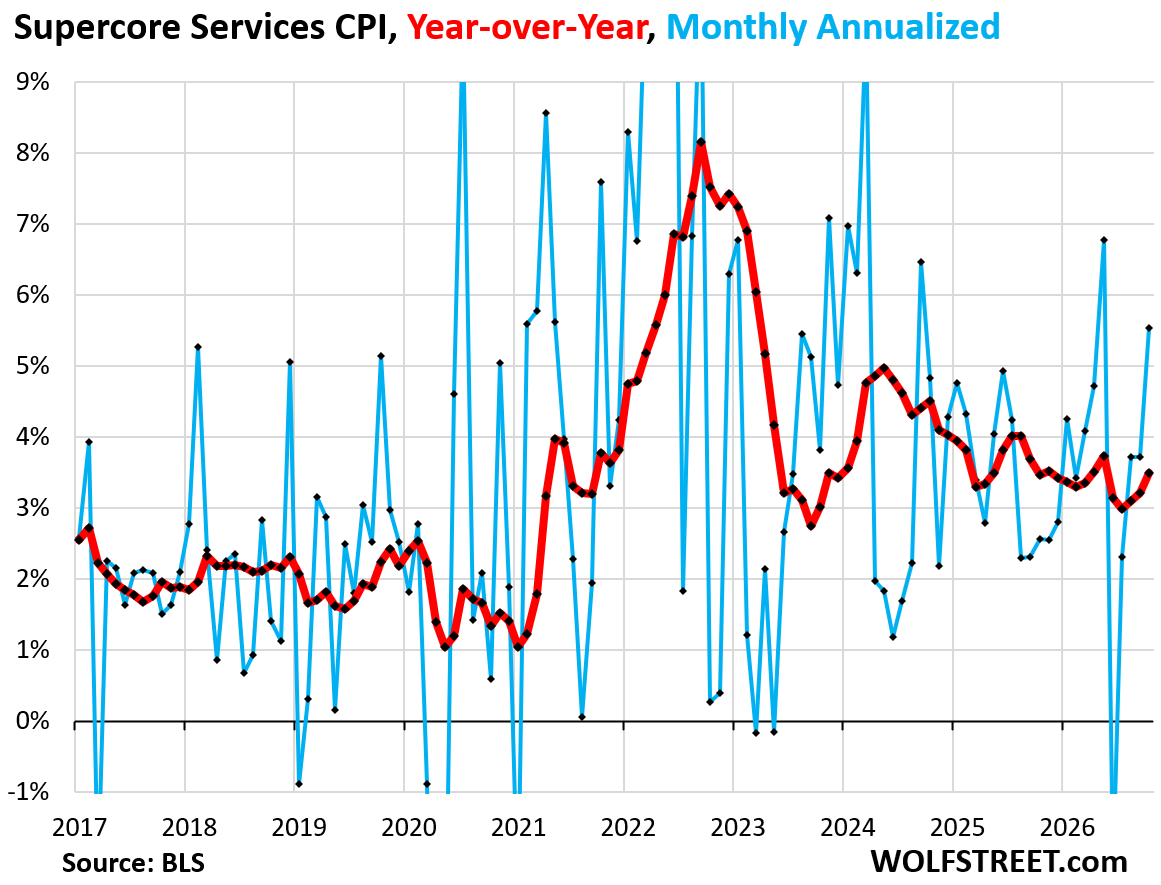
1st wrinkle: Inflation was hot in core services. The month-to-month increase was 0.34% (+4.2% annualized), above 0.32% for the third month in a row. And the driver was non-housing services, which spiked by 0.45% (+5.5% annualized), which shows that services inflation is spreading across the economy.
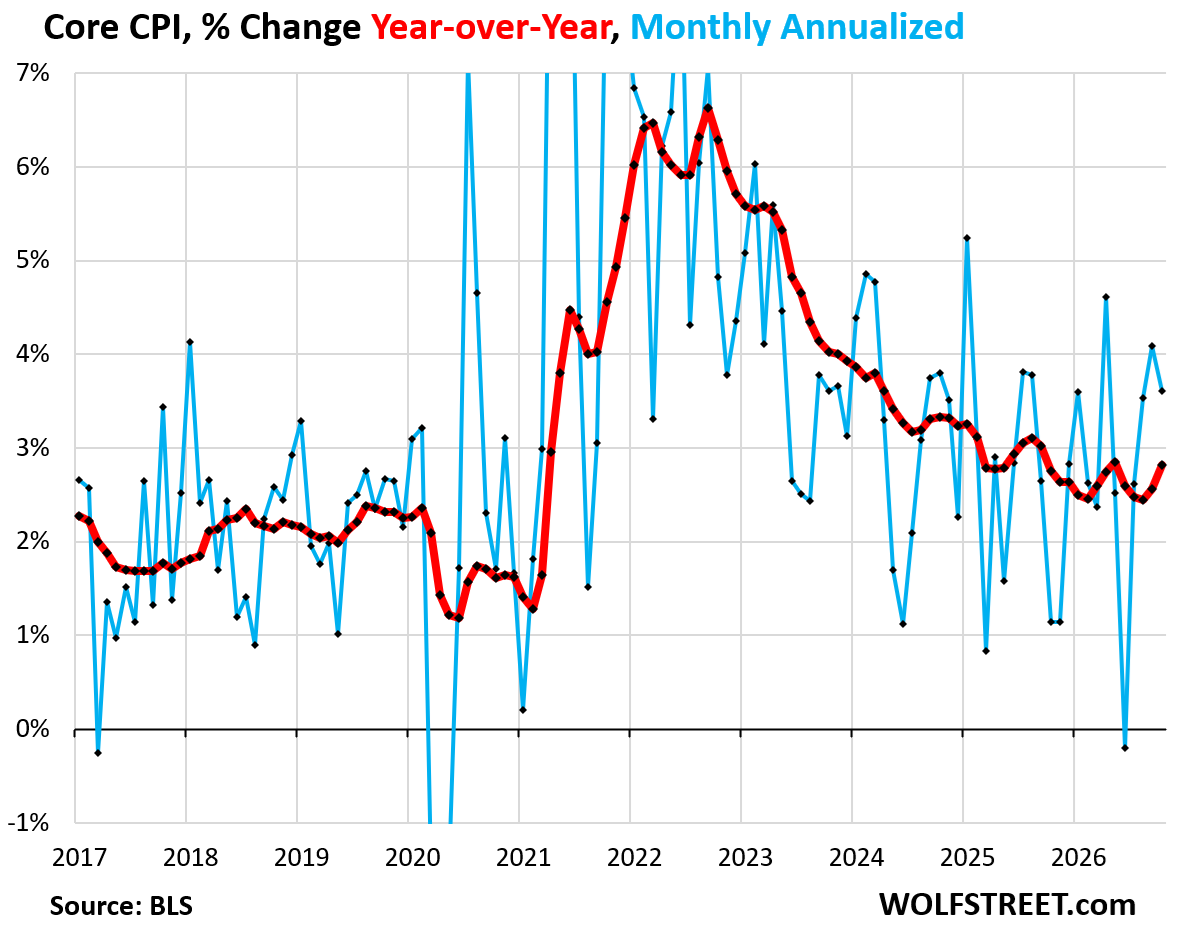
The core CPI, powered by inflation in services, rose by 0.30% (+3.6% annualized, above 3.5% for the third month in a row).
The month-to-month increases were ugly all around:
- All-items CPI: +0.35% (+4.3% annualized)
- Core CPI: +0.30% (+3.6% annualized)
- Core services CPI: +0.34% (+4.2% annualized)
- Super-core services CPI: +0.45% (+5.5%)
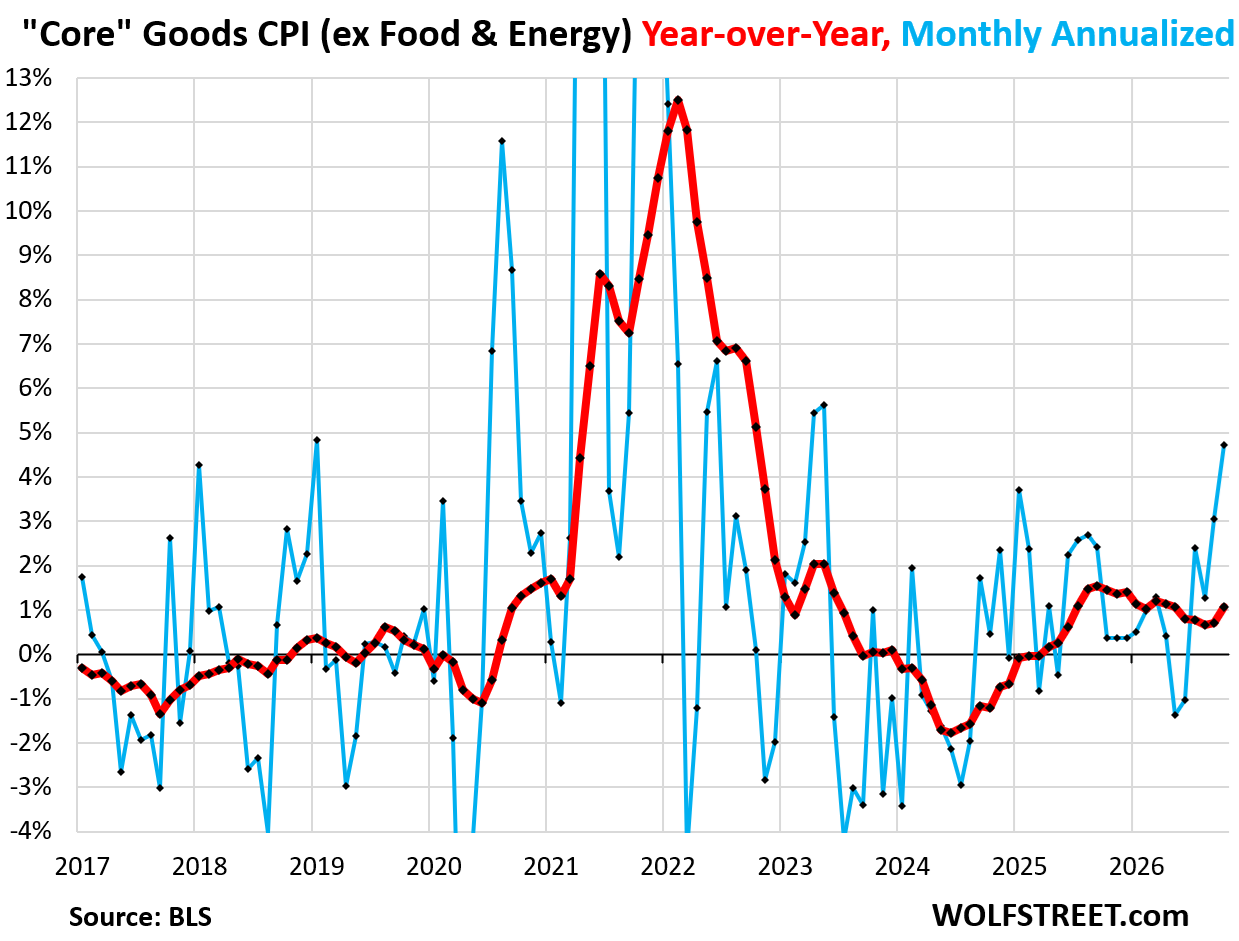
- Core goods CPI: +0.39% (+4.7% annualized)
- Food at home CPI: +0.44% (+5.5% annualized)
- Food away from home CPI: +0.52% (+6.4% annualized)
- Energy CPI: +0.70% (+8.7% annualized)
2nd wrinkle: missing base for the year-over-year calculation. The Bureau of Labor Statistics did not release year-over-year figures because the government shutdown last year caused some pricing data for October 2025 to not be collected, and therefore the BLS does not have the base data to calculate year-over-year changes.
Method of dealing with the missing base. There is a standard method of dealing with that kind of missing data point at the base: The average (mean) of the index values of the month before and after.
So, for example, for the all-items CPI, the index value, not seasonally adjusted, for September 2025 (= 324.80) plus the index value, not seasonally adjusted, for November 2025 (= 324.12) divided by 2. So: (324.80 + 324.12)/2 = 324.46 for October 2025, which forms the base for the year-over-year percentage change. For October 2026, the index value is 337.51. And the year-over-year increase = 4.0%. And that’s hot.
The ugly CPI inflation indices.
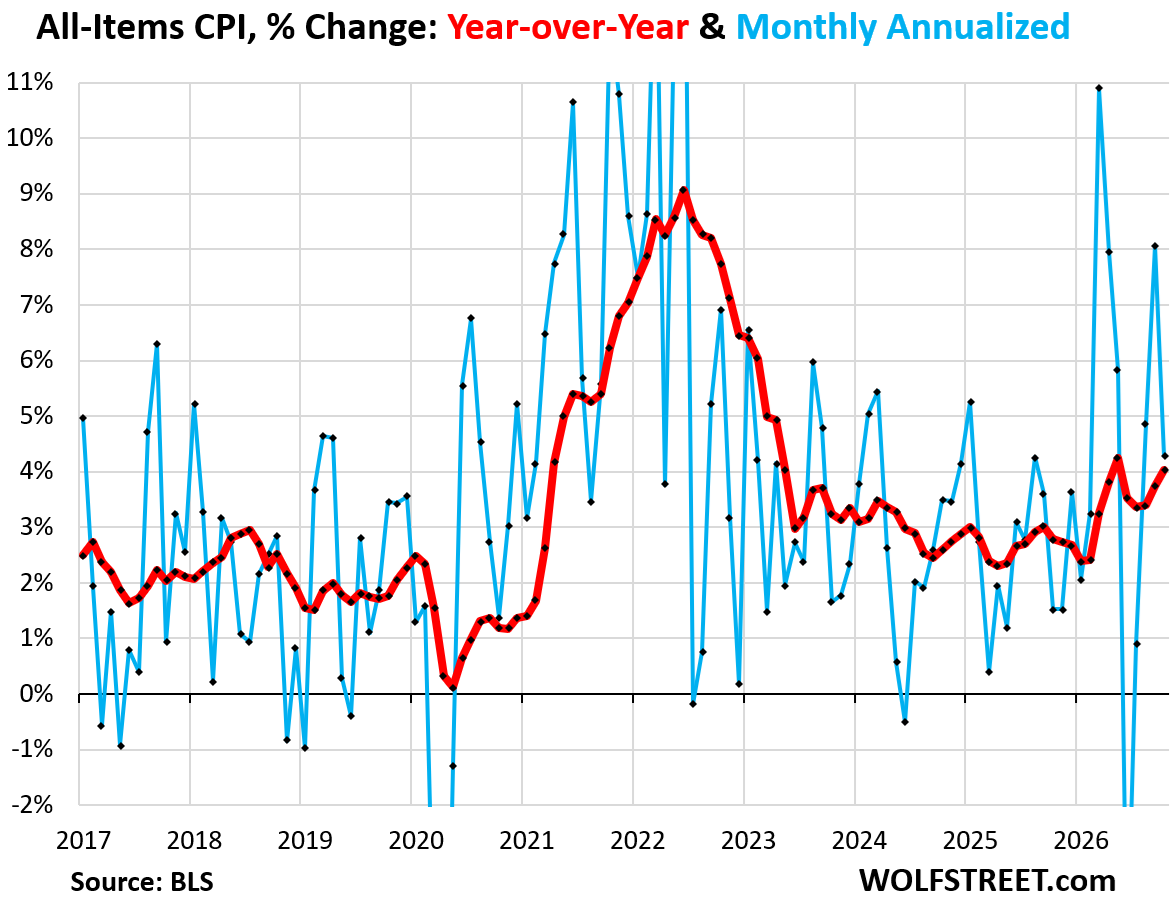
The all-items CPI, which includes food and energy, rose by 0.35% in October from September seasonally adjusted (+4.3% annualized, blue line in the chart).
Year-over-year, the all-items CPI, accelerated to 4.0%, calculated as per the method described above (red line in the chart).
Since the beginning of 2020, the all-items CPI inflation has surged by 30.5%.
The “core” CPI, which excludes energy prices and food prices, rose by 0.30% month-to-month (+3.6% annualized; it has been above 3.5% for the third month in a row).
One driver was inflation in core services, particularly in super-core services, which spiked. The other driver was inflation in core goods.
Year-over-year, the core CPI accelerated to 2.8% (red line), as per the calculation method explained above.
Inflation in services.
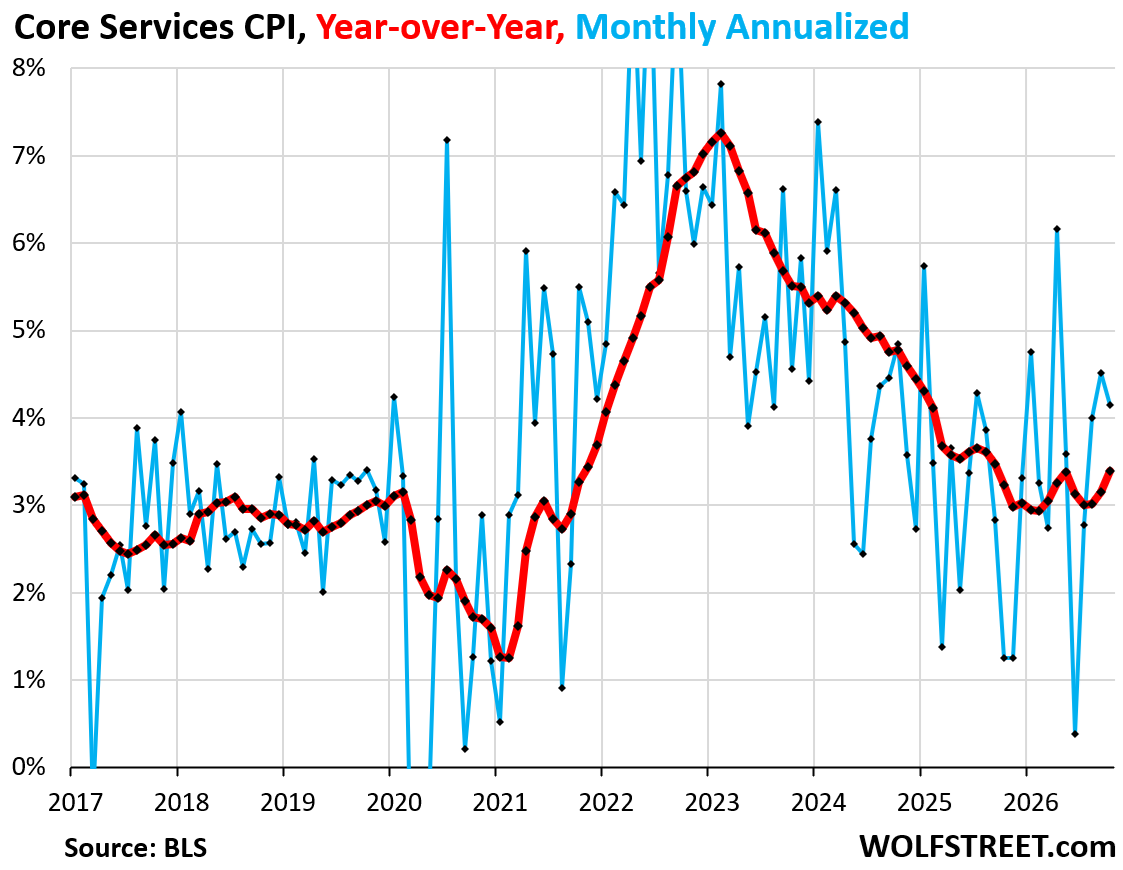
The core services CPI rose by 0.34% (+4.2% annualized) in October from September. On an annualized basis, it was the third month in a row above 4.0%.
Core services exclude energy services such as electricity and utility natural gas services
The big driver behind hot inflation in services were “super-core services” that exclude housing services. And that is a bad sign that inflation has spread deep into the services economy beyond housing.
Year-over-year, the core services CPI accelerated to +3.4%, calculated as described in the method above (red line).
Since the beginning of 2020, the core services CPI has surged by 31%.

Inflation in non-housing services (“super-core services CPI”) spiked by 0.45% month-to-month (+5.5% annualized), the second-worst increase since September 2024, behind only May 2026.
Among the biggest drivers were:
- Recreation services (+0.82%), incl. streaming, cable, satellite, pet services, movie tickets, memberships, concerts, shows, theaters, the fun stuff.
- Public transportation, incl. airline fares (+0.84%)
- Auto insurance (+0.71%)
- Auto maintenance and repair: (+0.62%)
- Motor vehicle fees (+0.69%)
- Water and sewer and trash collection services (+0.61%)
- Hospital and related services (+0.70%)
Year-over-year, the CPI for super-core services accelerated to 3.5%, as per the calculation method described above.
Inflation in housing services:
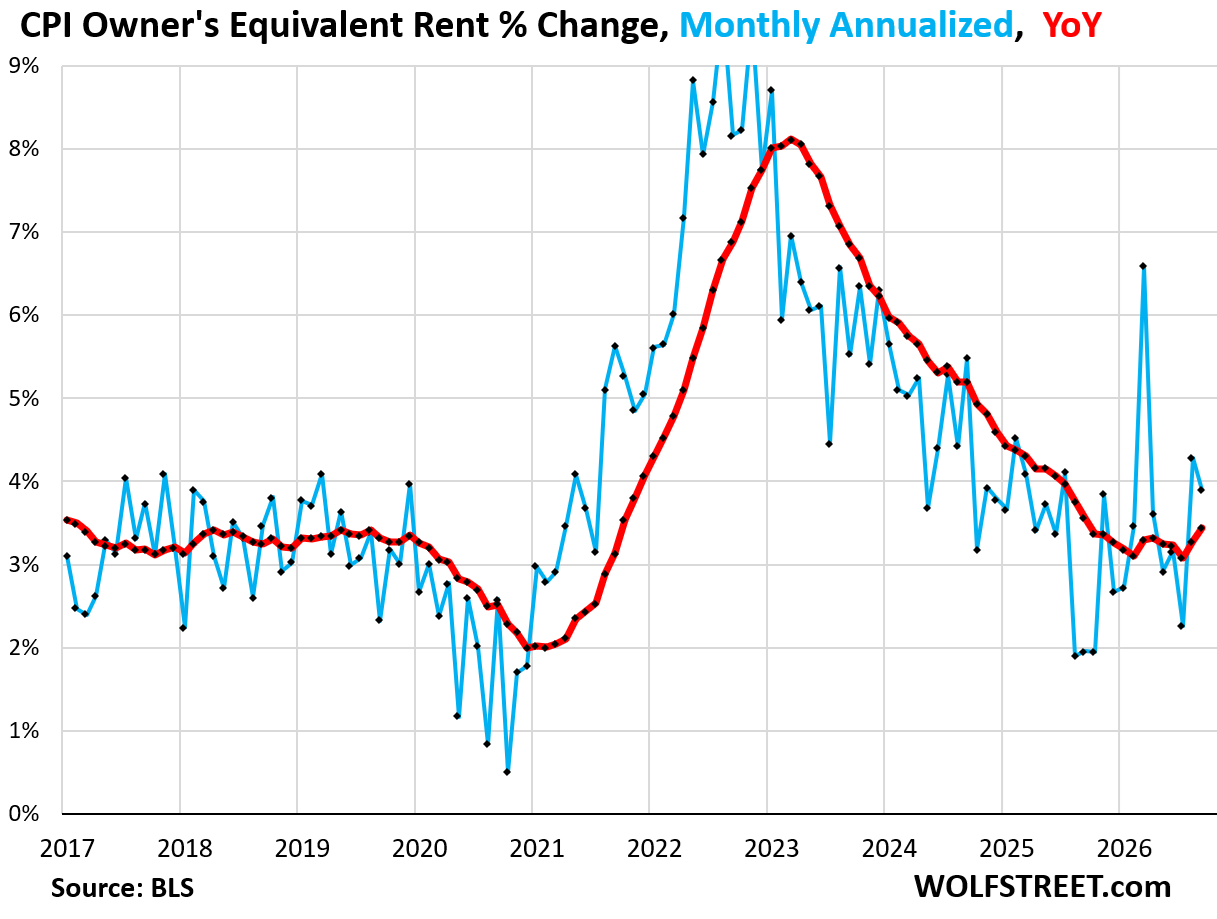
Owner’s Equivalent of Rent (OER): +0.32% month-to-month (+3.9% annualized).
Year-over-year, it rose by 3.4% as per the calculation method described above.
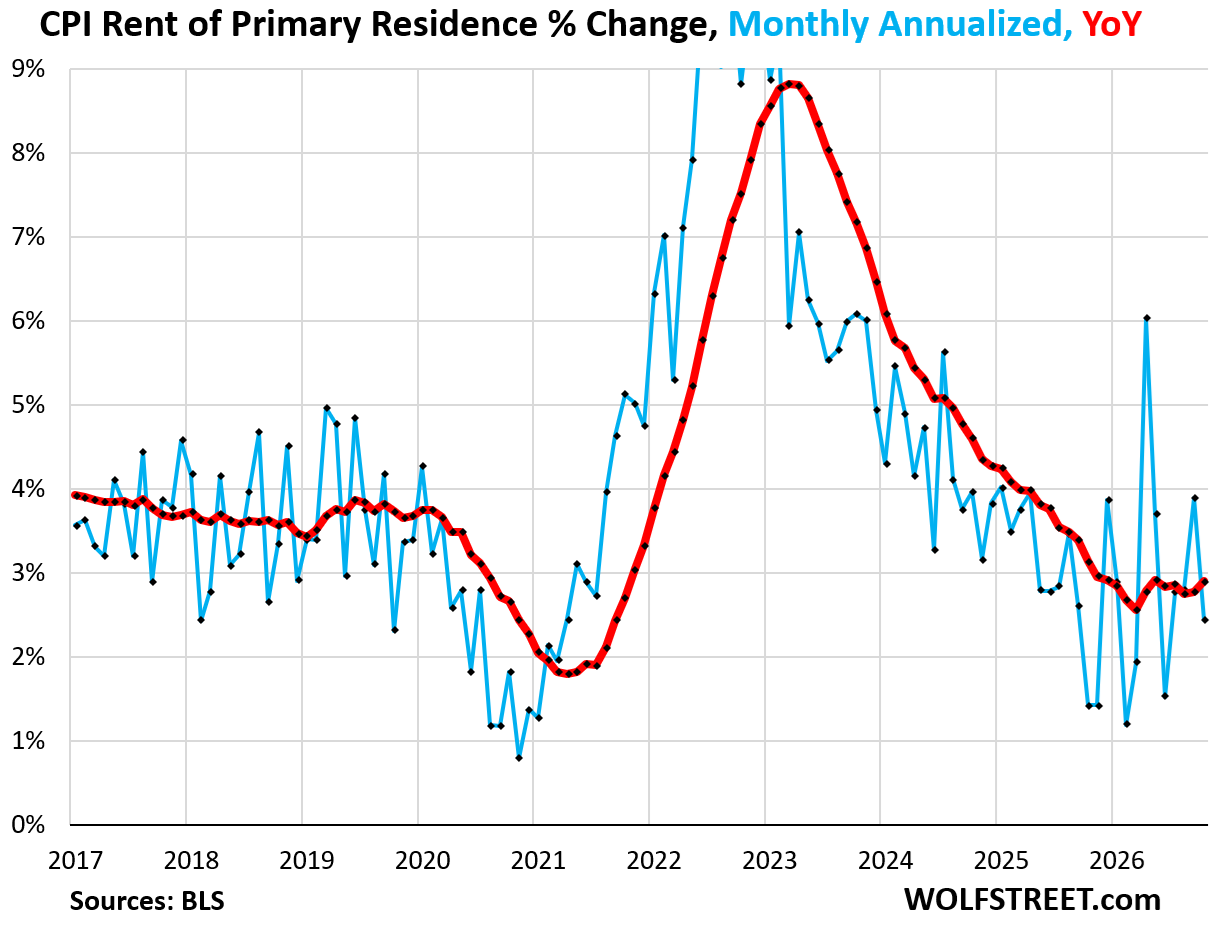
Rent of Primary Residence: +0.20% month-to-month (+2.4% annualized).
Year-over-year, it rose by 2.9% as per the calculation method described above.
Inflation in core goods.
The “core goods” CPI (all goods except food & energy goods) rose month-to-month by 0.39% (+4.7% annualized), the biggest month-to-month increase since May 2023.
Year-over-year, it accelerated to +1.1% as per the calculation method described above.
In normal times, inflation in core goods is very low or negative, reflecting competitive pressures, especially via online price comparisons, constantly improved manufactured products, and lower per-item production costs due to globalization and ever more efficient automation.
Low or negative core goods inflation generally counterbalances the much higher inflation in core services. The pandemic inflation spike in goods blew that apart, but then goods prices fell (such as used vehicles, consumer electronics) or stalled at high levels (such as new vehicles).
But the recent price increases are worrisome as the remove the counterbalance to services inflation.
Food and energy inflation.
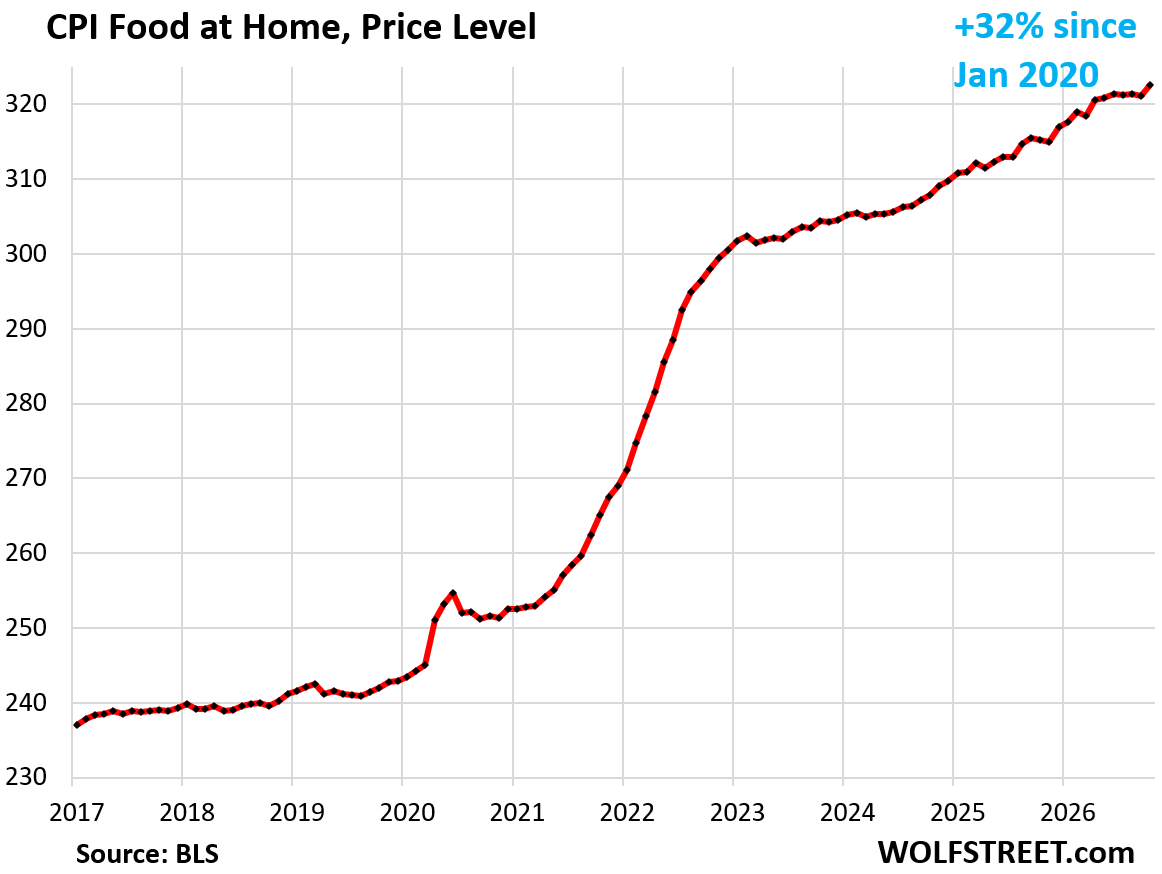
The CPI for food at home jumped by 0.44% month-to-month (+5.5% annualized).
Year-over-year, it increased by 2.5% as per the calculation method described above.
Since the beginning of 2020, food prices have surged by 32%.
This chart shows the price level, and not the percentage change:
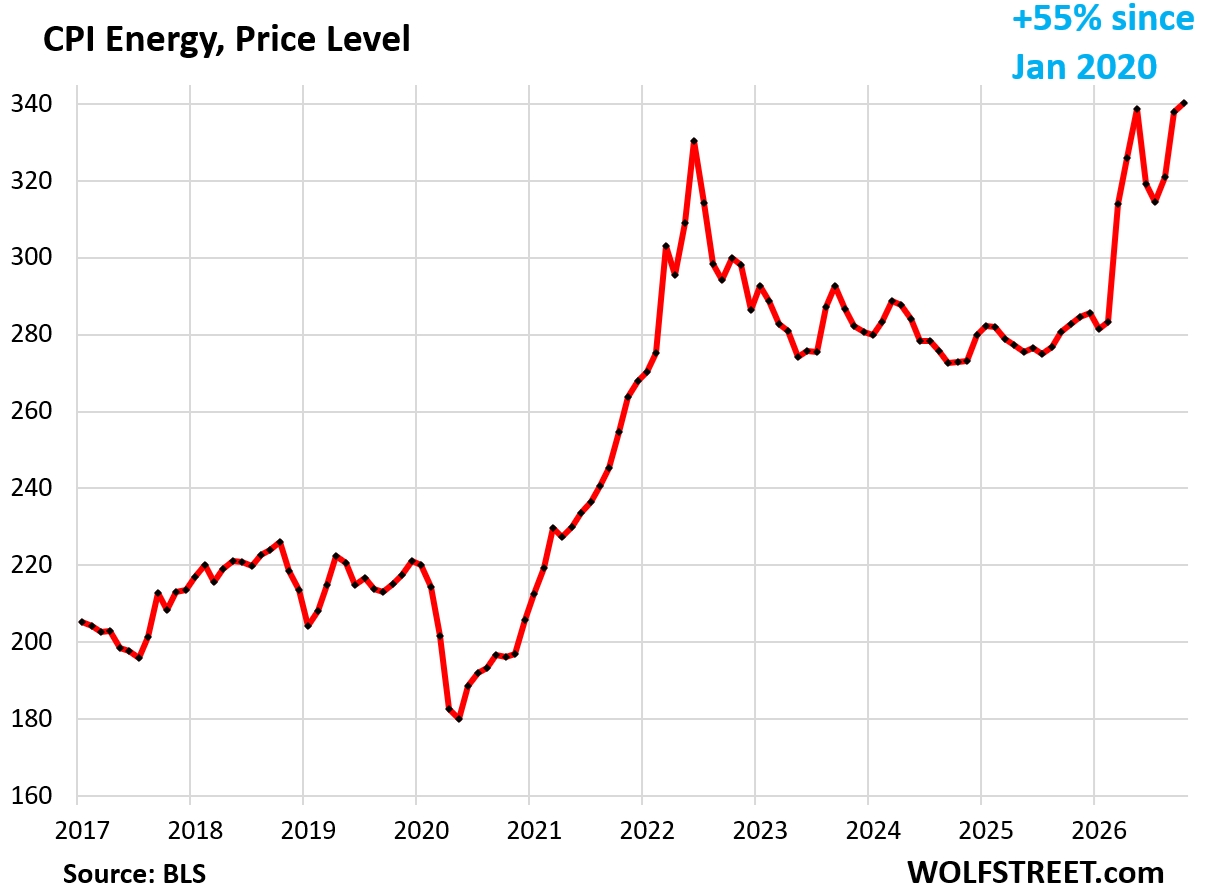
The energy CPI jumped by 0.70% month to month, among big month-to-month increases:
- Gasoline (+1.0%)
- Electricity (+0.94%)
- Fuel oils, propane, and other fuels (+2.4%)
But utility natural gas piped to the home declined month-to-month (-0.76%).
Since the beginning of 2020, the Energy CPI has surged by 55%.
The chart shows the price level, not the percentage change:
In case you missed it, from the weekend: Would Be a Worrisome Sign for the Bond Market if Treasury Yields Turn Higher Next Week (and now this is “next week”)
Enjoy reading WOLF STREET and want to support it? You can donate. I appreciate it immensely. Click on the mug to find out how:


Thanks wolf