
The interplay of risk and inflation.
By Wolf Richter for WOLF STREET.
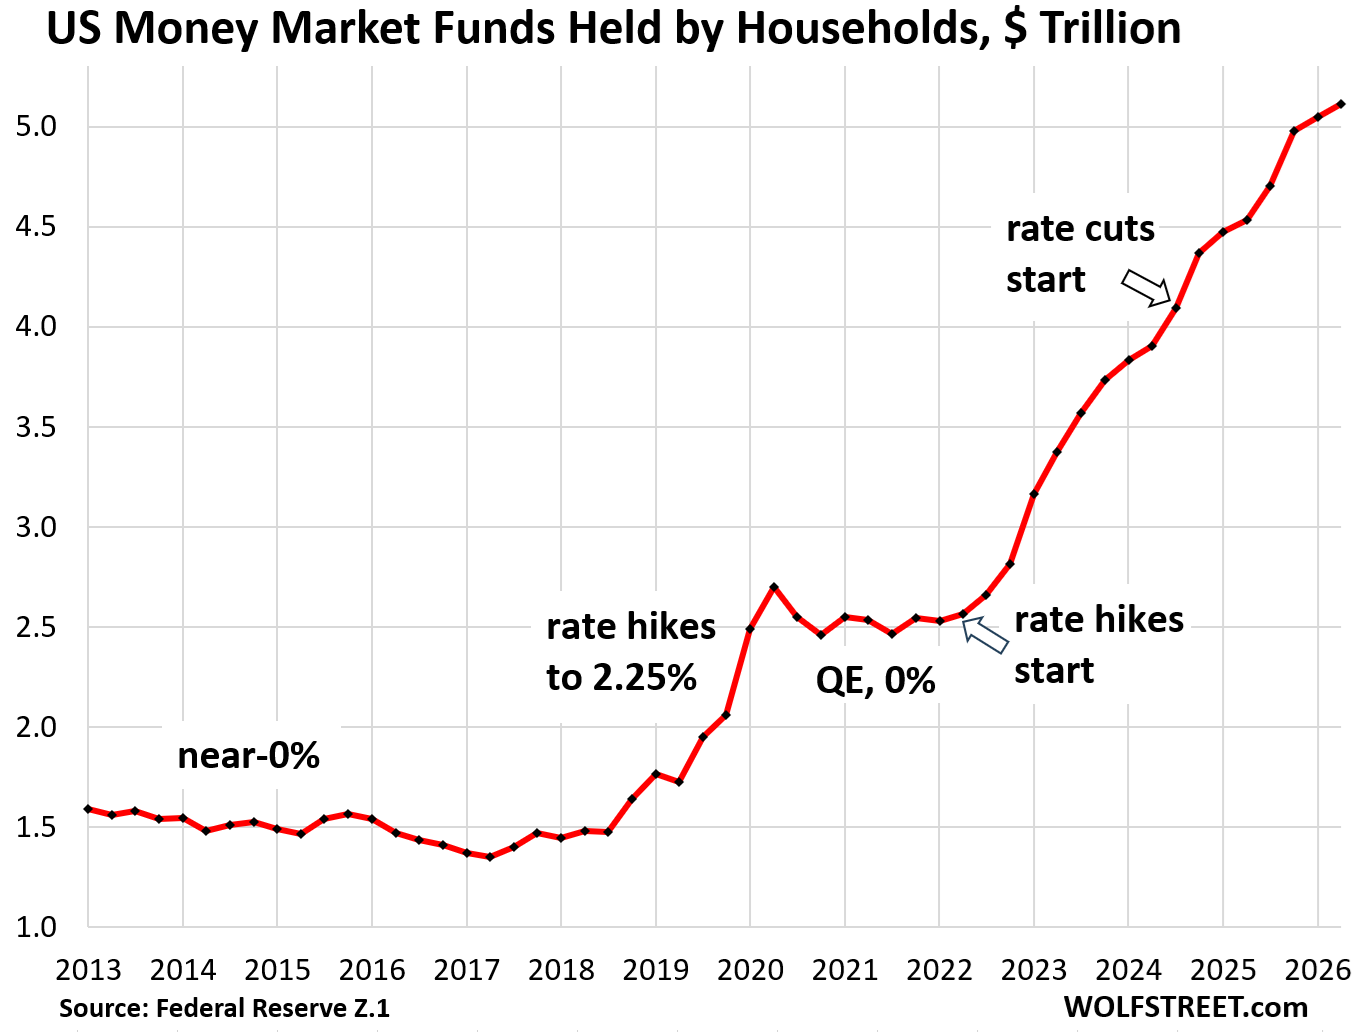
Yields of money market funds, currently below 3.75% after fees, aren’t as attractive as they were in the first half of 2024 when their yields went over 5%. Nevertheless, households have further increased their holdings.
Balances in money market funds (MMFs) held by households rose by $63 billion from the prior quarter, and year-over-year by $579 billion, or by 12.8%, to $5.1 trillion in Q2, according to the Fed’s quarterly Z1 Financial Accounts. Since Q1 2022, when the Fed started hiking its policy rates, balances have more than doubled.
Balances include retail MMFs that households bought directly at their broker or bank, and institutional MMFs that households hold indirectly through their employers, trustees, and fiduciaries – such as in their 401(k) plans.
Total MMF balances, including those held by households and institutional investors, rose by $152 billion in the quarter and year-over-year by $960 billion, or by 12.8%, to $8.4 trillion:
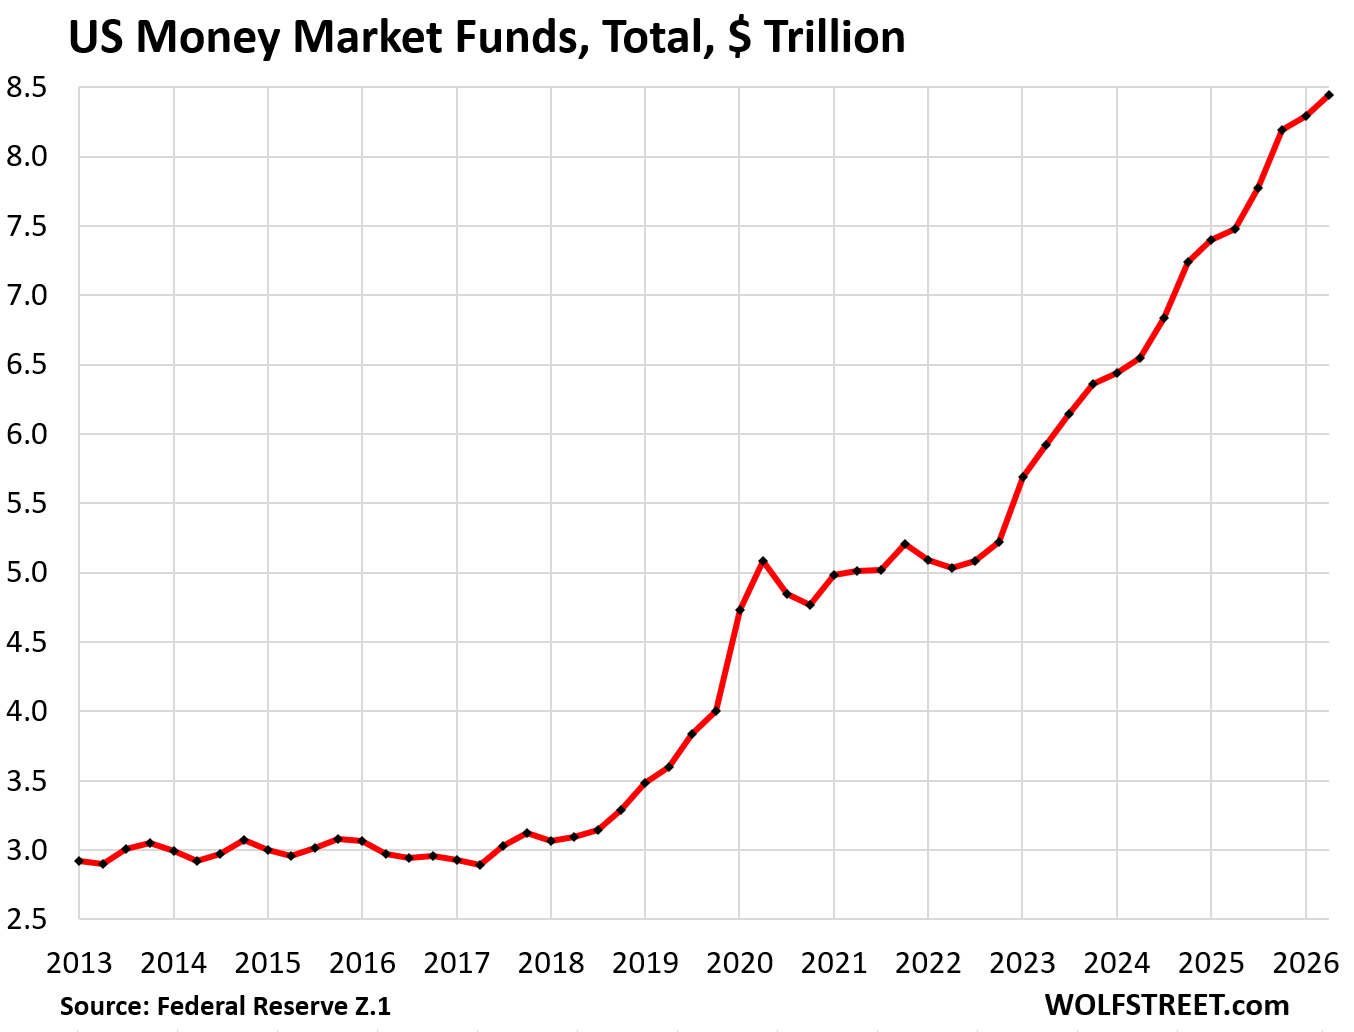
MMFs invest in short-term liquid securities with a remaining maturity of less than 1 year, but largely less than 3 months. Prime MMFs invest in repurchase agreements (repos), Treasuries, agency securities, asset-backed commercial paper, certificates of deposits with big banks (lending to banks), and overnight reverse repos at the Fed (ON RRPs), among others. Specialized Treasury MMFs invest in Treasuries and ON RRPs. Municipal MMFs, which people buy for tax reasons, invest in short-term municipal debt.
Treasury bills bought at auction and held at brokers, where they can be set up on automatic rollover, are a close alternative to MMFs and similarly liquid. They generally don’t involve fees, and so their yields can be as good or better than MMF yields after fees.
Today, the government sold 6-month T-bills at the auction at an “investment rate” of 4.20% or a “high rate” of 4.06%. In the secondary market, the 6-month yield traded at 4.18% today.
The government also sold 3-month T-bills today at an investment rate of 4.07% or a high rate of 3.97%. In the secondary market, the 3-month yield traded at 4.04% today.
Yields of MMFs will tick up over the next few weeks to reflect those T-bill yields if the Fed hikes its policy rates on Wednesday.
The bond market has been clamoring for a rate hike, and traders have priced in a rate hike, so all it would take is for at least 7 of the 12 voting members of the FOMC to vote for a rate hike. But at the last FOMC meeting in July, when the bond market had already priced in a rate hike, only 3 of the 12 members voted for a rate hike, and there was no rate hike.
But in “real” terms (after inflation), MMF yields have been meager to negative as consumer price inflation has been running slightly below or slightly above MMF yields this year. The Consumer Price Index pegged inflation at 3.4% year-over-year in August; the PCE price index, which the Fed favors, pegged inflation at 3.7% year-over-year in July.
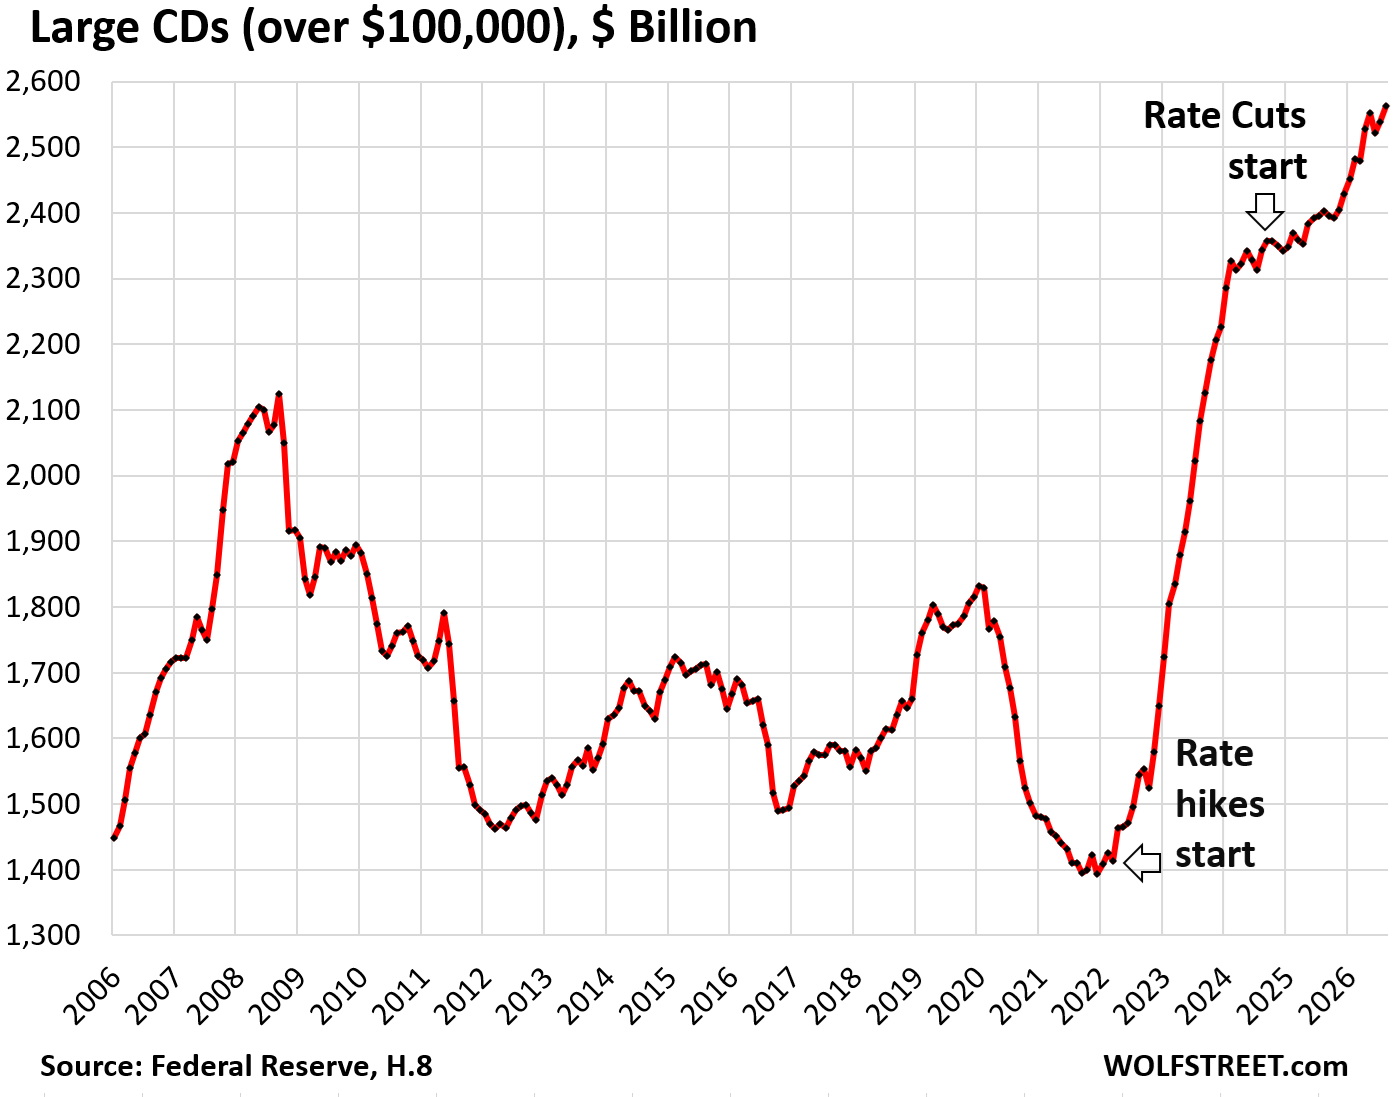
Large Time-Deposits at banks (CDs of $100,000 or more) rose by $160 billion year-over-year to a record $2.56 trillion in August, as per the Federal Reserve’s monthly report on bank balance sheets (H.8). This includes CDs that MMFs hold. The FDIC insures CDs up to $250,000.
Since March 2022, when the rate hikes began, large CD balances have nearly doubled. Starting in September 2024, the growth rate slowed after banks reduced their CD interest rates in response to the Fed’s rate cuts. But growth re-accelerated this year among slightly higher rates.

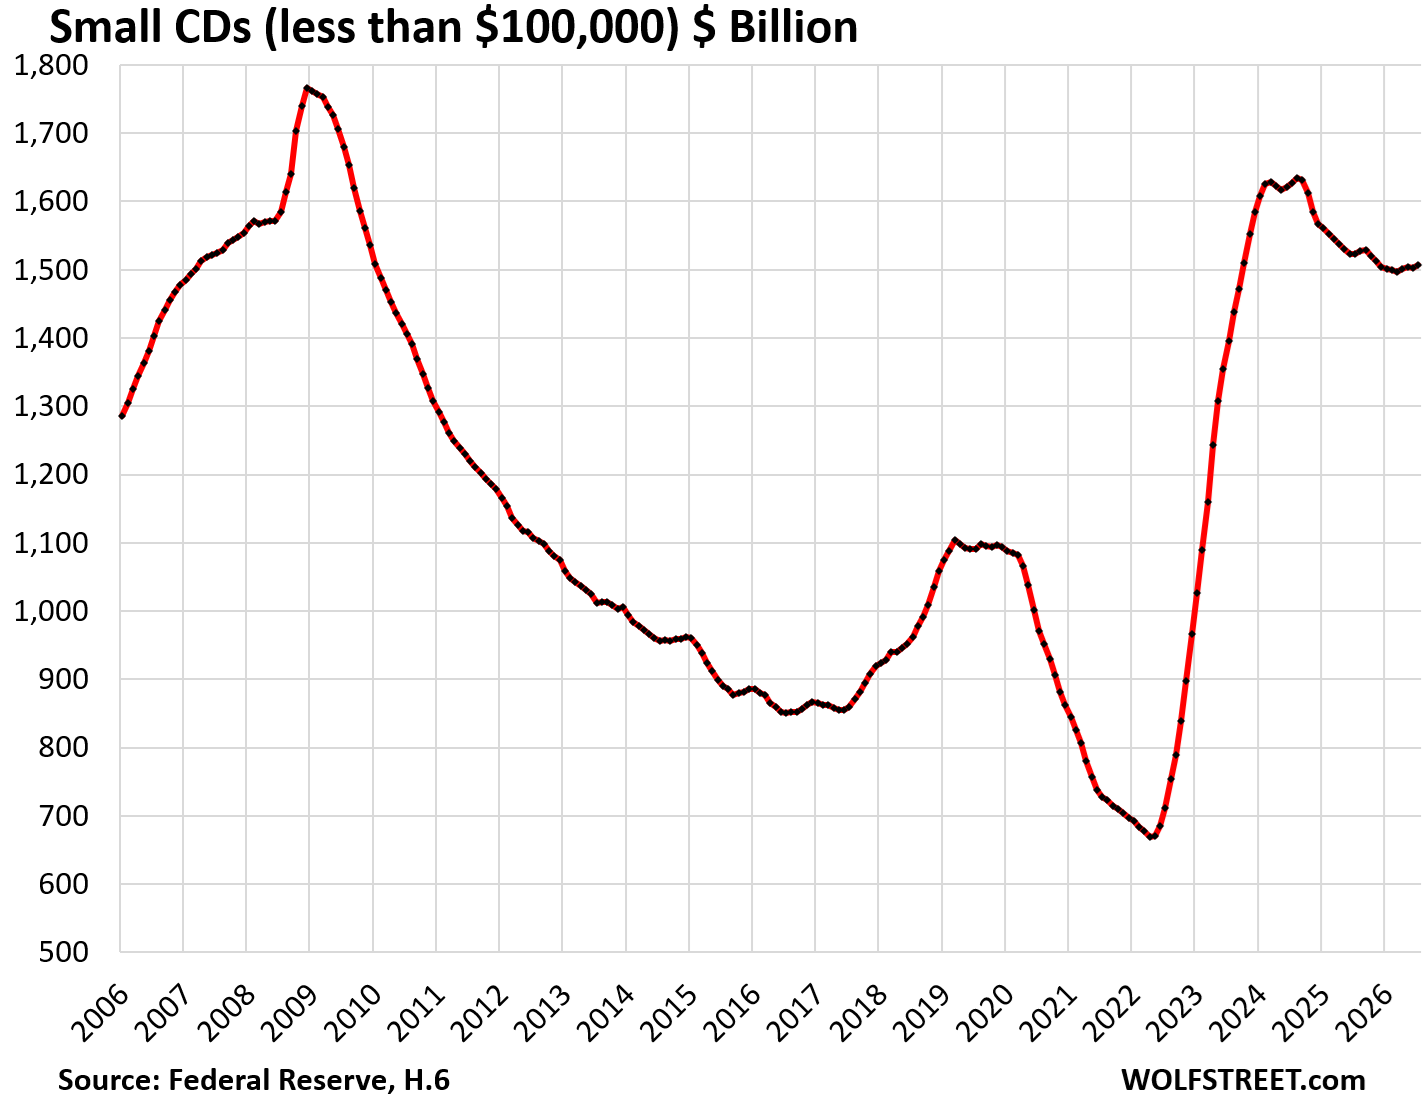
Small Time-Deposits (CDs of less than $100,000), a favorite with savers, are very interest-rate sensitive, as the chart below shows. After the peak of short-term interest rates in the first half of 2024, balances declined but then stabilized at around $1.5 trillion, with almost no change for the past seven months, per the Federal Reserve’s separate data on money stock (H.6).
Since the peak in September 2024, when the Fed started cutting rates, balances have dropped by $128 billion.
Many CDs are currently being offered with rates of 4% and higher. Retail investors can buy CDs directly from their banks or through their brokerage accounts (“brokered CDs”).
The interplay of risk and Inflation. Inflation isn’t going back into the bottle, and for investors in low-risk instruments, such as MMFs, CDs, and T-bills, that’s a problem at current yields.
Inflation is a problem for all assets as it eats purchasing power in equal measure. But the hope is that either asset prices themselves rise faster than inflation, or that the yield is higher than inflation, or both, thereby compensating investors for the loss of purchasing power due to inflation, plus some, hopefully, knock on wood. But that’s a hope and is not always the case.
It hasn’t been the case in the overall housing market since mid-2022, with the national median home price rising at a much slower rate than inflation, thereby losing ground to inflation. From mid-2022 through August 2026:
- National median price, single-family homes: +3.3%.
- Consumer Price Index (CPI): +13.3%.
Stock prices have pulled far ahead of inflation so far in this cycle, but the risks are big, and long sell-offs are not uncommon, and then those capital losses are made worse by the loss of purchasing power due to inflation.
The S&P 500 plunged by 50% and the Nasdaq Composite by 78% during the Dotcom Bust from their March 2000 highs. They plunged again by 50% during the Financial Crisis through March 2009.
It took the Nasdaq till 2015 to get back to its March 2000 high – after 15 years that included lots of money printing by the Fed.
But over those 15 years, there was 39% CPI inflation, so in “real” terms (adjusted for inflation), the Nasdaq was still down by 39% in 2015 from the March 2000 high.
In 2018, when the Nasdaq had just broken even in “real” terms with March 2000, there was another sell-off that pushed the Nasdaq back into the negative, adjusted for 47% inflation since March 2000.
Then came the covid crash that knocked the Nasdaq back into the negative in real terms, adjusted for 51% inflation since March 2000.
It wasn’t until April 2020, that the Nasdaq soared past its inflation-adjusted March 2000 high. It took 20 years in real terms!
But then over the past 6 years, the gains, adjusted for inflation, were huge. That is the interplay of “risk” and “inflation.”
So stocks and real estate are in entirely different risk categories – with big potential gains and losses – than highly liquid, short-term yield investments, especially those with government backing (T-bills and FDIC-insured CDs), with nearly no risk of capital losses, essentially no chance of significant capital gains, and only relatively low yields.
Enjoy reading WOLF STREET and want to support it? You can donate. I appreciate it immensely. Click on the mug to find out how:


You are giving the reader the impression that home prices are rising nationwide. Nothing could be further from the truth. The “median” home price has been rising because it’s mostly higher-priced homes that are selling. There is very little activity in the “below $400k” market to move the median price needle down. Once sales pick up in the sub $400k market, there will be a downward trend in the median prices nationwide.
Home prices have been plunging in some markets by over 20% (I document some of those here) and rising in other markets, and the overall national median price (that 1 house in the middle of all transactions = median price) has ticked up by 3.3% since mid-2020.
Here are a couple of articles for your perusal with lots of charts:
Oh Dear, Condo Prices Fell by 15% to 33% in 33 Bigger Markets, Some Below 2006 Levels, as Historic Condo Bubbles Deflate
Oh Dear, Prices of Single-Family Homes Fell by 11% to 26% in 15 Bigger Cities Already
That guy on YT with his Reventure app / videos has documented tons of places in FLA USA that have dropped 20%+.
I just wonder how much longer the housing decline in these really distressed areas stays somewhat under control?
And then how long it takes for the contagion to spread in a much broader regional manner that brings us closer to 2009 / national level price drops?
Inquiring minds want to know.
@BenW – That YT guy is Rick Gerli. I saw a few videos and decided to just ignore him. All his video thumbnails look like horror stories, like many other youtubers. These are usually the hallmarks of a permabear or a shill who thrives on selling panic. Dont be perma anything.
Not many sub $400K houses out there, and I write this from a rural area. It costs too much to build new that would allow this to happen.
1. Mike H was talking about sales… not much demand at current prices for sub-$400k homes, only the high end is moving, that’s how I read his comment.
2. You’re saying the opposite, that there isn’t a lot of sub-$400k inventory out there. But in the US, in USD, that’s nonsense. There are lots of sub-$400k houses on the market. A little less than half of the houses that sold in August sold for $400k or less, according to NAR. Just not in San Francisco or San Diego or Aspen.
Not sure I understand “It costs too much to build new that would allow this to happen.”
On one hand I agree that building is more expensive than it should be, but on the other I’ve built several homes for myself and it’s still pretty easy to turn a significant profit on those under 400k to justify the effort, especially for a small builder who is not in a big city.
I was in San Antonio TX last year, and in several new developments you could buy a new smaller 3BR detached SFR (not condo or townhome) for $150K, and a decent size (1700 sq ft) for $220-250K. Single level with actual back yard and 2-car garage. 20 min. from downtown. $15-20K interest rate buydown incentives. And NO HOA.
The purpose of the Case-Shiller Index is to correct for those exact issues you mention about Median Sales Price figures and the Case-Shiller Index has been above 2.5% annual growth for the last year.
You can point out 2.5% is less than inflation and you’d be correct, but nominal home prices are not falling.
Dan,
The purpose of the CS index is to show home prices in 20 metros in separate indices. It’s a small lazy collection of metros that doesn’t even include Houston, Philadelphia, Austin, Omaha, etc. but those 20 metros are all the CS covers.
So the CS is an old at one time revolutionary set of 20 indices that the original creators, including Case and Shiller, sold decades ago, and that has changed hands several times and now is owned by S&P Global. It was and is far superior on a metro-by-metro level than median price indices. But no one has invested any money in it since the 1990s, and so it still only covers 20 metros, and nothing else. It’s horribly inadequate in this way and other ways, and so I stopped using it.
But its method is sound, though you can argue with its algos that adjust the sales pairs based on the time between the sales (maybe 20 years!) and other fudge factors, such as home improvements. Read the methodology, quite enlightening. But it was revolutionary at the time; too bad the purchasers over the decades let it go to hell.
The CS index also offers a combined “20-cities index,” which consolidates the data from the 20 metros that it covers.
But its so-called “national” index is a mixture of its 20-cities index and the government’s FHA home price index, which is based on government mortgage data, which excludes lots of home sales that don’t involve a government-backed mortgage, and is therefore skewed. So that’s what you’re dealing with. It’s really pretty sloppy by today’s data collection standards.
But DO look at the 20 indices of the individual cities, you’ll see that home prices ARE dropping in some and are rising in others.
DO click on the links I provided and you will see how home prices are falling in lots markets.
So your statement “but nominal home prices are not falling” is a dressed-up lie. What you can say is “the National Case Shiller Index isn’t falling,” and that’s correct, but home prices are falling in lots of cities, and are rising in others.
I am the first? Woo-hoo! I must have nothing else important to do.
In previous years and times I spent $$+ living where we do. We have no utilities, not even a cell signal. And few neighbors. But in the years since 2010, we are ahead including upgrades and maintenance. Zero utilities.
One of these days y’all may rethink your priorities. You may rethink establishing ties with neighbors are a PITB. And maybe they are ARE a major PITB. So be it. But there might be some good folks. Time for ribs between neighbors.
I can’t really say more without y’all thinking I’m an extremist or anarchist. Actually I’m much more mellow than that but we do have three Catalouta and two Cone Corso dogs so you should be good if you bring treats. Until you run out. But I’ll step in to help you get out the gate.
Seriously, us rural folk are the exception. But when the shelves are empty – oh my gosh. What will you do the then?
The fed didn’t fix it.
Wolf, it’s about time you posted something like this. Not everybody lives in a metro.
Not having cell coverage is an asset, not a liability. :-) You can actually eat dinner and not look at someone eyeing up their screen.
Spent today smoking up some salmon for winter. Freezers full. Spuds dug and veggies put away. No heating bill. Beats going to the gym.
And relations with neighbours is our big positive.
regards
I dreaming a day when I achieve freedom from cellphone and internet
Thats true freedom
I had that freedom for the first half of my life. That was long enough 🤣
I have been doing this for 25 years. But I made money, the root of all evil, before that so I still have to keep it and not lose it. Two things strike me as important
One – the M2 money supply was 300 billion in the 60s it is now 26 trillion and.. that does not include Bitcoin, etc.
Two -I read that the FED now owns About 50 percent of the 10 year Treasury bonds outstanding.
This can not continue for long.
“This can not continue for long.”
Correct. The Fed is already in the process of deciding how to shed them and replace them with T-bills, details coming later this year from the FOMC. It has already doing that with MBS since December.
I knew I should have waited to mid September to lock in my little CD but again the offer might have been 50 basis points different. It will all get more interesting after these midterms!!
Have 5 percent yield in my current credit union checking account.
Lots of contingencies to get that 5 percent though.
Cannot exceed $25,000 any time in the month.
Have to make 10 purchases every month to qualify. And a couple other things I cannot recall.
Otherwise it reverts to 1.5 percent if the contingencies are not met.
Long term and jumbo cd’s seem to yield less than short term smaller cd’s.
Which is weird to me because you would be giving the establishment more money to use, but not compensated appropriately for having large amounts of your money tied up for large amounts of time….But I guess nobody asked me.
Credit unions are better than banks, but overall it is all kinda scamish.
Whatever…
Play the game, or get played.
“Play the game, or get played.”
Actually, both can happen. You can play the game and get played.
Haven’t you heard the saying something like…
“Sometimes the only winning move is to not play the game.”
“Have 5 percent yield in my current credit union checking account.”
Really? Please tell us which credit union and what duration. I have not seen a single credit union that beats what the treasury offers on equivalent duration.
read the small print HUCK includes.
In other words, there is NO credit union beating the treasury on yields for equivalent duration.
Got it.
Regardless Wolf, spring of 73′ again, more inflation, stagflation and negative real yields. There is no other path, aside from hyperinflation, which I think we all want to avoid.
The Shiller CAPE ratio has been above 40 for several months. It doesn’t predict the timing of a crash, but signals returns over the next decade will be low or negative.
“But at the last FOMC meeting in July, when the bond market had already priced in a rate hike, only 3 of the 12 members voted for a rate hike, and there was no rate hike.”
Fedwatch now says the odds of a rate hike are 92%. But I ask where are the next 4 vote changes going to come from? Which voting members have made a comment suggesting they will change? The August PPI and CPI reports did not tell us anything that wasn’t the case months ago.
There could be a big movement tomorrow when, I predict, the FOMC picks up a vote or two but comes up short of raising rates. A lot of money will be mis-positioned when that happens.
Forward guidance may be gone, but I think we get at least a couple of mixed votes prior to the actual rate hike.
I think the fact that the so called risk free security has been the most risky security too have invested in since QE artificially suppressed the interest rate curve.
There is a bear market in bonds that means that interest rates need to rise to among other things reflect the correct pricing of risk.
You’re talking about 30-year bonds, not T-bills. The article is talking about T-bills, money market funds, and CDs. It has zero to with 30-year bonds.
30-year Treasury bonds have essentially no credit risk (risk of default), but like all 30-year bonds, they have other risks, including inflation and interest-rate risk.
I would say nowadays that there’s a pretty big risk of 30Y Treasury bonds defaulting at some point down the road before we get to 30 years out.
Hopefully, you’re still around writing columns, so I wonder what kind of adjectives go well beyond “hoccus-poccus” in terms of all the shenanigans that Bessent / Warsh & future ruling class oligarchs / policy makers come up with.
Your statement is by definition BS. A modern country that controls its own currency doesn’t default on the bonds in its own currency because it can always use the central bank to create money to service the debt. Got it? Tattoo this onto your braincells.
What DOES happen is inflation. And I’ve been discussing this for years. The risk for 30-year bonds is INFLATION, not default.
@Wolf – Can it be argued that the US has legally not defaulted on its debt, but has actually defaulted because it robs its debt holders of purchasing power? If yes, then I dont care about the legal definition. Sometimes laws can be bullshit.
No it cannot be argued. Loss of purchasing power is NOT a “default.” These are two very different things. And I’m sick and tired of having to read this bullshit here. It makes discussions impossible.
obliviously people can post whatever stupid bullshit they want on the internet, but they will get blocked and deleted here because I’m going to keep this corner relatively clean.
What does this all portend? It’s all so crazy. So crazy.
I’ve got the feeling that the current investor’s sentiment is changing from “return ON investment” to “Return OF investment”. A growing population, me included, worries about a crash in everything. That would result in loss of capital. Whoever manages to hold on to his capital has a better start after a crash. Yes, capital will depreciate. But i rather have 100% of my current capital depreciating than half of it after a crash. So CD’s are an option that pay some better interest than a normal savings account.
My current strategy is to open one or more CD’s in small amounts in such a way that for the next two years one will mature every month. That way every month some capital comes available to do with what is prudent at that moment. Putting it into assets like stocks or PM’s, or into a new CD, keep it liquid on a savings account, or just spend it if needed.
At the moment (here in Europe) short term CD’s (3mnt, 6mnt, to 1yr) are most attractive, paying 2.5%, 2.75 and 3.1% respectively by Swedish and German banks. Fully insured and free from ‘source-tax’. If rates go up, i will have some capital freed up every month to reinvest on a higher yield and will not lose any capital, but have grown it a bit.
Remember: First rule of building capital is “not to lose it”.
It’s a big hassle for me to do a proper ladder at this point, especially as Spain demands you track and report every single piece of property you own in foreign assets every year, not just gains/losses or purchases/sales.
But I’m just leaving a chunk of my money invested in a Euro Overnight Rate Swap ETF, and similar instruments, while staying light on some whole-market stock and energy ETFs. Sold gold at the very peak after checking out those great podcasts by Wolf’s friend.
I know this is not an optimal strategy for returns and that I should ideally be taking more risk at my age but I have very little job security and want to be able to sleep at night. If, and that’s a huge if, ECB starts cutting interest rates anytime soon, I’m thinking that I’ll still be able to react very quickly and sell those highly liquid investments. And I’ll take a small to moderate hit if the stock market implodes.
The AI mania and Middle East conflicts don’t leave much space for complacency.
The treasury needs negative real rates, so getting everyone ring fenced in fixed rate vehicles will allow the Fed to run inflation hot. It’s the only way the government can keep these plates spinning (i.e. the debt serviced). None of this is personal, it just math.
The Federal govt should be delighted that there are people willing to buy their short term debt at such paltry returns.
Those who purchase such are buying, and paying for insurance and protection from geo political and stock market risks.
Lucky for the Federal govt the Taylor Rule is not the Fed’s guiding light. It should be IMO.
Yesterday’s 13-week T-Bill auction was the first in which the quantity of that tenor (during the second week of September) exceeded $100 billion. Afaik the quantity of this particular tenor’s auction-size has doubled in the last 5 years.
Let’s extrapolate. If the CAGR of quantity-size auctioned increases further will Treasury be able to nonchalantly auction $200 billion of this one tenor in 2031 without many other prices & quantities also being dramatically different?
Second week of September 13-week auction quantity:
Sept 2026 = $100 billion
Sept 2025 = $85 billion
Sept 2024 = $75 billion
Sept 2023 = $70 billion
Sept 2022 = $54 billion
Sept 2021 = $47 billion
It the spring of 73′ again, this time with 40 trillion in DEBT. Just like then, the U.S. has caused a gas/oil crisis and we can all count on one thing for sure…
…stagflation for sure, probably a little hyperinflation in energy. Remember, you will know who your ruling oligarchs are by who you cannot criticize.
Hedge accordingly.
“.. you will know who your ruling oligarchs are by who you cannot criticize.”
I cannot criticize Wolf. He’s too good.
Via Fidelity, I can get call protected 5Y CDs @ 4.75% and a 10Y @ 4.9%.
That’s pretty damn good, but I probably wouldn’t tie up money for 10 year. Once the Fed is done raising rates in the next 6-9 months, those rates will be even better.
And then, we’ll likely have a recession. Locking in money for 5 years at what might be 5% interest will be fantastic, given how much yield control the Fed will do across the curve, once the recession ramps up.
The only way Joe Conservative Consumer like me gets screwed is when the Fed starts doing QE outside of a recession. But when that happens, we’ll have bigger concerns.
Historically, MMF provided inflation protection but not much more. Typical inflation adjusted yields are in the 0-1% range, which is right about where they are currently hanging out. Balances exploded because yields were finally good for the last 4 years, after a long period of negative real yields, but the 10 year average is still negative after adjusting for inflation.
Will the Treasury continue its shift towards TBills, then push the Fed to suppress rates again for many years to allow the govt more breathing room?
I’m not sure inflation would stop anybody. The Powers That Be already accepted inflation as a necessary evil.
When they buy LT bonds at a huge discount and finance the purchase with Tbills, there’s a huge increase to government cash flow in the short term, without LT consequences if the Fed lowers and suppress ST rates. We know Reps and Dems would likely tap ANY potential to continue deficit spending if it successfully kicks the can.
If the Fed actually backs up its talk with ST rate hikes, maybe they do care a bit about constraining inflation. After 5 years of high inflation, we’re in “show me” mode.
I am retired and I recently rolled over money into a 6 month CD that had a lower interest rate than the 1 year CD. My thinking is that rates will rise, so by putting money into the 6 month CD, I can take it out sooner and get a higher rate than the 1 year CD would have given me now. Am I right? Looks like it, but we will see. Rising rates are generally bad for the stock market, so CDs are a safer alternative for someone like me even though rates are low.
“30-year Treasury bonds have essentially no credit risk (risk of default)”
Let’s get rid of the “essentially” part before I tattoo this on my brain.
For the average person, they’re not going to care if Uncle Sam defaults or not. The outcome, HYPERINFLATION, will be the same.
And the reality is there’s a reason why you qualified your statement with essentially. This is because, yes, the US could actually at some point choose to default vs printing money out the wazoo.
And as bad as things appear today, I cannot imagine what things will look like in 10 years, if AI somehow misses the mark.
But if it does, we’re very likely to be in a civilization collapse phased whereby The Fed & national debt won’t be topics of conversation.
I’ve been watching Russia which WAS one of the 10 largest global economies but is now essentially collapsing do to a 3 day war/ special operation. Banks will be collapsing soon from what I read.
Their GDP is in free fall. Grain and fuel exports, the governments primary source of revenue, has slowed to a trickle. Russians have lost everything in a breathtakingly short amount of time. Farmers are unable to farm and they predict widespread food shortage.
I bring this up because Russia has demonstrated vividly that a few bad decisions at the top can in fact have devastating outcomes! Totally avoidable senario.
I suggest you may want to widen your info gathering sources. When the US puts out daily Trump bs and statements like these as “news”, one has to wonder what is/is not true and/or credible. 20 year auction rather tepid today even at all time high rates. Go figure. Wolf will no doubt be providing the details.
“Treasury Secretary Scott Bessent on Tuesday said his intervention in the bond market last week was “successful,” while reiterating that he has the tools to take further action.”
“Treasury Secretary Scott Bessent told lawmakers on Tuesday that the US Treasury is examining whether the Trump administration can give Americans a $5,000 dividend without going through Congress, and he believes there is a way to do it without adding to the deficit.”
“US Energy Secretary Chris Wright says oil flows are due to resume through the Saudi East-West pipeline within days after it was attacked and forced to shut down last week.”
Waiono –
You will understand the accuracy of my post before long as events unfold. Be patient!
Right now the entire world is being choke-holded by energy issues….orchestrated by the kick off at Nordstream 2. Trump followed Biden into the abyss. Now the emperor has been seen to have no clothes.
All you need is for the yield to be significantly higher than inflation over that period.
If you buy a 30-year bond with a yield of 7%, and inflation averages 4% over those 30 years (my estimate of 3-5% inflation in the future, not 2%), you got a pretty good deal:
So if you can buy $100,000 of 30-year bonds at a yield of 7% (we’re not even close now), you get $7,000 in interest payments for 30 years = $210,000 in total, plus you get your capital back at the end ($100,000); minus the 70% loss of purchasing power of the $100,000 (4% average inflation over 30 years). So in inflation adjusted terms you’d get back $30,00 of your initial $100,000, plus $210,000 in interest payments spread over 30 years that you can invest again as you please.
So at 7%, I would be a buyer of 30-year bonds because I think we’ll have 3-5% inflation over the next 30 years. But the yield is far from 7% now, and so I’m not a buyer now.
You better look up the range of what constitutes “hyperinflation.”
Hyperinflation, IMHO, here in the USA would be something akin to at least 7% over a period of at least 12 months.
At that rate of inflation for that duration, the interest expense on the national debt would easily move 2X and would approach $2.5T. This will result in a massive recession, whereby tax revenue will easily fall 40%.
And any sort of speculation along these lines is moot simply because the economy will crumble by the time the 30Y yields zooms past 7% to compensate bond investors for the inflation risk.
7% yield on the 30Y treasury is hoccus-poccus, wishful thinking.
We’ll have a really good idea how all of this is going to play out by the time TACO exits stage left. We’ll know how the 2026 & 2028 elections play out which will be vastly more consequential than anything Warsh or Bessent come up with over the next 28 months.
TACO can say a lot of really dumb things, but he’s got one thing right. “Whoever wins AI wins.” The problem is what does winning mean for humanity?
US 30Y Treasury yields will be highly dependent on this outcome.
“Hyperinflation, IMHO, here in the USA would be something akin to at least 7% over a period of at least 12 months.”
🤣💔
I stopped reading there. People make up their own definitions of everything, and so its impossible to have a rational conversation because everything means something different for everyone.
Hyperinflation starts at around 100% per year, not 7%.
Wolf,
Can you break down the elements of your 3% to 5% inflation prediction? I am interested in the premises, assumptions and the thought process.
I would have no clue where to begin, other than assuming that those who can print money from nothing will not stop.
Inflation is a policy, not an accident. I’m looking at the Fed’s policy actions over the past few years. The rate cuts started aggressively with the core PCE Price Index dropping to 3% and the rate cuts continued last year even as the core PCE price index started rising again last year, and now as it gets closer to 4%, rate hikes are back on the table. This shows to me a clear effort at keeping underlying between 3-5%.
Energy inflation can go haywire, like right now, and then when energy price re-plunge, the opposite happens. So the all-items PCE price index (which includes energy and food) can go negative because of a plunge in energy prices, while the core PCE is still hot, so the all-items index is probably not guiding index here though they’re not ignoring it.
There had been a lot of talk during the Great Recession about changing the target from just flat 2% to either a) 3-4 percent to give them more room from when the economy gets in real trouble or b) targeting the level not the rate and just trying to keep the overall average at 2% (or more).
Dating to the beginning of the Great Recession, PCE inflation averaged 1.5% in the decade after, so it was about 5% short. But as of now it has averaged 2.2% for the full 20 years, and 2.1% over the last 30. So it’s clearly not just the latter, but maybe some of both?
Really, it’s pretty remarkable. Around 1991, the Fed said “we will try to hit 2% inflation in the PCE index”, and now 35 years later, it’s averaged 2.2%! That’s only 8% too high in level!
Dow, S&P 500 and Nasdaq down as oil prices and Treasury yields continue to climb
DJIA0.78%
SPX0.45%
COMP0.72%
CL.14.51%
TMUBMUSD10Y0.36%