
AI has begun exacting its pound of flesh directly from consumers. And “Core Services” inflation remains hot.
By Wolf Richter for WOLF STREET.
The Fed-favored PCE price index today shed a slightly different and more ominous light on inflation for July than the CPI had done earlier this month. Energy prices were still up 15% from a year ago, and food inflation accelerated slightly to 2.4%. But beyond energy and food, the “core” PCE price index suffered from inflation in core services, where over 60% of consumer spending goes, and from the AI boom that has begun to exact its pound of flesh from consumers.
The core PCE price index – which excludes energy and food – rose by 0.25% in July from June (3.0% annualized, blue in the chart below).
Year-over-year, it rose by 3.35%, same increase as in June. The last four months produced the worst increases since October 2023 (red in the chart).
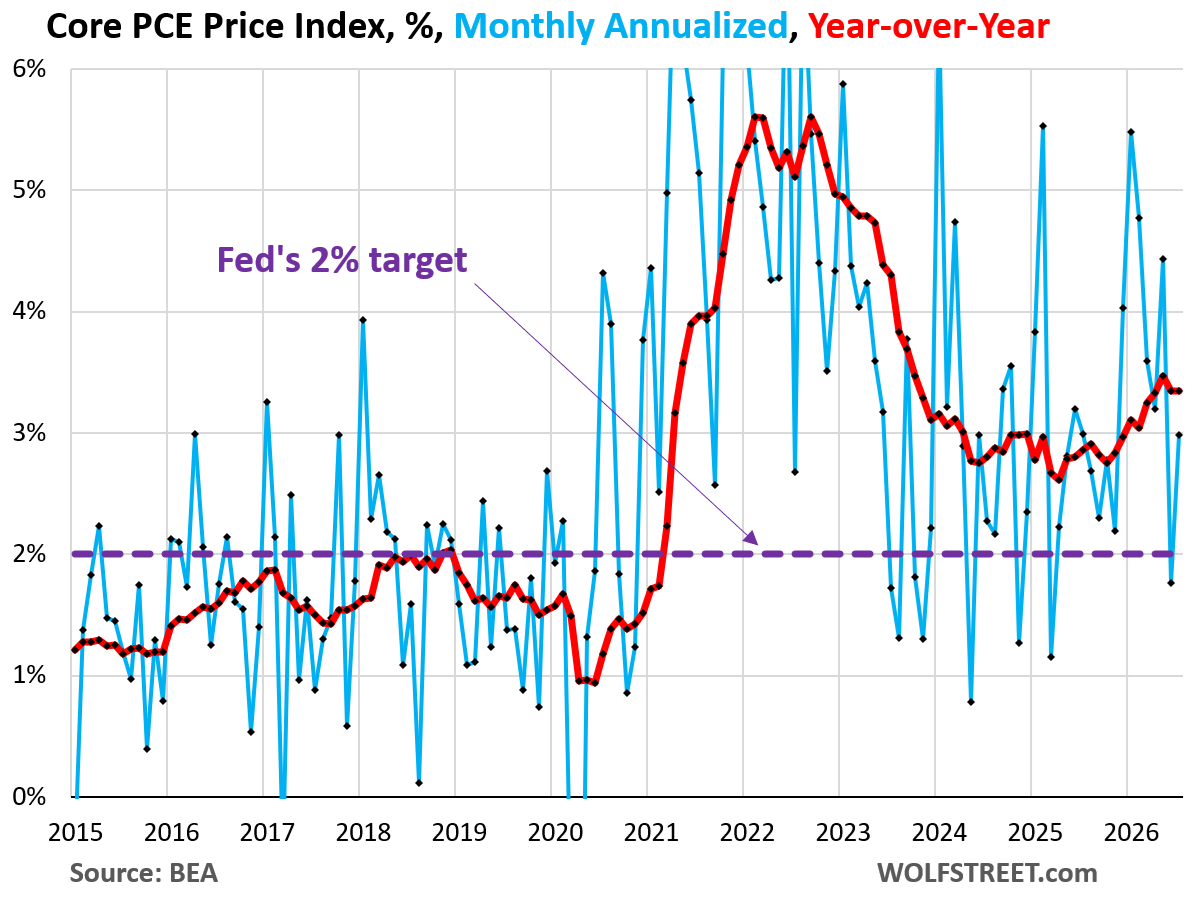
The Fed uses the core PCE price index as one of the yardsticks for its 2% inflation target (dotted purple line); it allows the Fed to “look through” an energy price spike and the subsequent energy price plunge.
The core PCE price index has been above the Fed’s 2% target since March 2021, and never got even close to the Fed’s 2% target. It bottomed out at 2.6% in April 2025 and has been moving away further from the 2% target ever since.
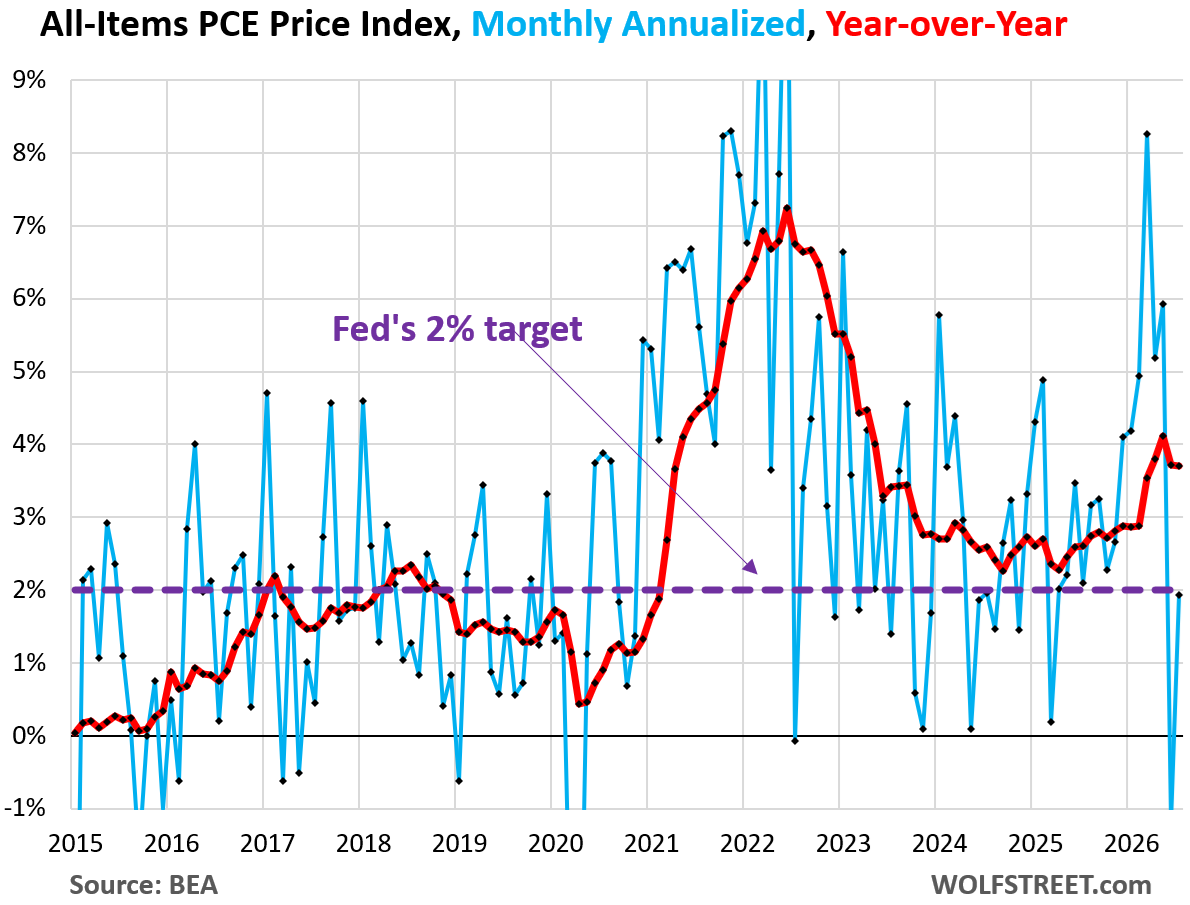
The all-items PCE price index – the other inflation index used by the Fed as its inflation yardstick – rose by 0.16% in July from June (+1.9% annualized, blue line in the chart below).
Year-over-year, the PCE price index rose by 3.7%, same increase as in June. Inflation in the five months of March through July was the worst since March 2023 (red line).
By this measure, inflation is nearly double the Fed’s inflation target of 2% (dotted purple line) and has been moving away from the target since May 2025.
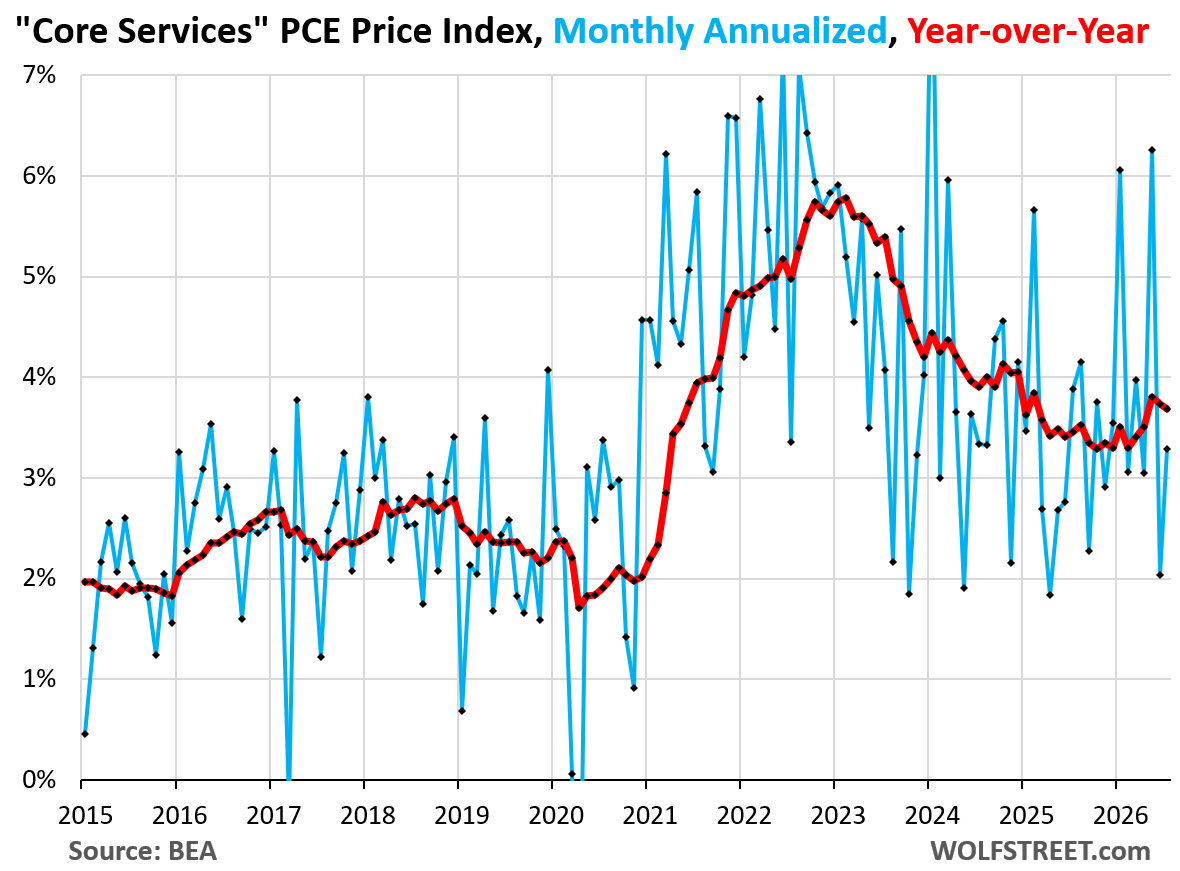
The “core services” PCE price index rose by 0.27% in July from June (+3.3% annualized, blue in the chart below).
Year-over-year, the core services PCE price index rose by 3.7%. May, June, and July – all in this range – showed the worst increases since February 2025.
Core services account for over 60% of consumer spending. They include rent, healthcare, travel, lodging, transportation services (such as airline fares), insurance of all kinds, auto repair and maintenance, subscriptions of all kinds, financial services, etc. It’s where inflation is tough to battle because a lot of core services either lack adequate competition that consumers can leverage, or are difficult or impossible to shop around, such as healthcare. Companies that are confident they can raise their prices without losing customers, raise their prices, and consumers wail and gnash their teeth but pay them.
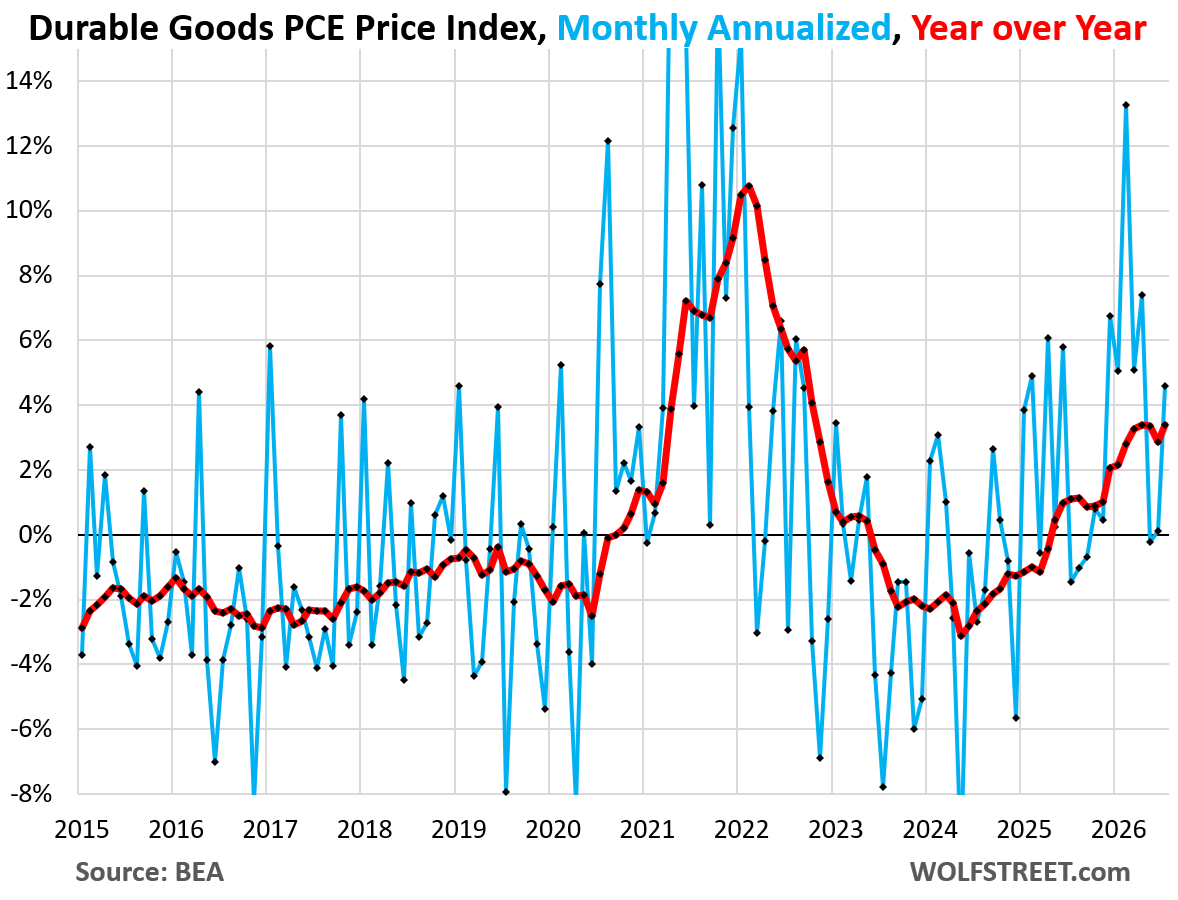
The durable goods PCE price index jumped by 0.37% in July from June (+4.6% annualized) and by 3.4% year-over-year.
A number of goods categories saw falling prices year-over-year, with some categories coming off the price spikes last year, and many had modest price increases.
But two categories experienced sharp price increases recently:
- Information processing equipment (computers, tablets, accessories, software) spiked by 1.4% month-to-month (+18% annualized) and by 15.5% year-over-year. It started suddenly in December. Over the past eight months, the PCE index for this category has spiked by 22%. This is where AI is exacting its pound of flesh directly from consumers.
- Jewelry and watches spiked by 2.0% month-to-month (+27% annualized) and by 14.8% year-over-year, as the years-long spike in gold prices is gradually getting passed on to consumers.

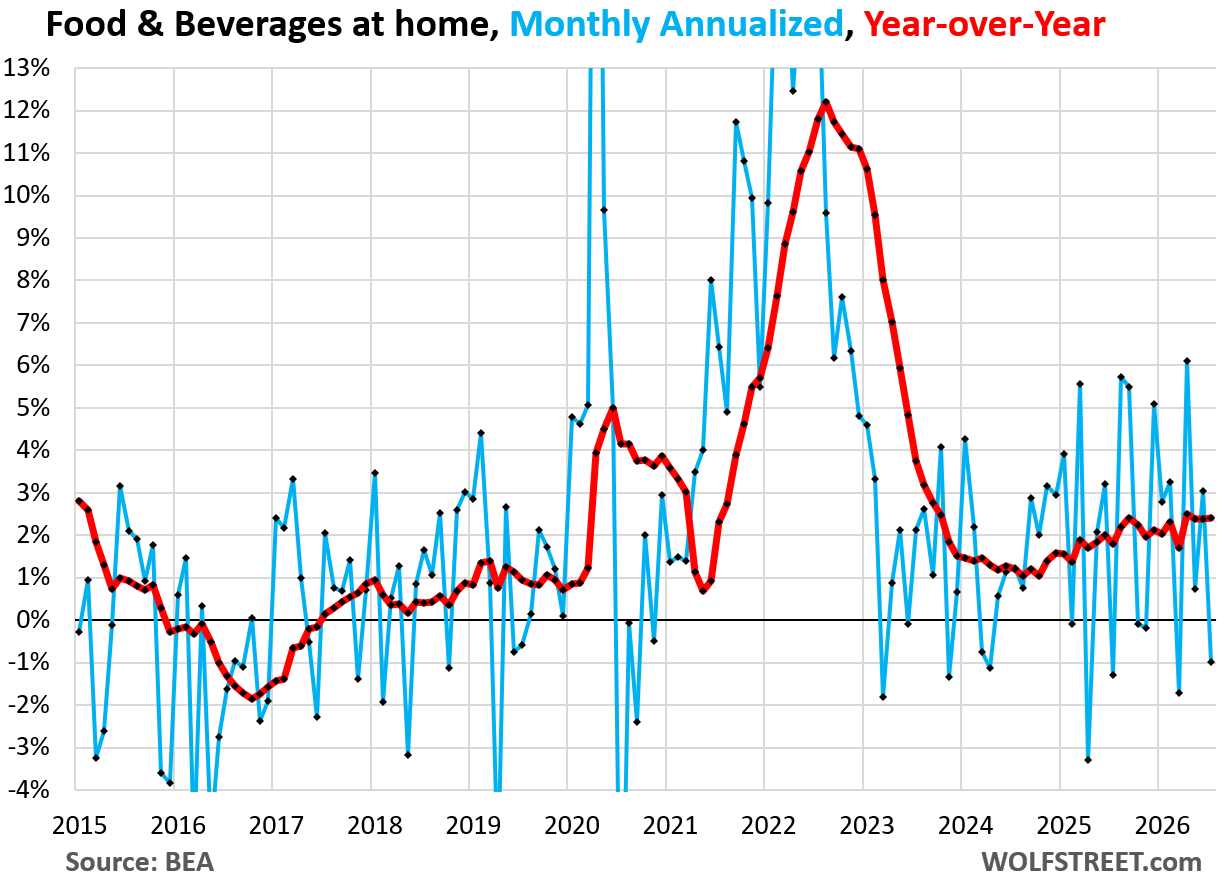
Food prices edged down in July, after the jump in June. Year-over-year, the index rose by 2.40%, the highest in three months.
Many food categories experienced price increases, and many experienced price declines. Egg prices fell further, continuing to unwind the avian-flu profiteering spike. Beef prices seem to have topped out and have begun to edge down. Coffee is still climbing up the spike. Sugar and sweets continue to head higher, as is fresh milk, and fresh seafood. Poultry and pork declined month to month and were roughly unchanged from a year ago.
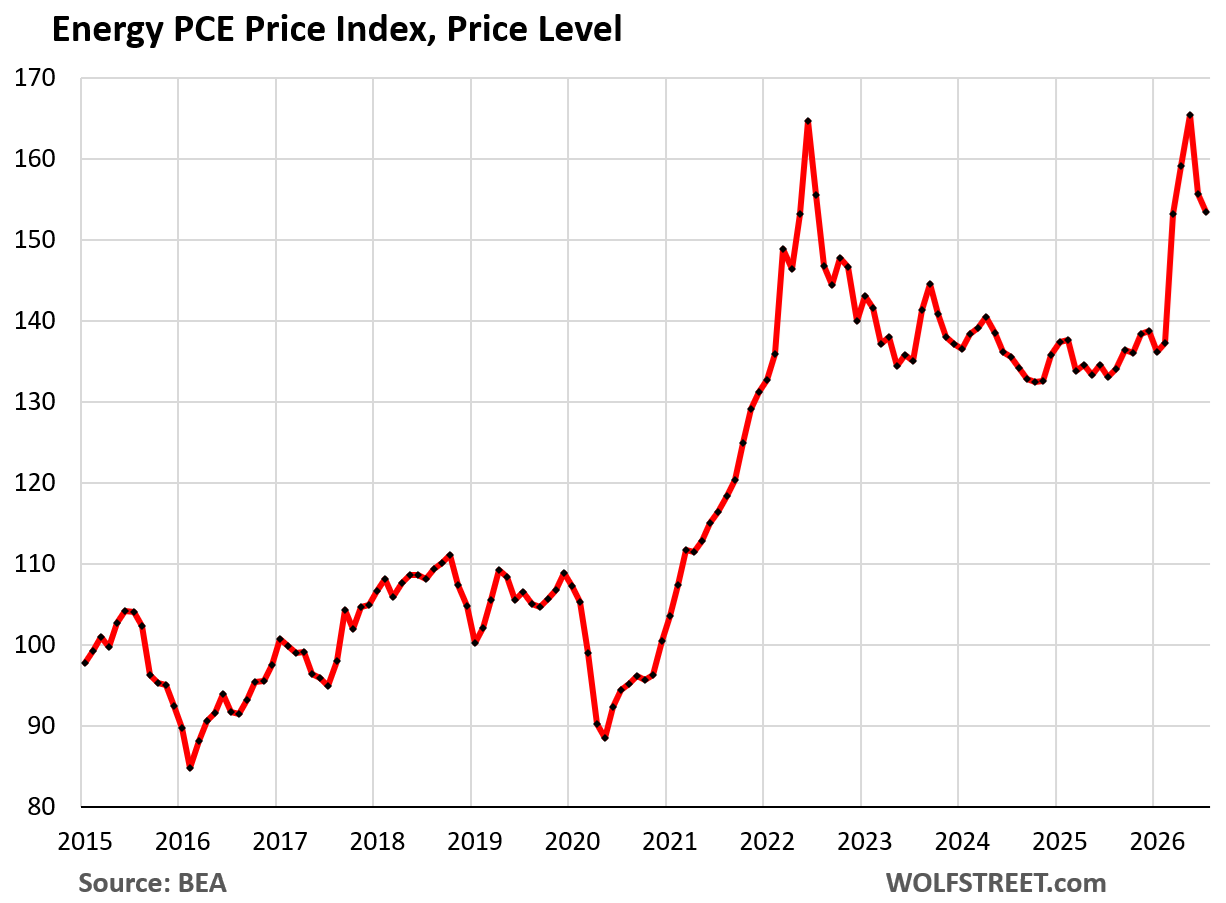
The energy PCE price index fell by 1.5% in July from June, the second month in a row of declines, after the spike in the prior months.
Year-over-year, the index was still up by 15.3%. Within it, the gasoline index was still up by 25% from a year ago.
This chart shows the price level, not the year-over-year percentage change.
Enjoy reading WOLF STREET and want to support it? You can donate. I appreciate it immensely. Click on the mug to find out how:


Thanks WR for this.
I wonder if FED takes a note of this, and hike rates or treat it being transitory!
I agree with FED as nothing in permanent in life /s
They are going to “look through it” to avoid raising rates. They will do anything but what they should do.
Have no fear!
The inflation hawk KevWar has hired a committee to help the committee figure out what to do about inflation. Results of the committee’s committee should be out in 4-6 months. Then the committee can begin to debate.
Am I making sense? If so, get your head checked. If not, buy gold.
I’ll say it again, it’s the summer of 73 again, the second wave of inflation is just getting started…
…this time with 40 trillion in debt to service.
Go ahead Mr. Warsh, raise those rates and reduce that balance sheet!
I triple dog dare you!
LOL!
Paul Volcker eventually killed inflation with a 21.5% prime rate.
That’s not how it went. My professor was flown on the corporate jet to meet with Paul Volcker in 1980. What stopped inflation was the introduction of reserve requirements on NOW accounts in April 1981.
The widespread introduction of NOW accounts propelled N-gNp to 20.1 in the 1st qtr. of 1981.
Due to Volcker’s operating procedure (which hasn’t changed since Paul Meek’s (FRB-NY assistant V.P. of OMOs and Treasury issues), described in his 3rd edition of “Open Market Operations” published in 1974.
Volcker targeted non-borrowed reserves when at times 200 percent of all reserves were borrowed. One dollar of borrowed reserves provides the same legal-economic base for the expansion of money as one dollar of non-borrowed reserves.
The fact that advances had to be repaid in 15 days was immaterial. A new advance could be obtained, or the borrowing bank replaced by other borrowing banks. That’s before the discount rate was made a penalty rate (Bagehot’s dictum). Monetarism has never been tried.
Probably more of a combination. Things got tight. And then the double dip recession killed the inflation.
“ workers stopped demanding big raises to keep up with expected inflation, businesses stopped raising prices preemptively, and inflation expectations (which had become self-fulfilling through the 1970s) finally deflated. (THEN) High unemployment did the work directly.”
What was their excuse back in ’73? Was the relationship between interest rates and inflation understood differently than today, or something else? As a school kid in the 80s, I remember being taught that this “stagflation” was due to the oil shocks, but I imagine that was over simplified.
In ’81 my 7% mortgage went to 18%. Luckily I obtained private financing as the savings spread was a joke. They were pleased to get 10% from me for the mortgage. I finally sold and moved away for employment and barely broke even…. as RE prices collapsed. All my renos got the house sold, but I didn’t make one cent for my labours. Nada.
People call for drastic rate hikes, and we would do fine in our family as we are savers, but millions in NA would lose their employment and everything they have worked for. In today’s angry climate it would not go well.
This US debt level will have a day of reckoning. If addressed now the economy could simply grow past it over time, but people can’t agree on what day of the week it is, let alone on policy changes. I believe individuals need to be prepared and control their own debts, whether or not you are in a sweet 30 year arrangement or not. You lose a job and your assets decline in value….it ain’t fun. It is only bearable if everyone else is in the same boat, and that won’t be happening, imho. Politicians are picking winners and losers it seems.
IMHO, a lot of that inflation was related to the Viet Nam war (we had something like 540,000 soldiers there at one point). Wars are a good way to destroy a fiat currency.
If I live long enough, I expect to see interest rates hit 20% again.
Having lived through the 70s inflation and Arthur Burns catering to Nixon, the situation today is even
Worse because of the partisan control of congress and a Fed that cannot put on a pair of Volcker big boy pants.
My professor used to read his correspondence with Burns in class. He called him arrogant and ignorant.
Agreed, nearly nobody in DC has got anything approaching Big Boy pants.
Massey was the only guy willing to die on the anything fiscally responsible hill, but that put him on an island and directly in the crosshairs of TACO.
Well, it didn’t work out well for Massey.
Are those inflation times and these inflation times comparable?
I dunno.
We’re def getting crushed now. The extra amount that I do not put into savings is quite large. The amount that goes to higher prices and a lot of times these higher prices have zero reason to be high except greed.
Also the mental gymnastics one has to do these days just to squeeze out a few thousand dollars savings over the year… they are draining.
Health insurance here in NC is about to increase 17.9% too for 2027.
Greed greed everywhere.
It isn’t all greed. It’s math, physics and geopolitical crap impacting the supply side.
Think of it this way, when you have 8+ billion people all competing for a better quality of life (which requires energy and real commodities) then you know for a fact that there is plenty of demand for real stuff and the power/energy to deliver it as well as build/innovate and keep the lights/heat on.
Unlike issuing debt or “creating” currency, all this real stuff cannot be summoned into existence with a few keystrokes. All things being equal, the same liquidity is chasing fewer real things. Disrupting supply chains makes this worse.
Hedge accordingly.
I’ve never understood these comments about “greed”. Capitalism literally isn’t possible without each party attempting to maximize their own utility.
Exactly. What is the “price” of something that you want, but that no one is willing to sell (even if they have it in stock)?
So – question- why is the 2% target a target at all? Feeling 3% is the new 2% best. Arbitrary numbers are well just that. Prices up staying up spending remains solid debt seems controlled???
Well whatever the inflation target is, bonds need to be priced above it to provide a return to investors. Setting it to 3% would have repercussions throughout the bond market.
If it’s 3%, fine, but then they should be honest and say so, shouldn’t they? Or if there’s no target, or a floating target, or a secret target, or a target of “reasonable and prudent”*, just tell the public that there will be no fixed numeric target. How does that sound?
* “Reasonable and prudent” was literally the daytime highway speed limit in Montana for a brief period in the 1990s, and in an earlier era before the 70s era national speed limit. In its second iteration, it didn’t last. Too many drivers couldn’t handle the lack of a numeric limit.
There shouldn’t be any inflation at all. It shouldn’t Exist. It’s a tax on people because they created a flawed monetary system. The money supply should ALWAYS be fixed.
That would cause an intolerable slowing in the economy. There are many oligopoly, monopsony, and monopoly elements in the economy.
We necessarily have regulated capitalism, not laissez faire capitalism.
Wouldn’t money supply need to be fixed on a per capita basis? Otherwise money supply technically shrinks or expands as pop. rises and falls.
Then there is the separate need for large capital amounts for infrastructure level projects, defense, etc and not sure fixed money supply works for that
@Jonny,
Agreeing with the other replies to you, I’ll add that you’d also have to outlaw fractional reserve banking, and maybe any lending of money, to accomplish what you seek.
Suppose I lend you an ounce of gold, and you give me in return a promissory note for one ounce of gold. Now you’ve got a full ounce of gold, and I’ve got a piece of paper that has some value, maybe more or less than an ounce of gold, depending on your creditworthiness and the interest rate (if any). So then we’ve created money, and no fiat money nor government printing is involved.
With a fixed money supply, the economy would return to going into a depression every few decades or so.
Inflation is only a tax on people who hide cash under the mattress, instead of spending or lending or investing it. Encouraging that kind of hoarding is what causes economic downturns to turn into economic depressions.
some people love to romanticize the past & forget the lessons it taught.
Prices rise and fall over time in primitive societies that don’t even use money, but rather barter. Fundamentally, inflation exists because we do not live in a static society.
“inflation for July than the CPI had done earlier this month. Energy prices were still up 15% from a year ago”
Anecdotal: where I live, Gasoline was around 4.19 in July. Today August 26 it’s 4.59 – diesel is worse. Gas has inceased by 10 cents every 2 weeks or so.
Of course, it’s near peak summer driving season, so maybe it goes down a bit as usual in October.
I wonder if Druckenmiller was short treasury futures and had to cover.
I doubt it, but it seems he was testing how well AI works for writing articles that get published in the WSJ.
Probably
It’s funny because it was written with AI the content of the article everyone is focusing on that instead of the actual points. Goes to show AI is definitely making people dumber.
why wouldn’t he? everybody is using AI to write papers, articles and blogs…….i know a few personally. i would never have known it, without them telling me.
I don’t blame him. He said he was kind of proud of himself for being able to do it. Too bad though. Because it sounded like AI, and I would have liked to read it in his own voice.
It’s very easy to tell when articles are written by AI. The big companies’ models have actually gotten worse in this regard recently, making it more obvious.
Imagine being proud of using AI to write something. Soccer trophies for everyone were just the start.
Still waiting for someone out there to care.
GDPNow St. Louis Fed shows 4.6 percent. Same as Atlanta Fed GDPnow.
The demand deposit vs. time deposit ratio has risen back to early 60’s levels. It is still rising. That is propelling the economy. It is the reason why there hasn’t been a recession.
GDPNow is all over the place, especially this early in the quarter with hardly any Q3 data… It’s just now getting July data. So I don’t put a lot of weight into it.
I would think time deposits would be easier than demand deposits for banks to use as loans. Demand deposits can fluctuate a lot and so banks need to apply them to liquid things like treasuries. A time deposit, like a 1 year CD, is more predictable and can be paired with a one year loan to a local business, for example.
So if the ratio of demand deposits to time deposits is rising, it means banks are becoming increasingly inhibited from making the sort of loans that help the economy grow. It also might mean there is more demand for treasuries – from banks – than there’d be in normal conditions.
Or maybe banks have just gotten better at selling time deposits.
It’s a bit more complicated as the propensity for demand deposits to be demanded under various circumstances is not accounted for. Think of the difference between a sub-$10,000 checking account held by a low wage worker vs $100,000 high yield savings account that is tied to a rate promotion that is only unlocked after the money has stayed in the account for six months. Both are demand deposits, but one is much more likely to be demanded over a six-month window.
LOL! Making banking/finance unnecessarily complicated is exactly how the banker/financiers built the current cabal that extracts real wealth from the people actually doing the work.
Eventually this “let them eat cake” system will fail, with the usual outcomes.
Hedge accordingly.
With Core services the largest driver behind overall rate of inflation, does the Fed have any knobs to tweak this area? Core services do not seem particular sensitive to interest rates.
It seems that until core services inflation is controlled more by consumers rather than the Fed. Until the consumers say “enough” or economic conditions dictate cutbacks in these areas, I don’t see how the Fed can do much to influence it.
The FED has lots of knobs and tools and buffoons and…..
Yeah his name rhymes with Porsche
If only I could tell my car insurance to stop going up. I shop around once a year and am not finding anything better.
The only ttue medicine to stop this growth is a serious bout of deflation.
Because of Bernankes QE and ZIRP,
Corporations gobbled up competition with cheaper than dirt money and the government went crazy with deficit spending.
Corporations were in control of prices from Covid on. Then along come tariffs, wars and the rest.
This country is in deep economic caw caw because of partisan leadership run by lobbyists and think tanks.
Thanks WR. The key phrase in this article pertains to services:
“It’s where inflation is tough to battle because a lot of core services either lack adequate competition that consumers can leverage, or are difficult or impossible to shop around…”
These things won’t be fixed by higher interest rates. They’re the result of years and years of negligence with respect to enforcing antitrust laws, and a corrupt healthcare industry that’s captured Congress.
“Inflation Refuses to Go Back into the Bottle“
What if the genie that has already come out of the bottle ends up being a Pandora’s box type situation? (After Pandora opened the jar (mistranslated over time as a box), all the evils, miseries, and illnesses of the world escaped to plague humanity, while only hope remained trapped inside.)
And on the global energy front, the Russian Federation has now become an energy importer and there is a severe energy crisis throughout, including in Moscow. Farmers across Russia have given up hope since there is no deisel to harvest grain for the foreseeable future. Russian grain exports to the wider world are shut down….export terminals are closed.
The Straight of Hormuz continues to be a serious choke point for the global economy.
What a cluster…inflation in the US, in my opinion, is totally out of control.
I can explan what the Fed is doing! Now that the Fed can “look through” or call inflation “transitory”, that adds a secret 1% to the 2% target rate. We’re at around 3% inflation, so no change but you’ll get some hawkish language so they can avoid raising rates.
Wolf, you mentioned in a previous post comment that one solution to the national debt is to reduce the rate of debt growth, then let GDP run hot to slowly reduce the debt-to-GDP ratio.
Assuming the rate of debt growth slows, is the level of inflation reported in this post what would be compatible with letting GDP “run hot”?
If part of the plan to address the debt is to let GDP run how, should we expect this level of inflation to be a part of that plan?
Here’s the comment I’m referring to: “No one needs to stop the deficits. They just need to bring the deficit’s rate of increase down and let nominal GDP run hot to where nominal GDP (+6.5% yoy in Q2) outgrows by a significant margin the growth of the overall debt, so that the debt-to-GDP ratio comes down over time. “
The debt and deficit are in nominal dollars (not inflation adjusted), so GDP growth (also nominal) needs to be bigger than the debt growth. Nominal (“current dollar”) GDP grew by 6.6% year-over-year in Q2; after growing by 6.1% and 5.4% year-over-year in the prior two quarters.
But the debt grew faster than that, so that’s the problem. If they can slow the growth of the debt by 2 percentage points (from around 5-8% year-over-year now) and increase nominal GDP growth by 2 percentage points, for years, that would make significant headway in bringing down the debt to GDP ratio.
I’m going to post my quarterly article on the US fiscal situation over the next few days, with all kinds of good data. So keep your eyes out for it.
2% short GDP growth: If the inflation target can be raised from 2% to 3%, then half of this debt to GDP problem would be solved. Exactly what the Core inflation graph looks like.
It seems much of the concern around 30 year bond yields going over 5% is more hype than anything. It seems like if the bond market was really worried the spread between the 10 and 30 year would not be virtually flat. It seems like magical numbers are invented like inflation over 2% or unemployment being too low and none of these manifest as expected in the economy. Is this a misread by me or just a product of the media circus we live in? After all, boring doesn’t get clicks. I’m not suggesting there aren’t systemic issues but it feels like a year from now everything could easily be materially the same, just with slightly different headlines and numbers. Maybe an app exists but this could be one use of AI although hardly want to drop the coin for Cursor and configure and maintain it all myself.
Monopoly:
Mr. Wolf writes: “…a lot of core services either lack adequate competition that consumers can leverage, or are difficult or impossible to shop around, …” This is the definition of Monopoly capitalism that President Theodore Roosevelt (the 1st President Roosevelt) talked of.
Yes, predicted for some time. Most people thought Marx and Engels were anti capitalist which is 100% untrue. They saw it as a necessary stage out of fuedalism. However, they also recognized it had to be a transitionary stage to something else as the nature who be a massive reduction in competition and of course the commodization of labor. Whether you agree or disagree with where it needs to transition to, I think most agree the current system doesn’t work. The US lived large post WWII given it wrote the rules and of course the European industrial base was destroyed. That is coming to an end and isn’t clear we have leaders that can write a new play book.
we need the FTC in Metropolis, like Superman.
I know everyone here hates inflation, but the fact is the U.S. government is up against the wall.
It can either (1) make policy restrictive, cut govt spending, cause a recession, and worsen the debt/GDP and debt service/tax receipts ratios, OR (2) let inflation and growth run hot for a decade.
If the government takes path #1, it could set off the sort of debt crisis seen in Argentina, Turkyie, or Russia. As the ratios and expectations get worse, yields could skyrocket. The depth of the recession(s) is hard to predict, and things could quickly get out of control if banks start failing or the prices of leveraged assets start tumbling. Pressure would build for the next bailout package.
Meanwhile the price of path #2 is 3-5% inflation for a decade. That is, faster wage increases and faster price increases to go with them. This path only really hurts bond holders or people with non-inflation-adjusted fixed income. Bond yields may or may not rise in such a future. Treasuries have historically spent many years with negative real returns, so it could happen again.
People can have different preferences, but I would very much prefer path #2. Millions of people get to keep their jobs with raises that track inflation, our investments don’t crash and stocks actually do well, banks stay solvent, no economic riots or kids going hungry, fewer suicides, and everyone with a mortgage and a job gets a nice tailwind.
Yes, the government needs to reduce the size of deficits, and yes our voting choices over the past 40+ years delivered us into this dilemma. We can gripe but that’s all water under the bridge.
We must accept that we are in the dilemma now. The tradeoffs are real and non-negotiable. I.e. you don’t get to say “well I want 5% real GDP growth, 0% unemployment, and 0% inflation” because that can’t happen. Get real. Then choose your compromise: #1 or #2.
So far, the FOMC and treasury are trying to pursue path #2, and though it involves lying about the long-foresaken 2% target, it is the best path to take.
I think this comment section leans toward #1, but be careful what you wish for. If you want #1 and we get it, I don’t want to hear the gripes about the completely foreseeable consequences!
Fed has failed terribly. Inflation has anchored well above 2%. And this is on top of heightened prices during the pandemic. The purchasing power of the lower/middle class has eroded. Inflationary mindset is settled. There is no point of return. Now people will think, if 3% is acceptable, what it is the problem with 4%? And then 5%? …. And it will spiral continuously.