
Spending on healthcare services, which blew by housing in 2023, continues to soar. But the big splurge on recreational goods & vehicles flipped this year.
By Wolf Richter for WOLF STREET.
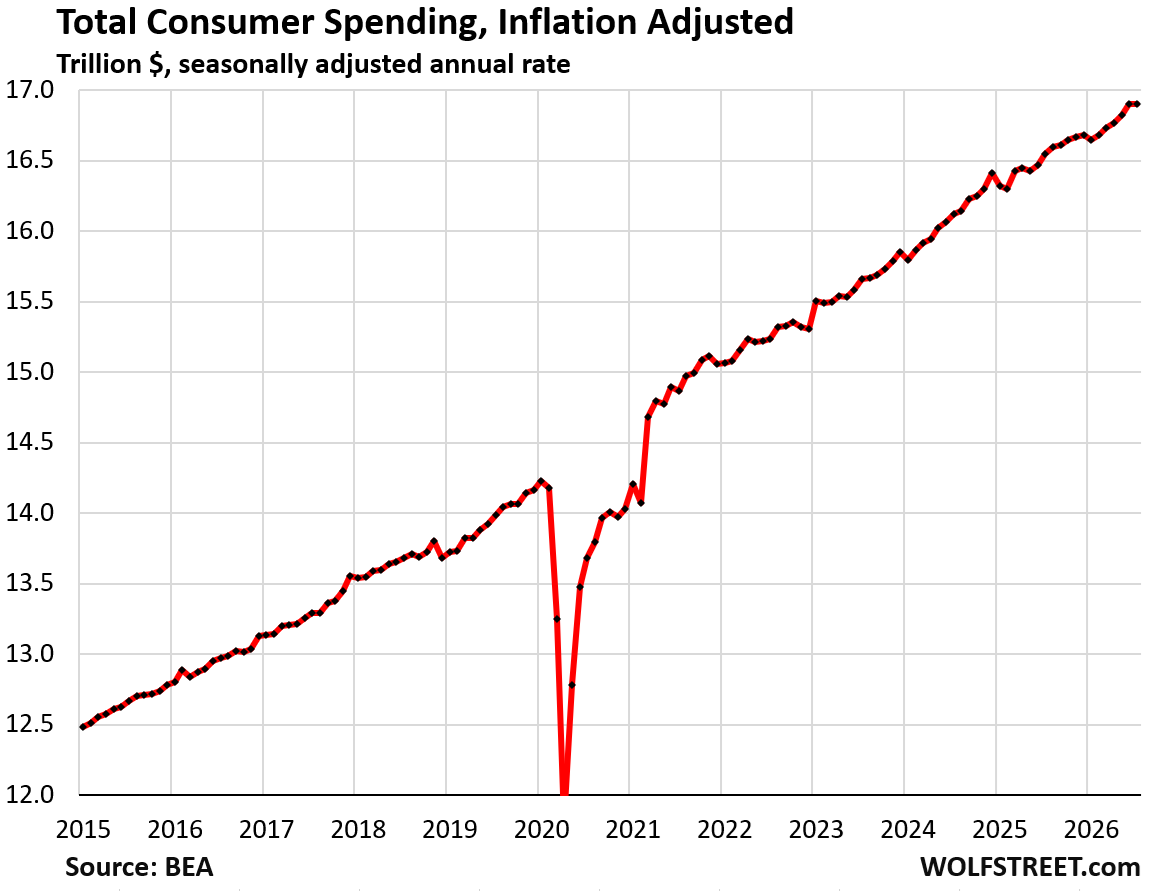
Inflation has been rough, rising by 3.7% year-over-year in July. But consumers – an amazingly hardy and resourceful bunch that nothing seems to be able to knock down – out-spent even this rough inflation. Consumer spending in July, not adjusted for inflation, jumped by 5.9% year-over-year. Adjusted for inflation, it edged up in July from June on top of the jump in the prior month, and was up by 2.1% year-over-year, according to the Bureau of Economic Analysis today.
Of the total amount spent, 66% got spent on services; 13% on durable goods (expected life span of over 3 years); and 21% on nondurable goods (expected life span of less than 3 years). Healthcare services (not including healthcare products) and housing costs combined account for over one-third of total consumer spending. That’s where inflation bites the most.
All figures here are annual rates, adjusted for inflation, and expressed in 2017 dollars.
But on what did this money get spent?
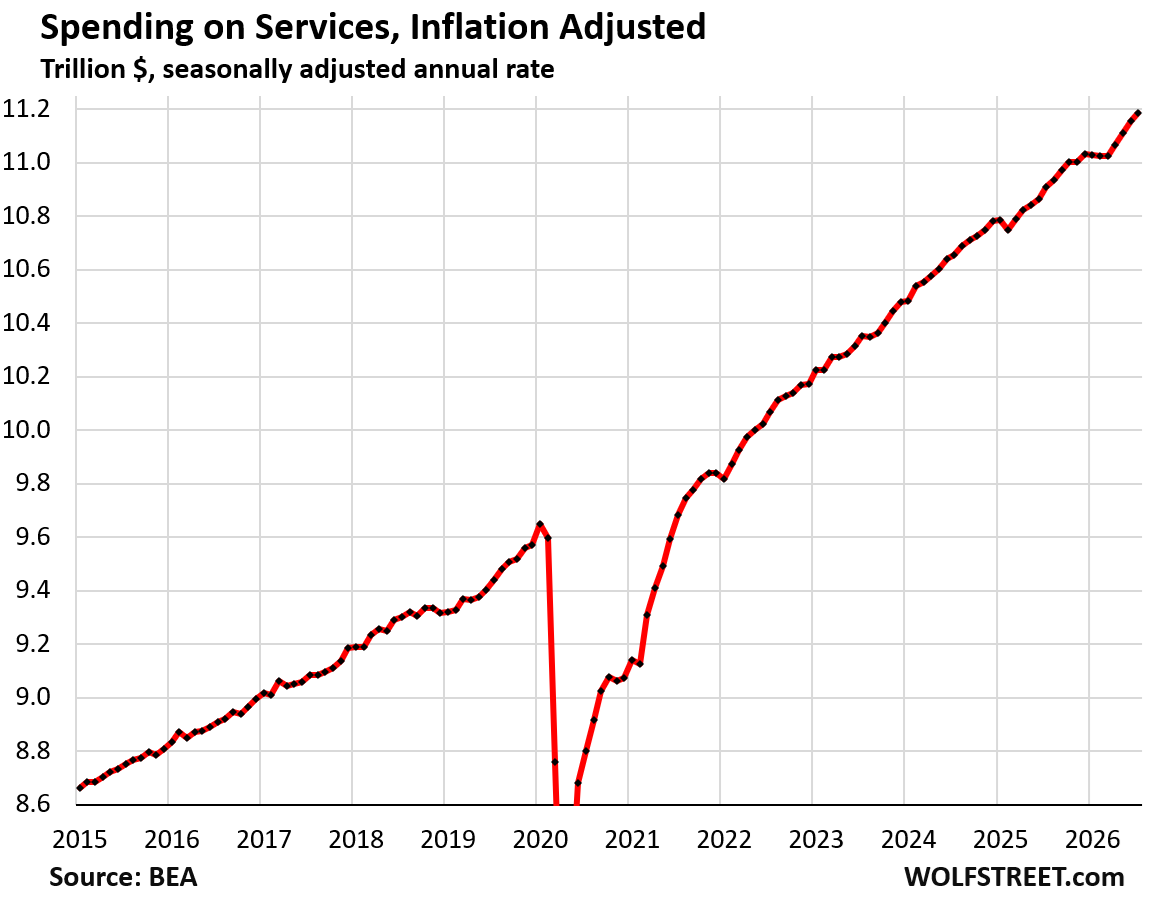
Spending on services, adjusted for price changes (inflation) in the specific services, grew by 0.29% in July from June and by 2.5% year-over-year. As we’ll see in a moment, spending on healthcare was by far #1 and spending on housing and utilities was #2, far ahead of the next categories.
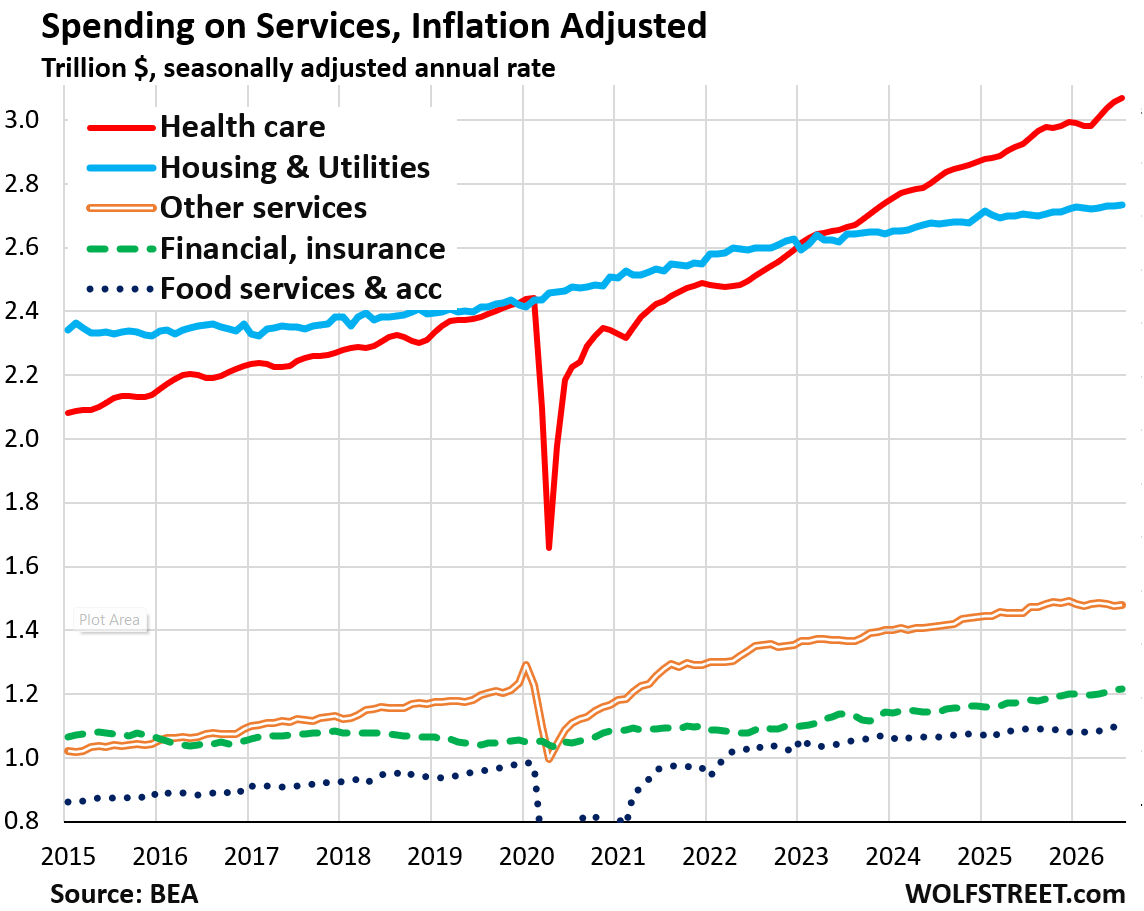
“Healthcare services,” which includes health insurance but excludes pharmaceutical products and other healthcare products, surpassed “housing and utilities” three years ago, and the gap has continued to widen. In July, healthcare services accounted for 18.2% of total consumer spending.
Housing and utilities accounted for 16.2% of total consumer spending. Combined, they accounted for over one-third of total consumer spending. It’s in healthcare and housing where inflation bites the most.
But these spending figures here are adjusted for price changes (inflation) in the specific services. So these are the spending increases after inflation.
Inflation-adjusted spending on services by major category:
- Healthcare services: +0.41% monthly; +4.2% YoY (red in the chart below).
- Housing and utilities: +0.15% monthly; + 1.2% YoY (blue).
- Other services: +0.23% monthly; +0.5% YoY (double gold).
- Financial services and insurance: +0.14% monthly; +2.9% YoY (big dotted green).
- Food services and accommodation: +0.36% monthly; +1.0% YoY (small dotted dark-blue).
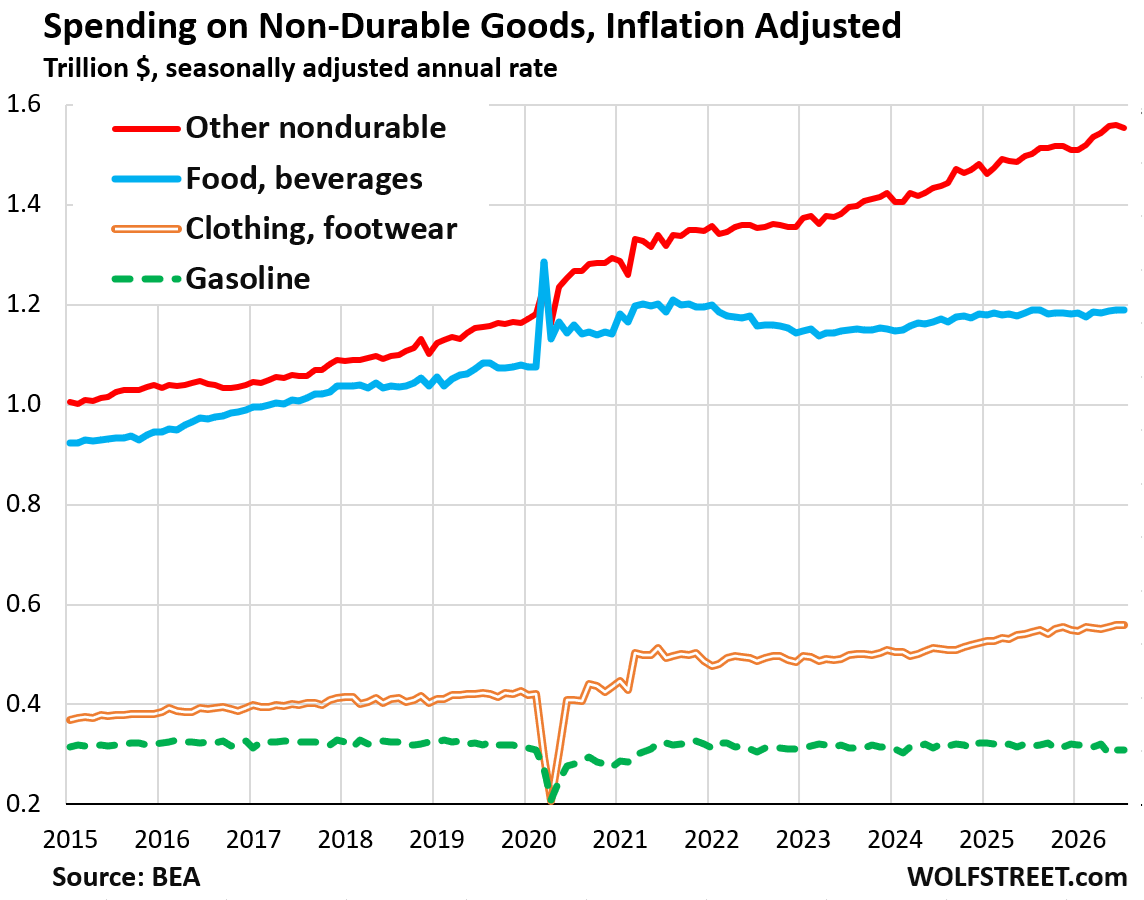
Spending on nondurable goods, adjusted for price changes (inflation) in those specific goods, dipped in July from June by 0.2% and rose by 1.4% year-over-year.
“Other nondurable goods” is the biggest category of nondurable goods. It is dominated by pharmaceutical products and medicines, including over-the-counter medications, medical products and supplies; games, toys, pet items, etc.; household supplies; personal care products; tobacco products; magazines, newspapers…
Spending on gasoline, adjusted for gasoline price changes (inflation), was slightly down, in part following the years-long trend of falling gasoline consumption in the US, as ICE vehicles have become more fuel efficient and as EVs have become a larger part of the national fleet. Measured in million barrels per day, gasoline consumption peaked in 2018 and has since fallen by 4.5%.
Inflation-adjusted spending on nondurable goods by major category:
- Other nondurable goods: -0.32% monthly, +3.4% YoY (red)
- Food and beverages: -0.1% monthly, no change YoY (blue)
- Clothing and footwear: -0.23% monthly, +2.4% YoY (double gold)
- Gasoline: -0.1% monthly, -2.5% YoY (big dotted green).
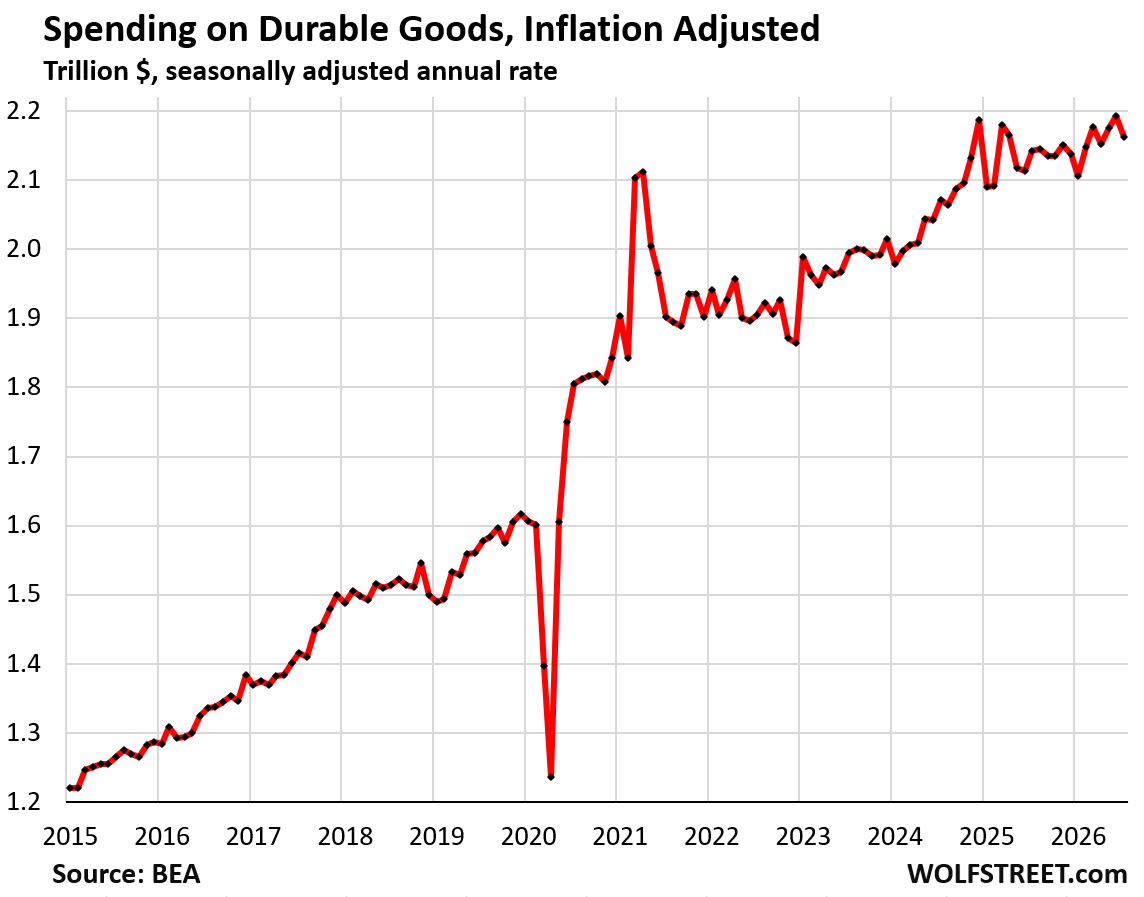
Spending on durable goods fell by 1.4% monthly, adjusted for price changes in durable goods (inflation). Year-over-year, it rose by 1.0%. This data is always very volatile month-to-month, as the jagged line in the chart below shows.
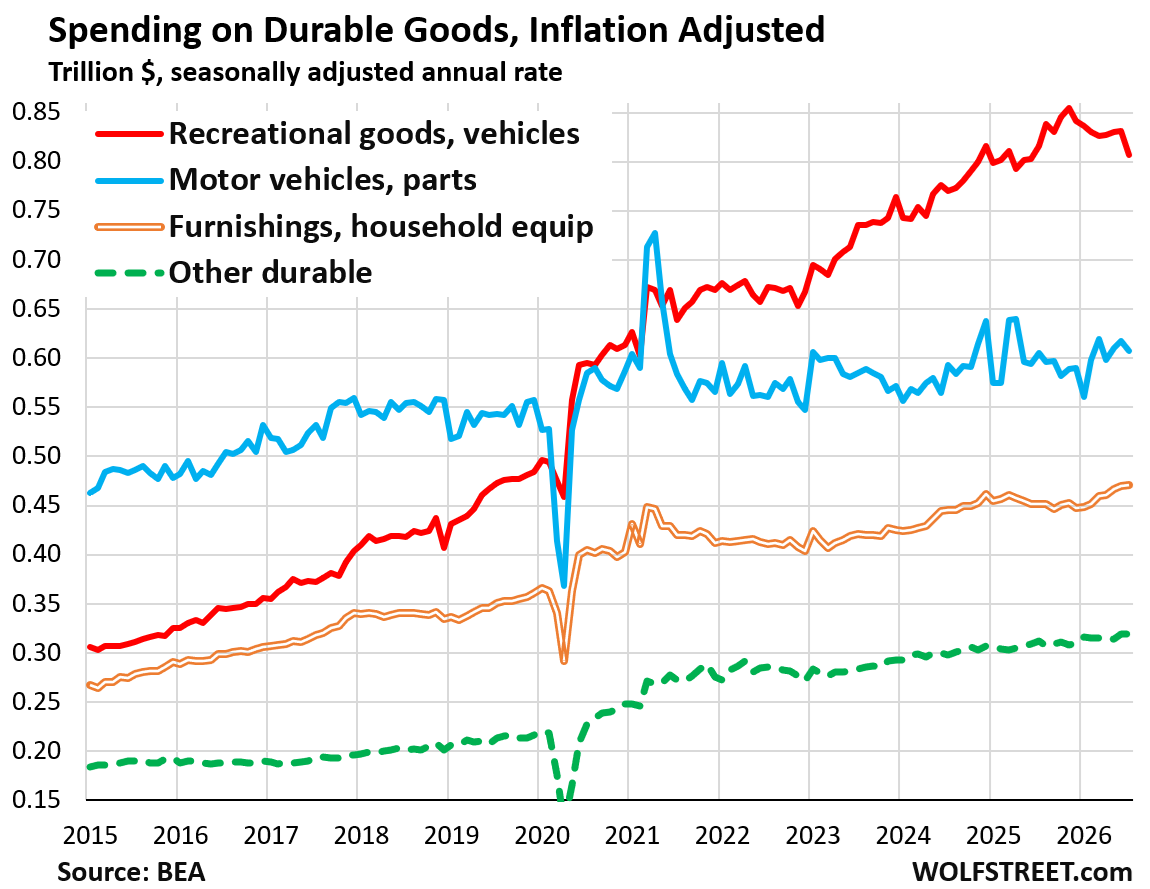
“Recreational goods and vehicles” – the stuff our hardy and indestructible consumers buy to have fun with – have become the #1 durable goods category, adjusted for price changes (inflation) in those products, surpassing motor vehicles in 2021. At the peak late last year, they accounted of over 5% of total consumer spending.
They include motorhomes, travel trailers, snowmobiles, ATVs, dirt bikes; video, audio, and photographic equipment; computers, tablets, and software used for entertainment; bicycles; hunting, fishing, and camping equipment; musical instruments; recreational books; and other stuff.

But after the enormous splurge on recreational goods and vehicles during and after the pandemic, spending peaked late last year and has since then fallen, adjusted for price changes (inflation) in those products.
The 5.5% drop in spending on recreational goods and vehicles since the peak in November, including the 1.4% plunge in July, adjusted for inflation, has been the big move in durable goods this year (red line in the chart below).
Inflation-adjusted spending on durable goods by major category:
- Recreational goods and vehicles: -2.9% monthly, -5.5% since November, -1.1% YoY (red).
- Motor vehicles: 1.6% monthly, +0.3% YoY, roughly flatlining for years after price changes (blue).
- Furnishings and household equipment: +0.17% monthly; +4.3% YoY (double gold).
- Other durable goods: +0.13% monthly; +2.2% YoY (big dotted green).
In case you missed it: Credit Card Delinquencies, Payment Volume, Balances, Debt-to-Income, Credit Limits in Q2 2026: Americans and their Plastic
Enjoy reading WOLF STREET and want to support it? You can donate. I appreciate it immensely. Click on the mug to find out how:


When “other” is the #1 subcategory, it makes me think they should split it up. Is that in the works? Other nondurable is huge
“Other nondurable goods” includes the subcategory of pharmaceutical products, medicines, over-to-counter drugs, medical supplies, etc., which has ballooned over the decades and has become huge. That wasn’t always so. These categories have been that way for decades, so it seems they should split them up. If I tried hard enough and dug long enough and hard enough, I could probably do it myself, but that wasn’t on the top of my priority list today.
Is that still a thing?
“photographic equipment”
Digital cameras? Lots of them out there, going up all the way to a Hasselblad X2D for $8k?
Photographic equipment is a requirement for some work from home set ups and the most obvious one is streaming.
What do companies like Stellantis do with massive inventories on hand while soon to be 2027 models running out? It seems like even with massive markdowns and other perks they can’t move them. Do they eventually just have to take a massive haircut at auction?
When Chrysler was doing that a half century ago I’d at least take a Cordoba with T tops off their hands.
Rolling out!
So the overall theme again is – “Affordability”
Not the toxic Dem-campaign word – But rather as prices creep upwards all things seemingly are “Affordable” for large chunks of consumers who spend/buy what they need/want despite the inflation- yes?
Carry On…
Just heard the GOP want to pass more tax cuts to support the economy
Rec vehicles spending is nuts. Something that sits in your driveway for 50 weeks per year? And then many consumers buy them on time. I often see adds about bi-weekly payments. Then the fuel to pull/drive them. And now camping fees are insanely high because there are so many vying for a spot. Around here there are $100K pickups pulling quad trailers, or in winter have the big rack to hold two snow machines. I remember as a kid our old smelly canvas tent we pitched in the middle of the Sierras, or on the beach. Now, you can’t find a parking spot.
The bright spot for rec vehicles? Many folks who did not plan for retirement now living in them. Some have pad rentals, others stop at rest stops or raft up in the bush. See them everywhere. Maybe this is the new retirement planning? And last, over time they are junk. They rot away. People can grab a beater for free and park them in the driveway for visitors to stay in. I have a neighbour who has done this. Free trailer, steal of a deal, it only leaks _____________
Remind me to decline that weekend invite to your place
Camping. That hit a nerve. My last TENT camping trip was a drive around lake Michigan. In the UP Michigan, on the lake there was about 35 sites. 30 for rv’s 5 for tents. NO tent sites on the beach. It was public, state or county.
I told the lady it was ridiculous. What about the peons.?
Beautiful country. I remember Bob Lake campground being practically empty when we pitched a tent in the middle of July 15 years ago. Houghton was half-empty too. So peaceful.
I don’t know why everyone everywhere seems to be traveling so much more than they used to, even in the damned boonies. It’s making life crappy for everyone, including the travelers. Wonder if it’s just an aspirational/cultural thing or a desire to escape our stressful lives.
Is employer-provided health insurance considered Health Care spending, or is it just out-of-pocket spending?
Yes.
Services, especially insurance are a major problem. As people are forced to chose between housing, food, and services. They will forgo any insurance payments. It really is a pain in the ass to constant have to look for better coverage and deals, but it’s what you have to do in order not to be taken advantage of.
I’m curious to know what tools you’re using to make such impressive charts.
Thanks. Excel to create the chart and texts in the chart; Paint to convert this into an image file that I upload to my server. Boomer tools (I was one of the early Lotus 1-2-3 users, on a machine running on DOS, 640K (!) RAM, and two floppy drives, old habits are hard to break) 🤣
You need to give your computer some ED medication to turn those floppy drives into hard drives. Floppy drives??!! I don’t think I’ve touched one in over 20 years! I thought they were extinct, but apparently just an endangered species.?
That was past tense (“I was one of the early Lotus 1-2-3 users…”), 40+ years ago, back when I was using Lotus 1-2-3. Lotus is long gone (IBM bought it and killed it), as is the boat anchor that ran it.
That’s all you need! Never change. I can identify your charts anywhere they’re posted on the web
And before Lotus, there was the Visicalc program. Lol
Wolf, Before I did Lotus 1-2-3, I cut my spreadsheet teeth on Execu-Plan on a CPM machine 😂
Healthcare is a huge problem. My retirement date might eventually come down to Healthcare of all things. Most everything else I have been able to successfully manipulate to keep costs manageable.
Prior to Obamacare, my health insurance was $400/month.
Under Obamacare my health insurance premium was $1,600/month in 2015 before I retired.
In 2016, Social Security deducted $400 for my Medicare and the supplement costs me $180.
Today SS deducts $600 and my supplement costs me $300.
Yep, healthcare is a significant number to include in your retirement decision.
Thank you for making the case for Medicare for all. Your total healthcare premiums today under Medicare are 40% lower than under (I assume) private insurance 11 years ago. Despite the fact that Medicare is required to cover everyone in the least healthy segment of the population, and private insurance can pick and choose whom they cover. Do you feel ripped off for having paid $1,600?
Wishful thinking, Ross. Let me tell you something a coworker told me almost 40 years ago about socialized medicine in his country of Czechoslovakia. He said “with socialized medicine, you get what you pay for – nothing!” He had witnessed it first hand.
I live in a country with socialized medicine and then help my mother with health care (Medicare) in the US. Let me tell you, the socialized medicine is much better, and I’ve never met a single person who has lived in both Europe and the US for any extended period that doesn’t prefer the medical system there. Rather, there are people who won’t move to the states for better jobs or whatever, just because of the mess that is US healthcare.
Honestly it’s prob just cuz you were old and not cuz of the affordable care act.
People 59-64 are the riskiest pool for insurers. Before they move on to Medicare.
There are two monstrosities in every household budget – housing and healthcare! Both ugly, both scary. Both out of control.
Don’t worry A concept of a plan coming to your town soon.
Touche’
Well they are busy designing sex checks for school kids who want to play JV volleyball. Priorities people!
Unless somehow you bought pre 2019 and refied your mortgage in 2021
Even if your bought pre 2020 you’re doing alright versus the suckers who bought after that.
inflation is eating the lunch. It’s ate your pudding snack pack, your PBJ and is thinking about your capri sun.
That lunch description brings back memories.
Bought a house in 2017 at 3.5%. Paid it off in 7 years because I thought the amortization schedule was a racket but didn’t really know anything about finances. Inflation does hurt less with a low cost of living relative to income, and low housing expenses really help.
That said, I should have refinanced in 2021 like you said and put my excess cash into investments.
Health insurance costs are a concern when I think about retirement.
How and when will it end?
Why does healthy spending and debt?
Just to provide context, the US GDP was reported as 31 trillion in 2025.
With total consumer spending reported (from chart above) as 17 trillion, the other 14 trillion have to come from government spending (heavily paralleling certain of the categories above), investment, and net exports (yeah, right…) – right?
It might be interesting to see all the GDP C+G+I+NE factors over time in a single chart as well.
You’re comparing nominal (not inflation adjusted) GDP to inflation-adjusted spending expressed in 2017 dollars, DUH!
Not inflation adjusted and in current dollars, spending was $22.2 trillion compared to $31.5 trillion GDP in Q2, annual rates.
In this article here about GDP…
https://wolfstreet.com/2026/07/30/red-hot-inflation-inflation-adjusted-strong-domestic-private-sector-demand-marks-q2-gdp-debt-to-gdp-ratio-dips-to-121-5/
… I gave you consumer spending, GDP, consumer spending as percent of GDP (69% in Q2), plus the other components of GDP, all with charts, all inflation adjusted, so you don’t have to concoct such conspiracy bullshit. I even gave you government consumption expenditures & investment as % of GDP. All governments consumption expenditures & investment = 17% of GDP. Federal government = 8% of GDP. And I gave you nominal GDP too. READ it all the way, every part of it, and recant your BS.
After inflation devastates what is left of my already overtaxed paycheck, I have very little to donate to Wolf Street. 🫤😫
Does clicking on the ads help?
Do NOT click on the ads to help me PLEASE. I will get dinged for click fraud. Click only on ads if you’re interested in what the ad is offering.
The Ass reaming continues
I dunno how the retirees are even surviving if hard working earners are struggling.
Guess they don’t need as much.
1. Brother, there are two types of retirements. Government and other ones. Government types will be comfortable (Feds or state). imagine buying a small pacific island.
2. When cobalt landed first in America, he saw another type of retiree. A 70s white man driving the bus. To this date, I wonder for whom he was driving that bus. Because, I saw him the next day in Walmart (A small town)
3. If I get a massage, where does this show up in inflation. Health care services indeed.
4. Lotus 123. Man I need to grow up and move to some younger people forum. Gorilla mindset investments.
If someone has money for a massage then you are doing pretty pretty pretty good as Larry David would say.
I gave up every kind of personal service one can give up short of dentistry. And that is such a nickel and dime racket these days that I only go once a year.
I swear dentists think they are going to change your life for the very small sum of 5 grand. Just say yes to what’s hurting, and even then give it 5 years. Haha, I kid.
I once had a dentist tell me three bottom teeth needed fillings. By the third visit of just ignoring the warnings, they just said those teeth no longer needed any care.
straight up profit for that dentist. Just make up who needs what!
There was zero about “struggling” here and lots about “spending” and how they outspent inflation.
Many retired people I know are doing quit well due to hard work, frugal living, hard saving, and wise investing during their working years.
Many also have part time jobs or start small businesses after retirement from their main career.
Not because they need the money, but to keep their mind and body sharp. This also adds to their income stream.
If CPI numbers are not accurately accounting for health care inflation, as has been covered in previous article here, would you not expect health care spending that has been adjusted for inflation to spike?