
A wild ride across Europe’s very different housing markets.
By Wolf Richter for WOLF STREET.
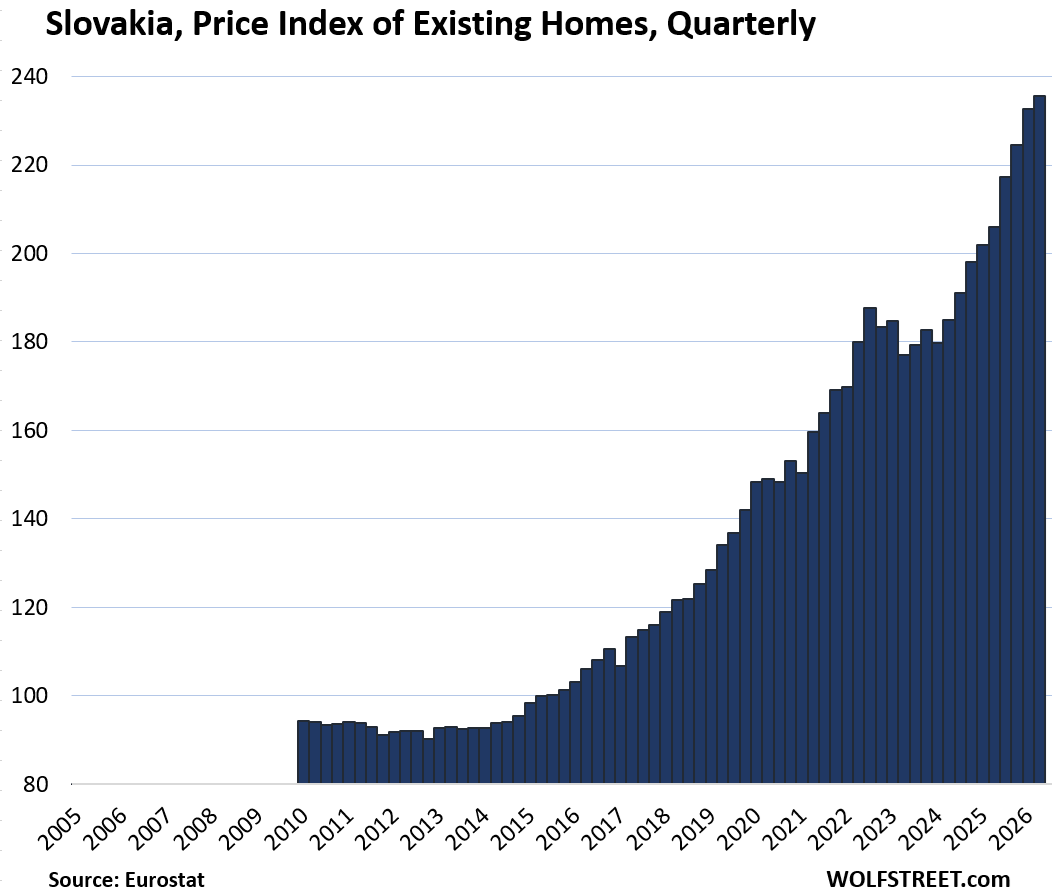
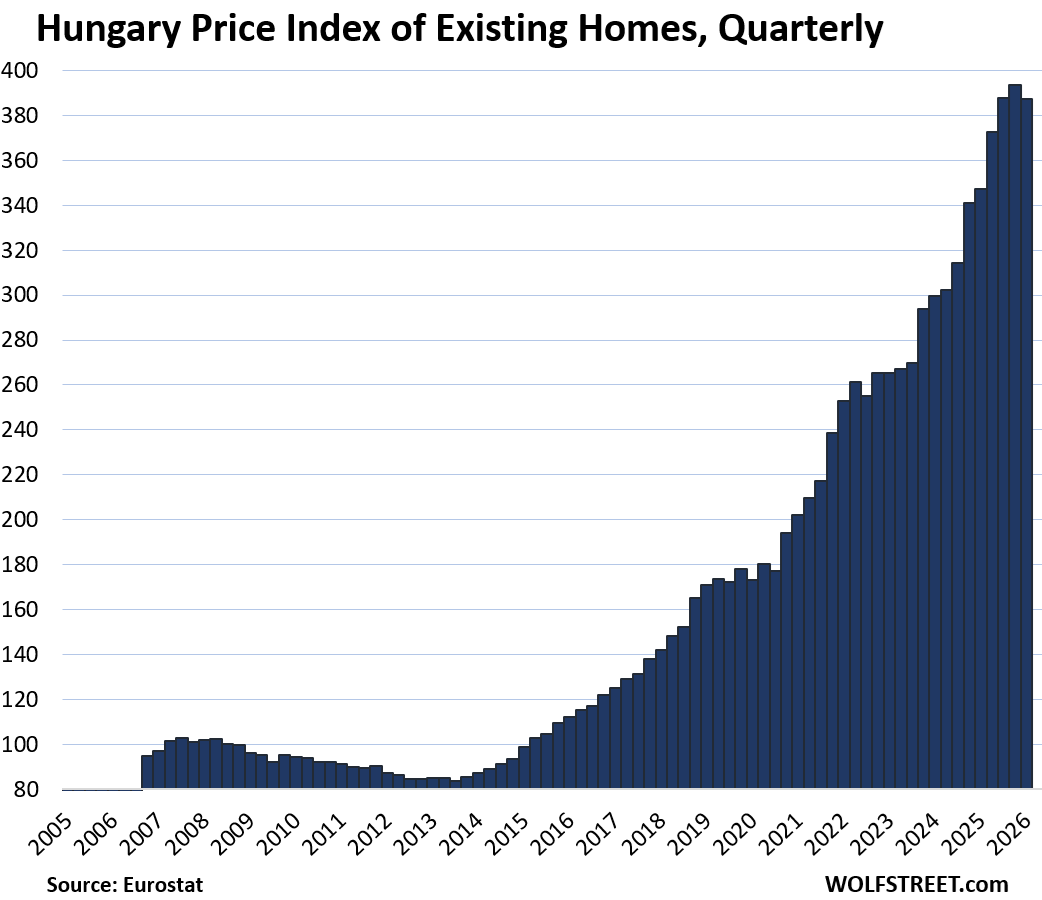
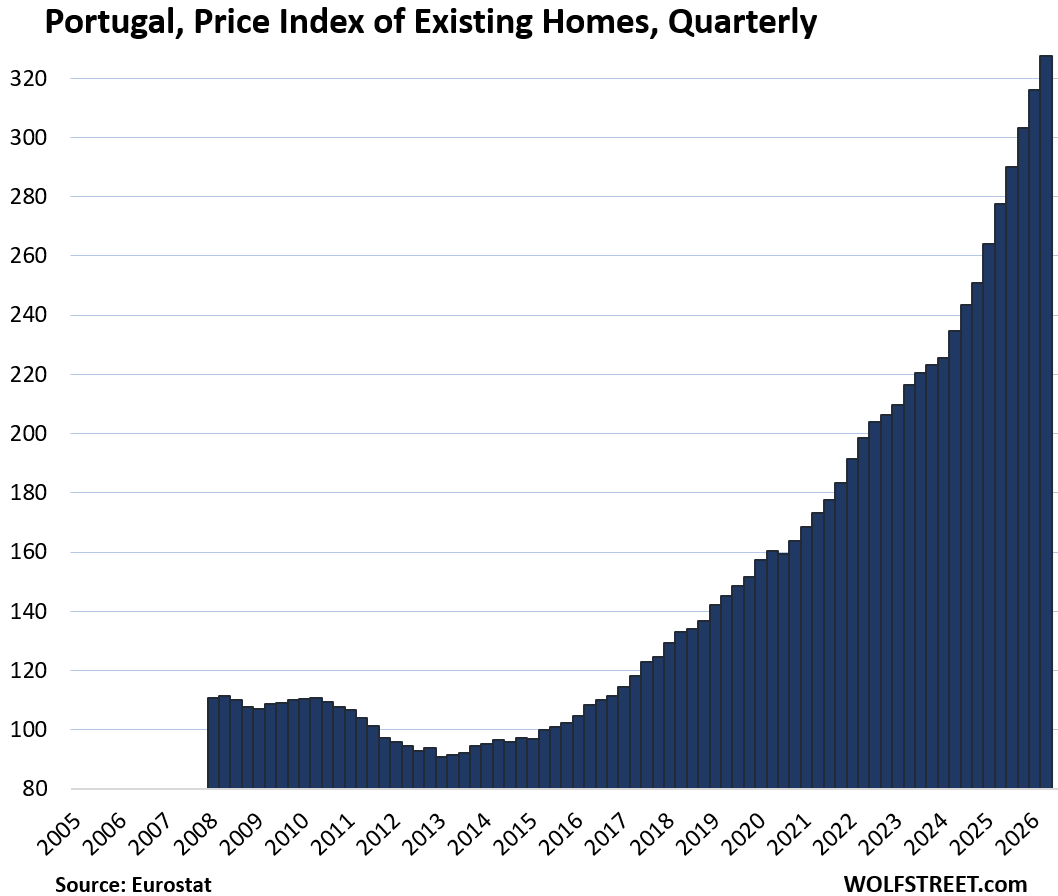
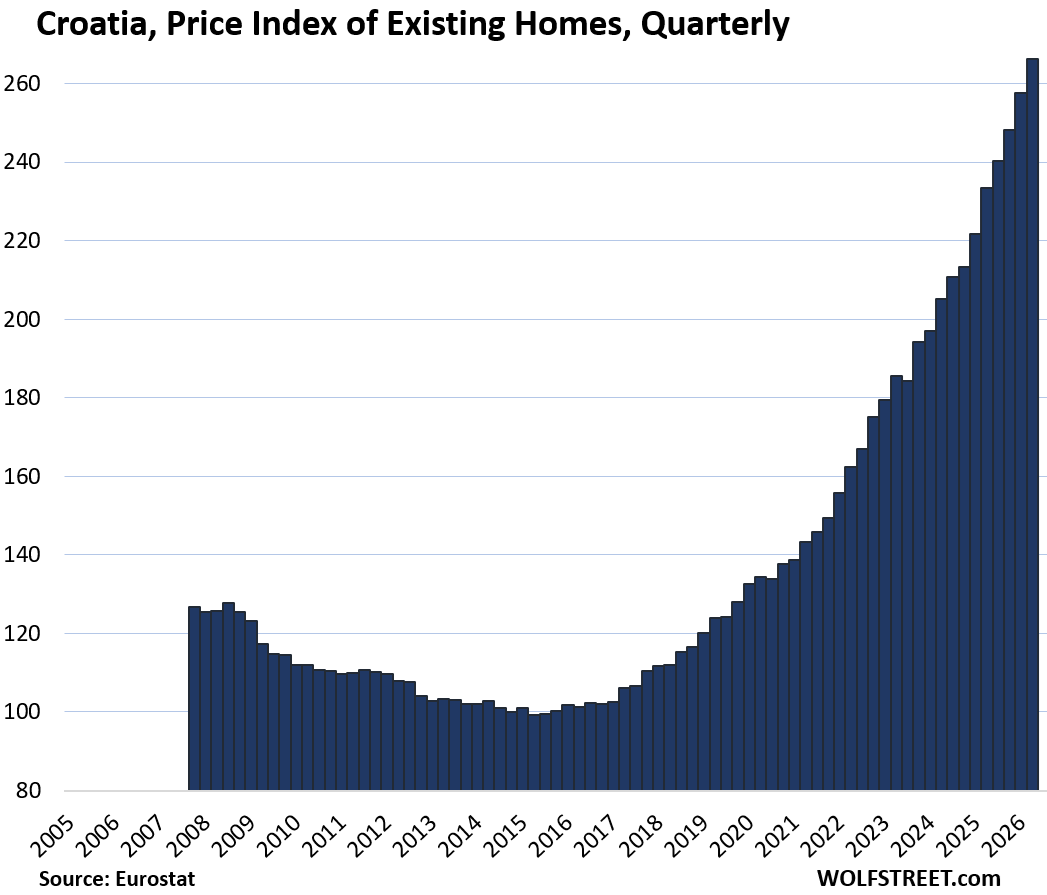
Prices of existing homes continued to explode in a number of European countries, led by Portugal and Bulgaria with 18% year-over-year gains, followed by Slovakia and Croatia with 14% year-over-year gains, according to new data from Eurostat through Q2 2026. Prices in Hungary have soared by 307% since 2010.
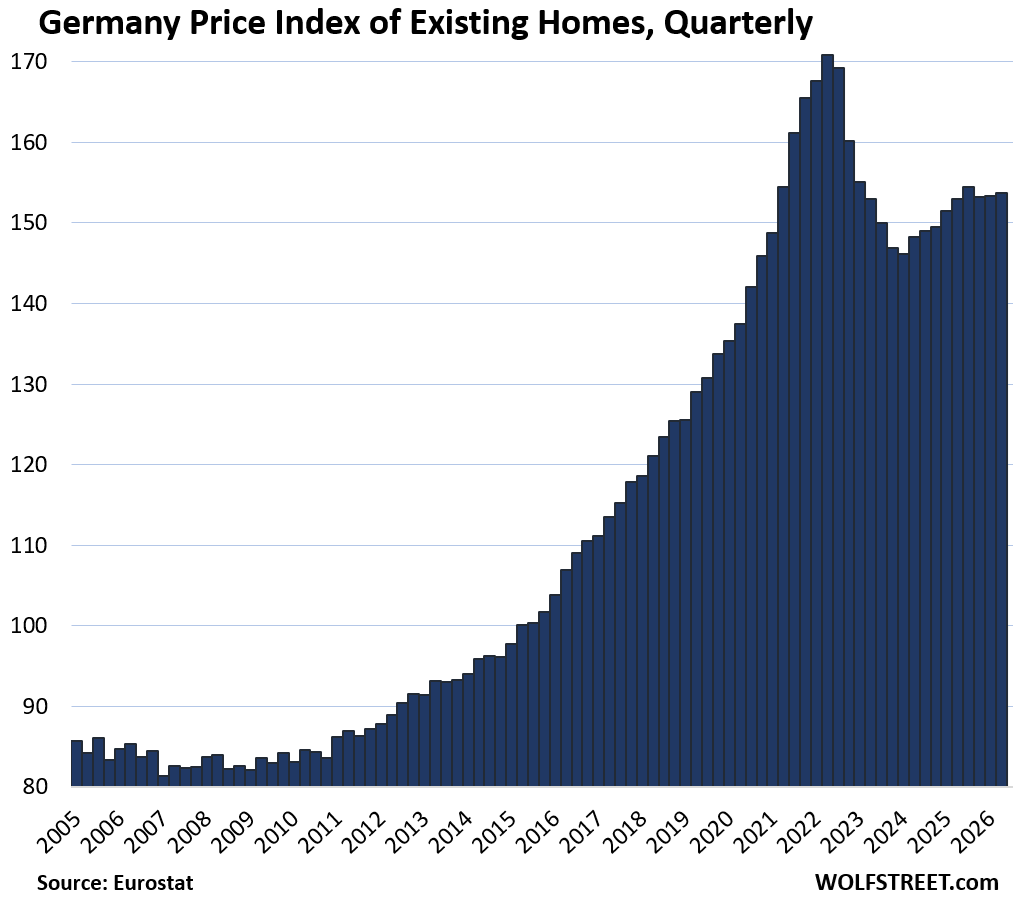
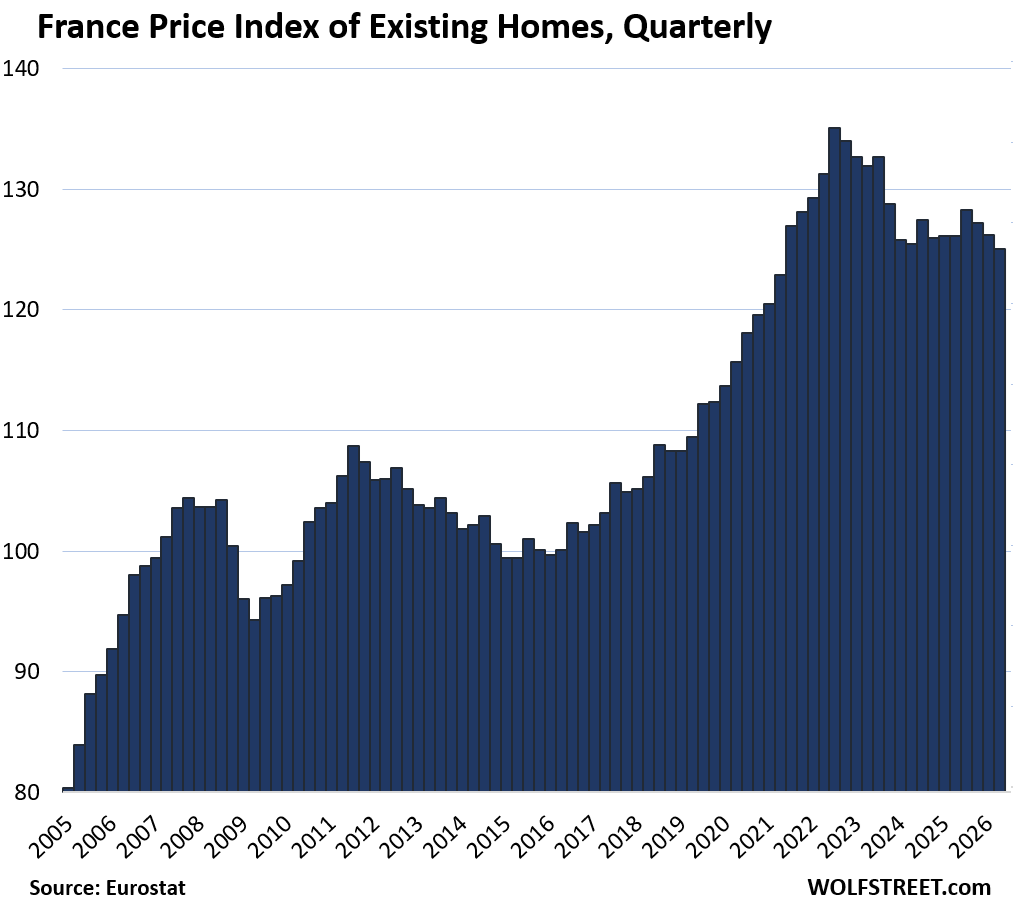
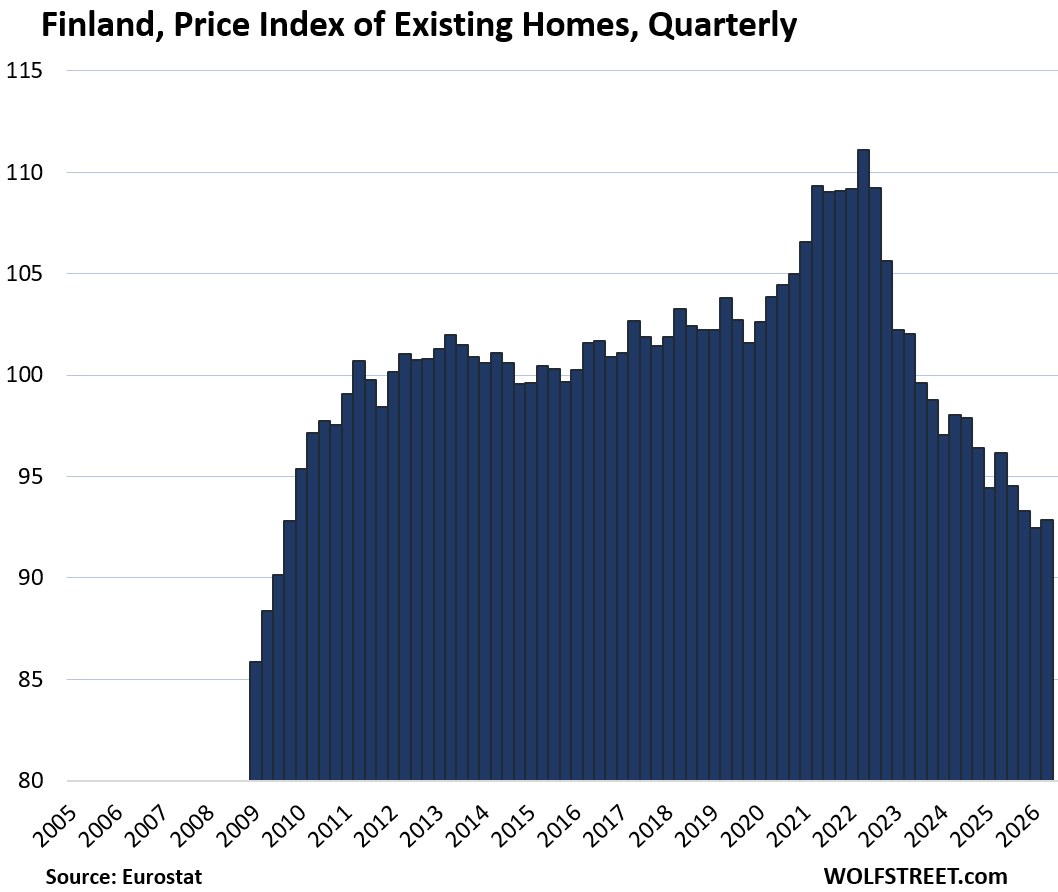
But in several other countries, prices of existing homes have dropped from their highs reached years ago, including in the two biggest markets Germany and France. In Germany, prices have stabilized at Q2 2021 levels for the past five quarters. But prices in France have been deteriorating again for the past three quarters. In Finland, prices have dropped by 16.5% from their high in Q2 2022 – since Russia invaded Ukraine – to where they’d first been in 2009.
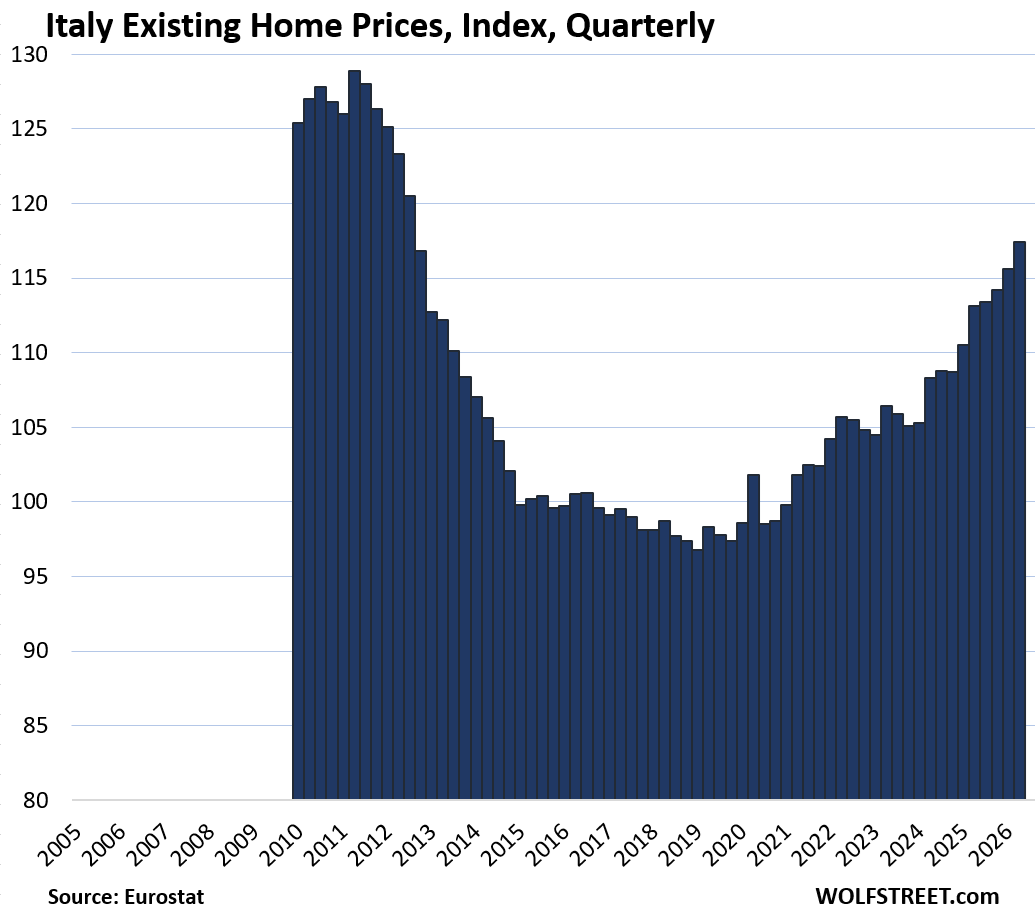
In Italy, prices have been soaring for years, but are still 9% below the levels of the prior housing bubble which imploded starting in 2011 during the Euro Debt Crisis.
Some of these countries are huge favorites for foreign buyers from other European countries, from the US, from China, and from Russia.
But Greece is missing from our wild ride across the 20 largest housing markets in Europe. Greece is large enough, but Eurostat, which gets its data from the statistical agencies of each country, notes that Greece does not provide “transaction-based” data for home prices; the Bank of Greece only provides “valuation prices.” So no chart for Greece.
The UK Brexited, and Eurostat stopped including UK data in 2020.
Norway is not a member of the EU, but is a member of the European Economic Area (EEA), and is included in the Eurostat data.
Countries with prices below a peak in prior years and year of peak:
- Finland: -16.5% (Q2 2022).
- Germany: -10.0% (Q2 2022)
- Italy: -8.9% (Q2 2011)
- France: -7.4% (Q3 2022)
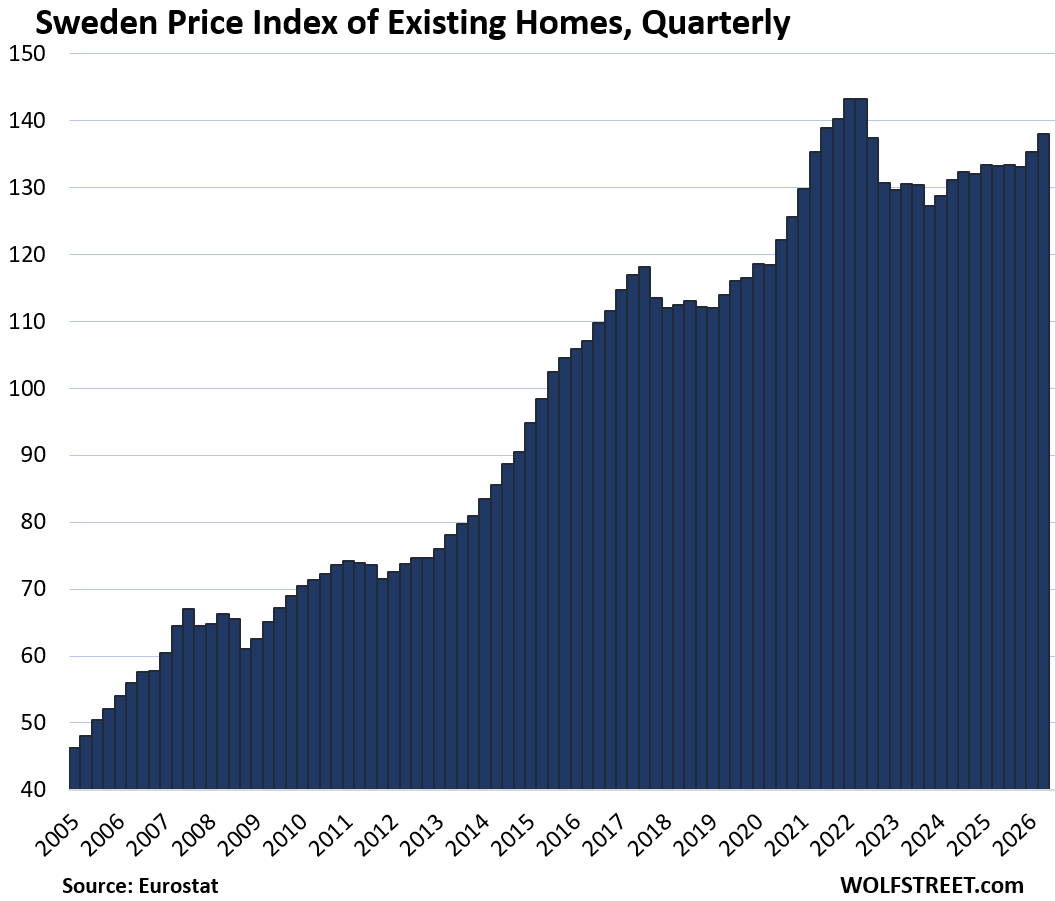
- Sweden: -3.6% (Q2 2022)
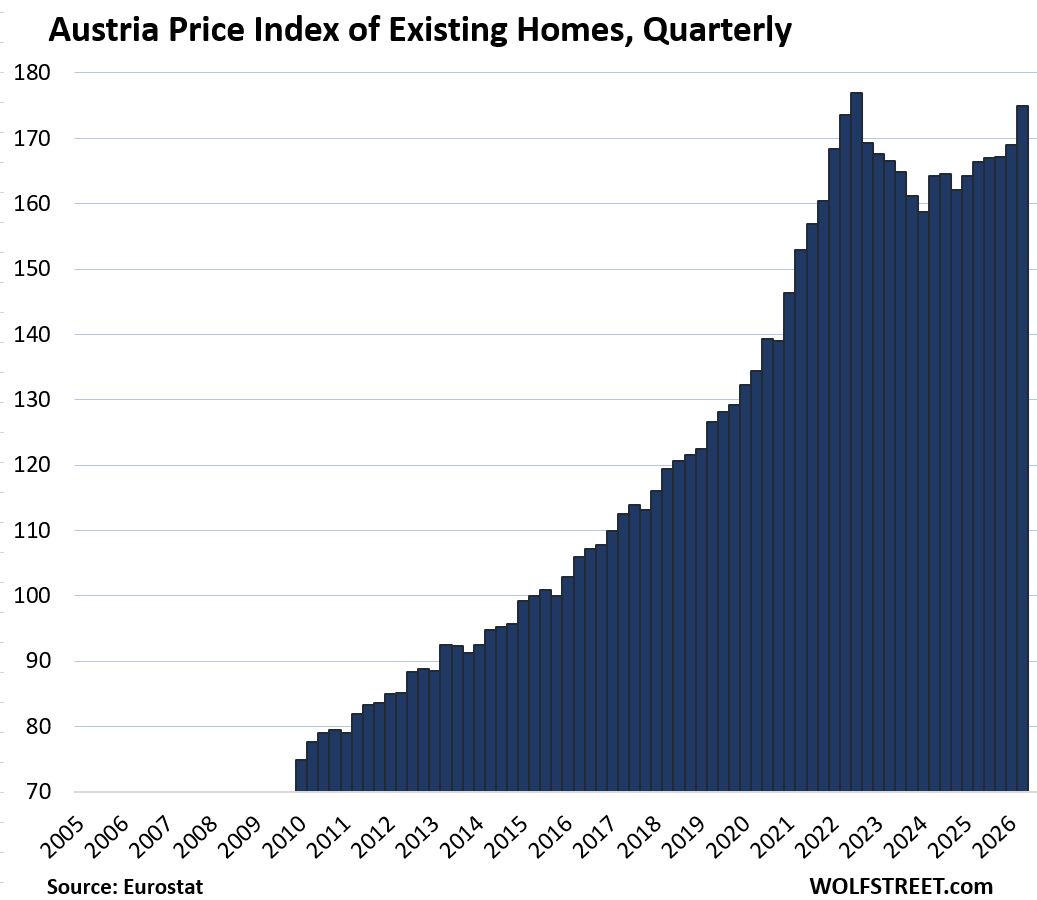
- Austria: -1.1% (Q3 2022)
Biggest price gains since 2010:
- Hungary: +307%
- Portugal: +197%
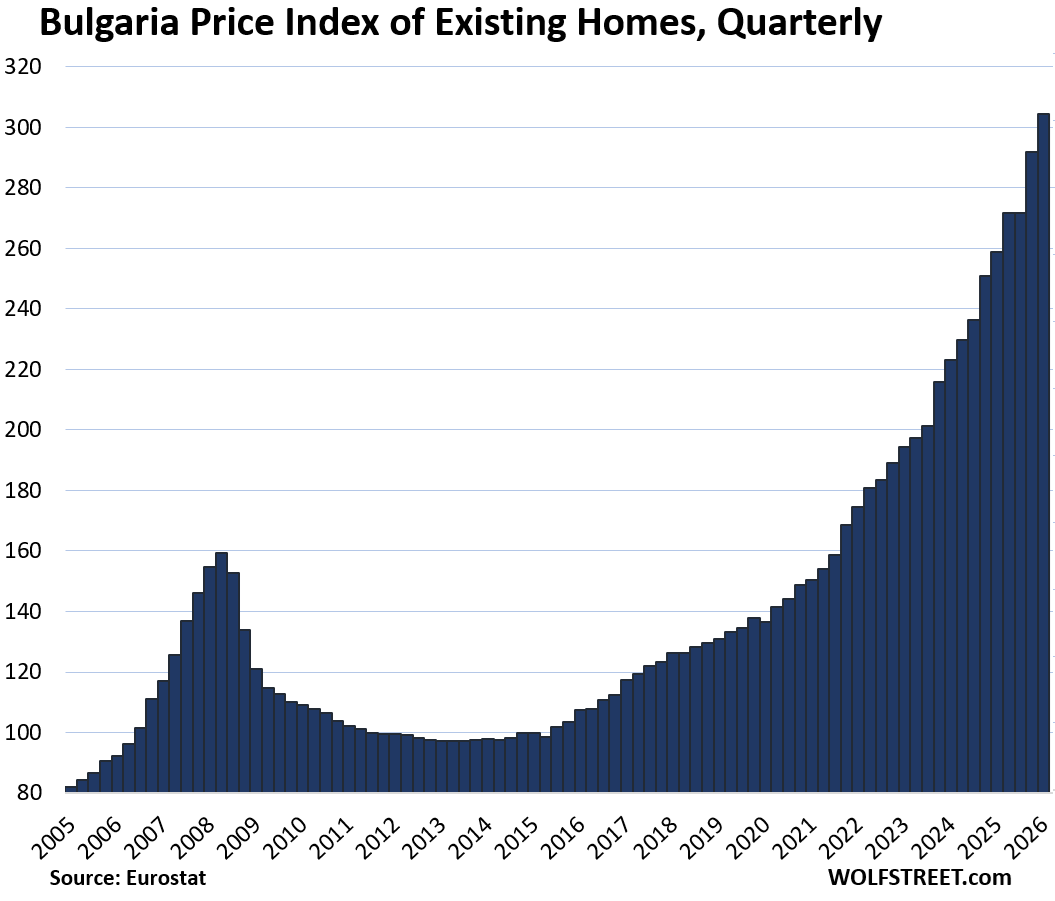
- Bulgaria: +177%
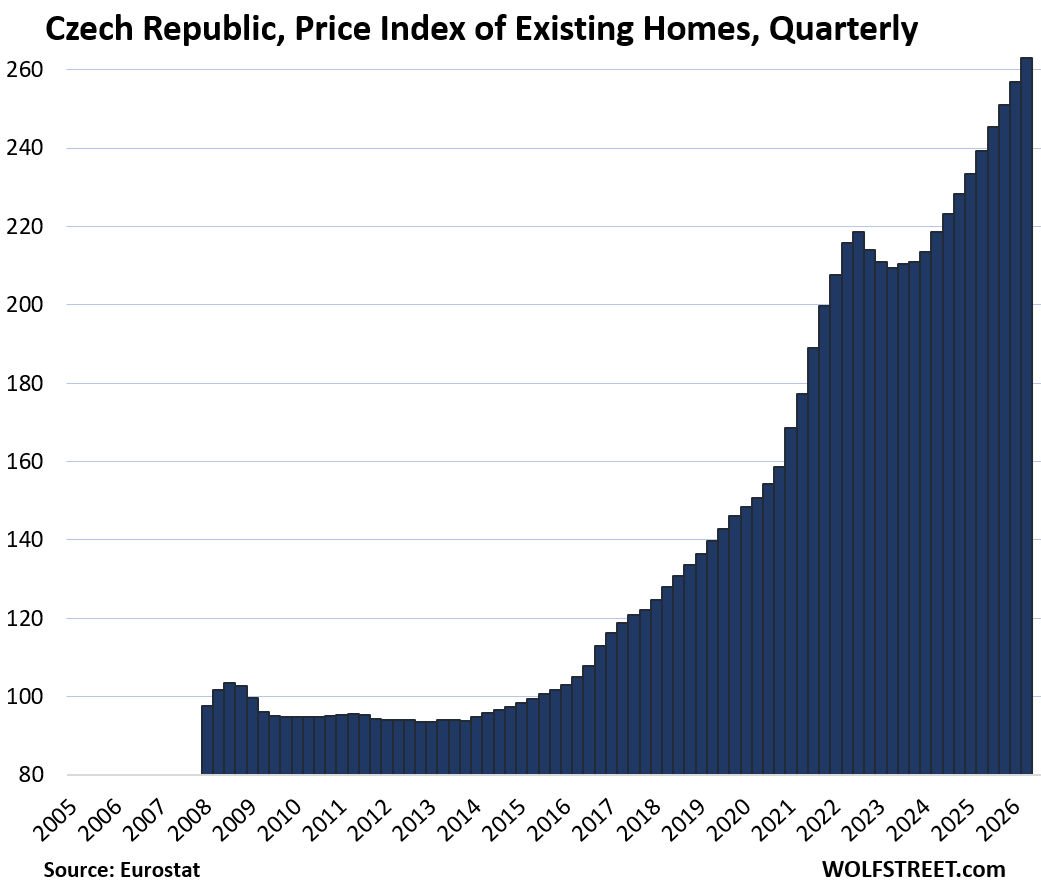
- Czechia: +177%
- Slovakia: +150%
- Croatia: +138%
- Austria: +134%
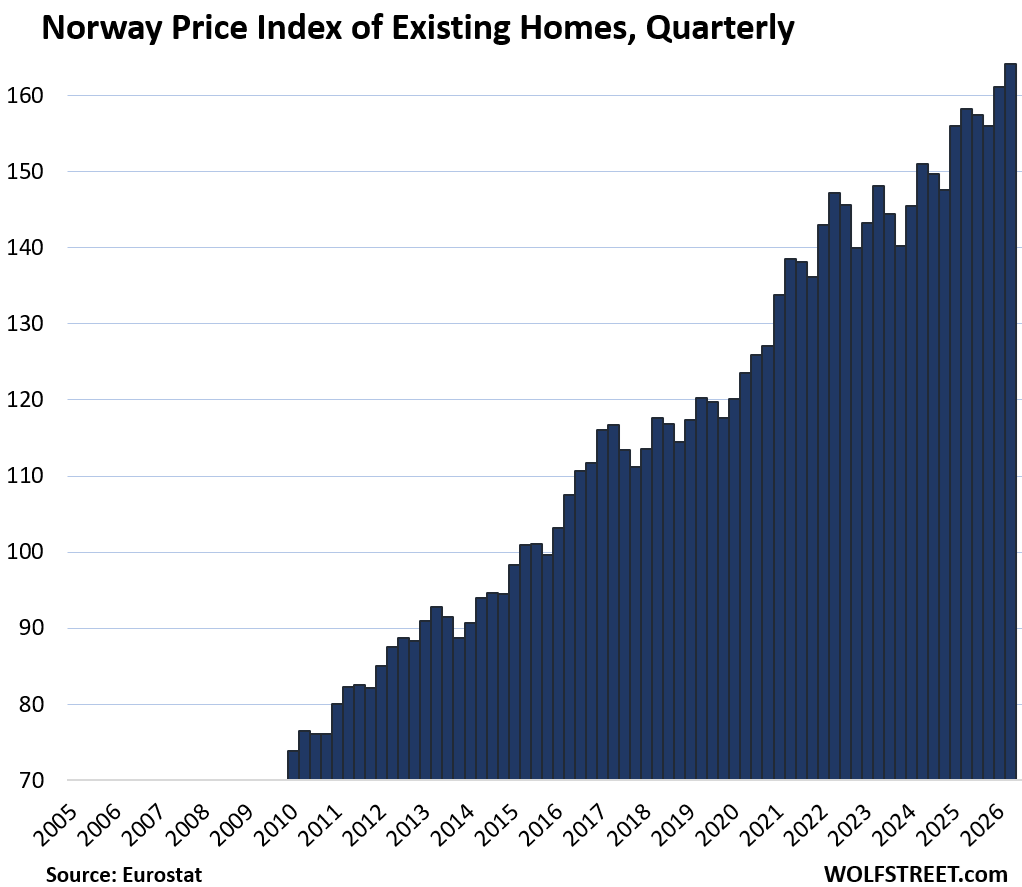
- Norway: +122%
- Poland: +122%
Double-digit year-over-year gains:
- Portugal: +18.0%
- Bulgaria: +17.6%
- Slovakia: +14.3%
- Croatia: +14.1%
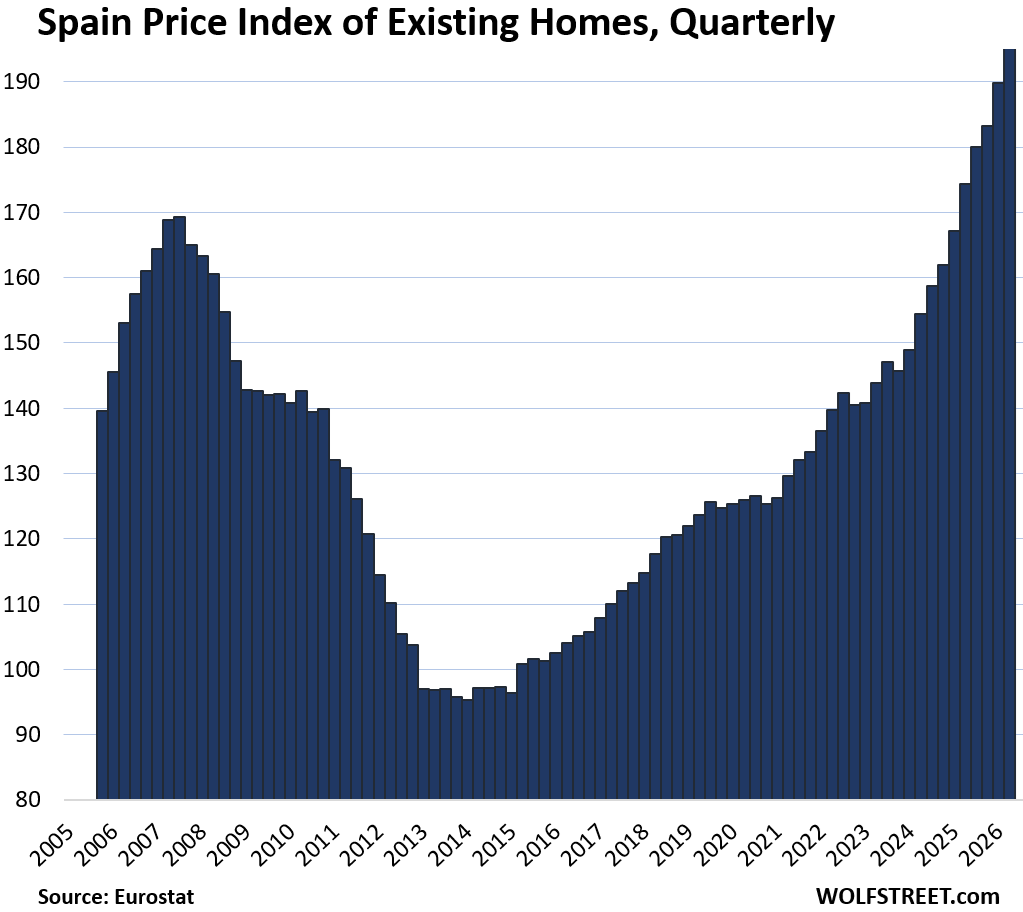
- Spain: +12.9%
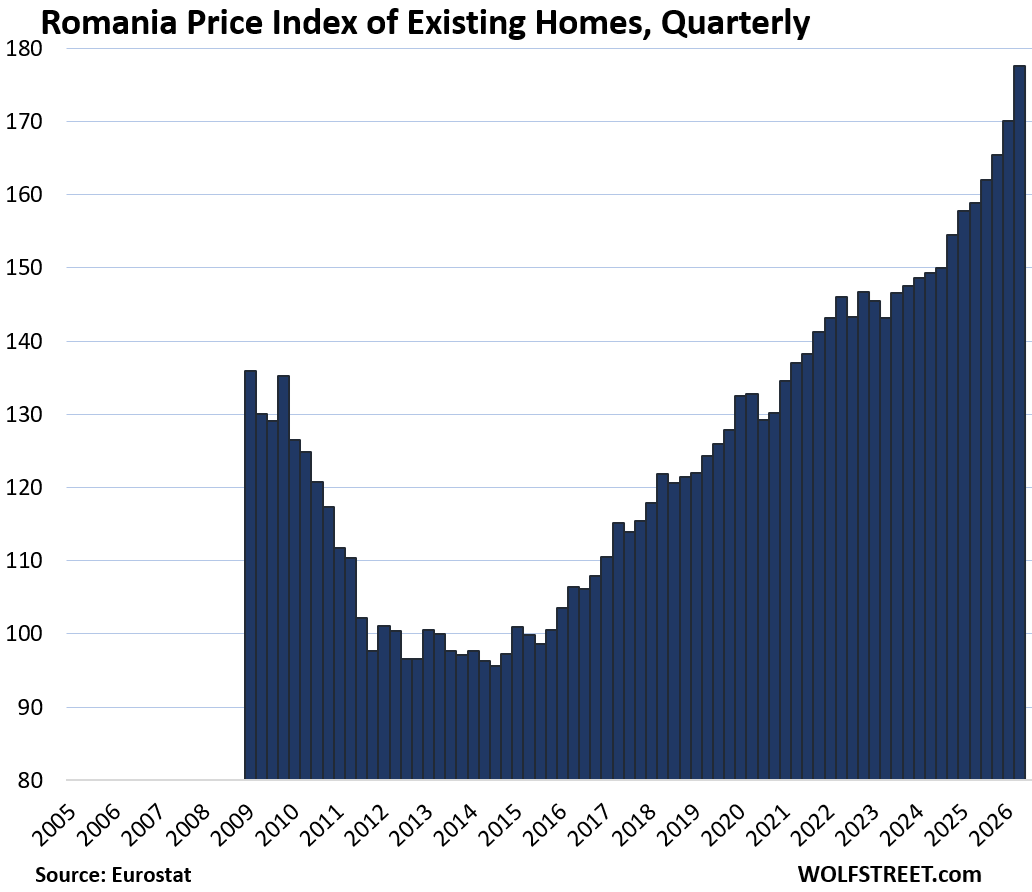
- Romania: +11.8%
- Hungary: 11.5%
- Czechia: +10.0%
Biggest quarter-over-quarter gains in Q2:
- Romania: +4.4%
- Bulgaria: +4.3%
- Spain: +3.7%
- Portugal: +3.6%
- Austria: +3.5%
- Croatia: +3.4%
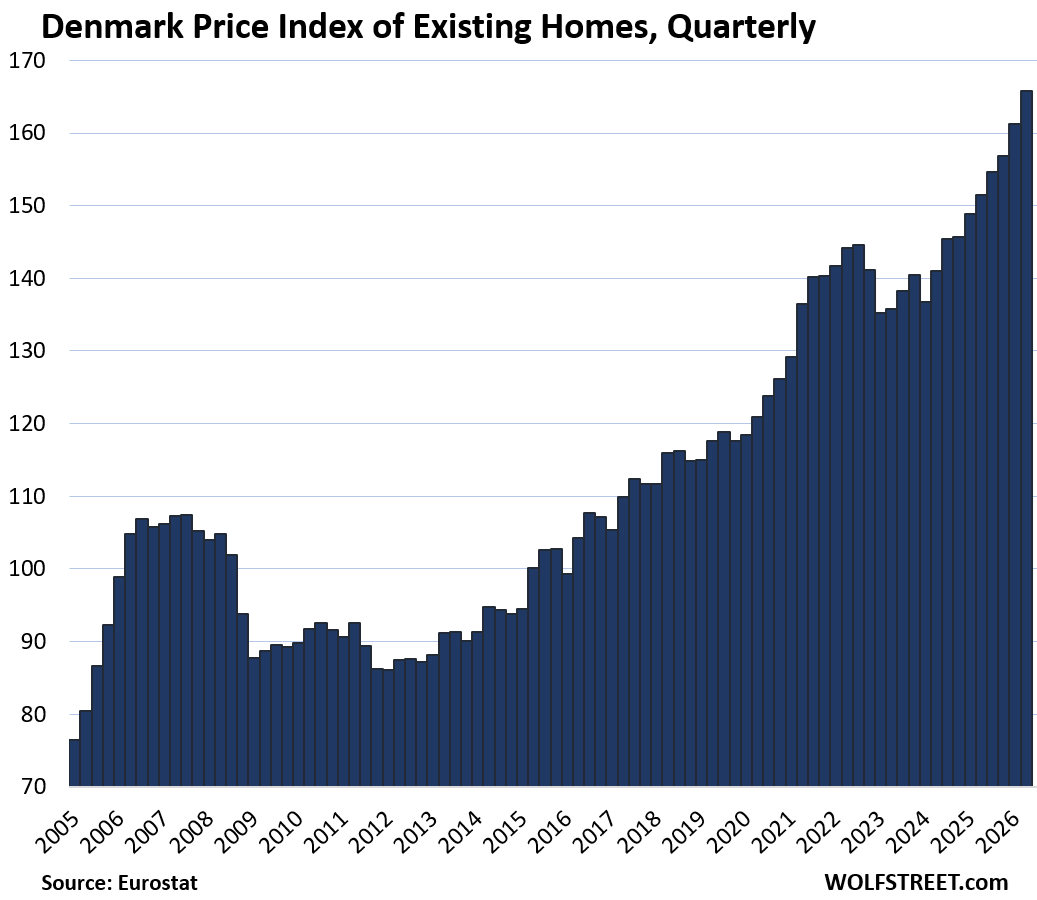
- Denmark: +2.8%
- Czechia: +2.4%
Home price indices for the 20 largest EU/EEA countries:
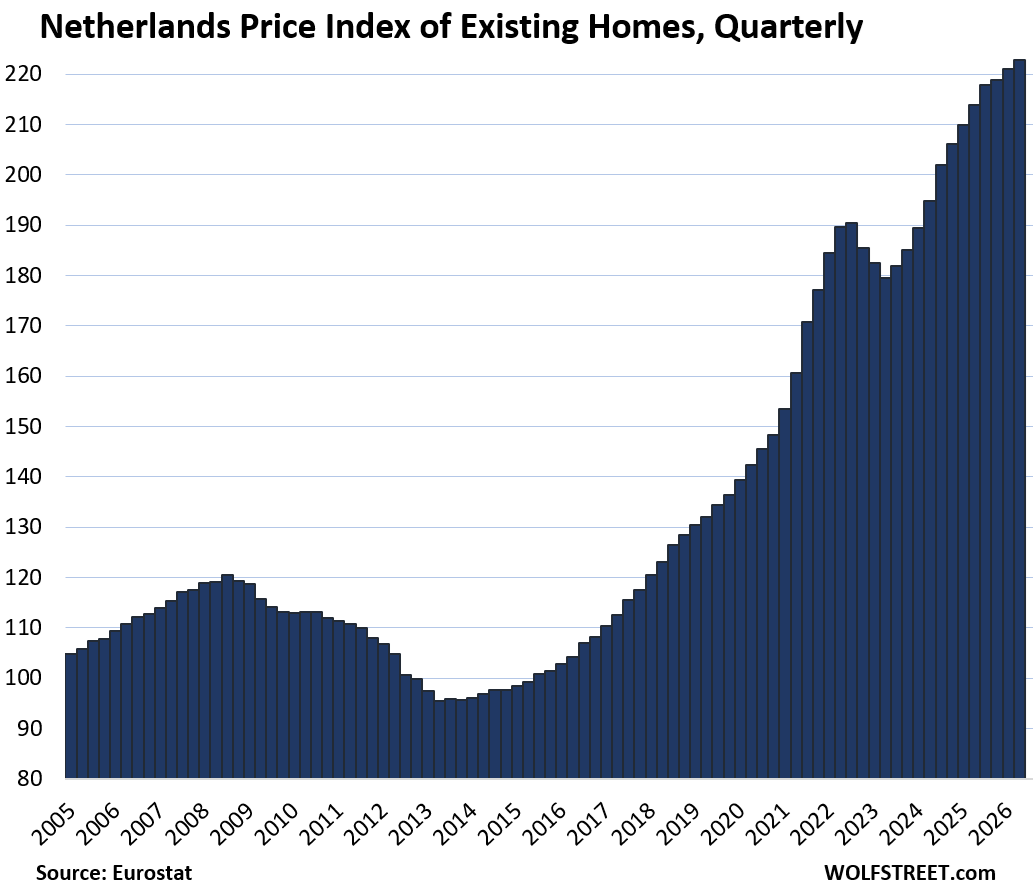
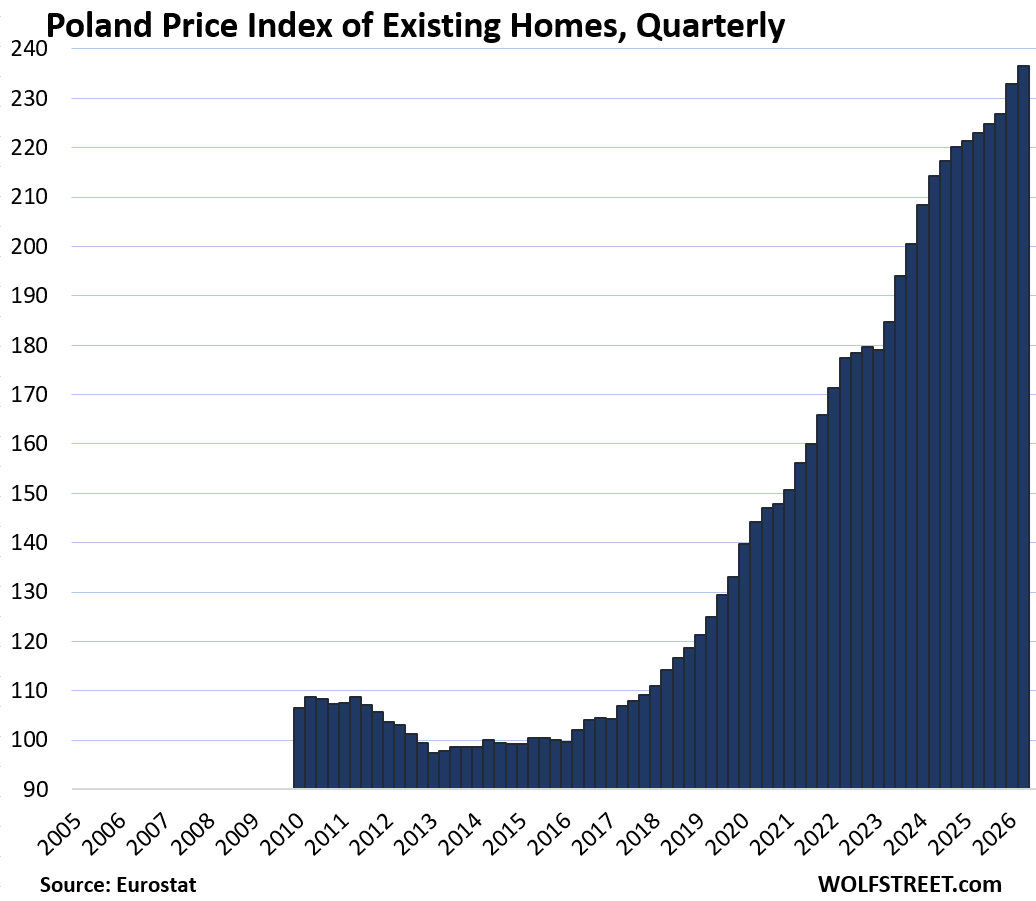
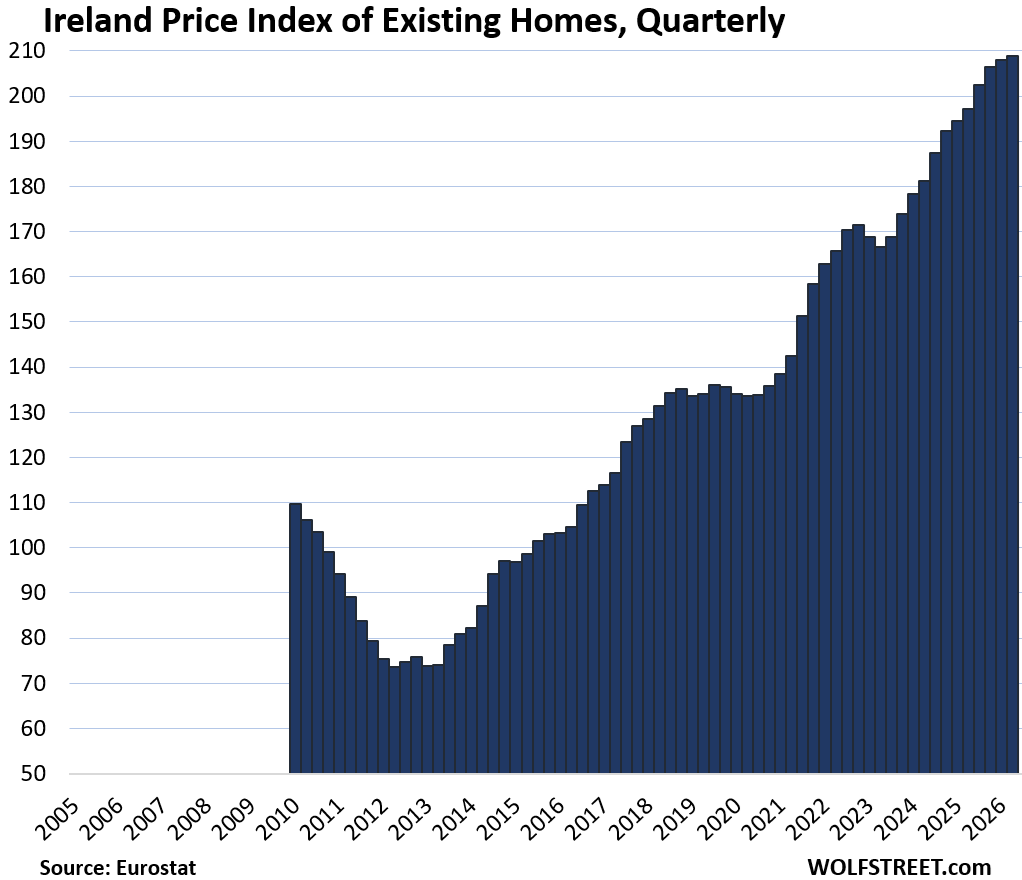
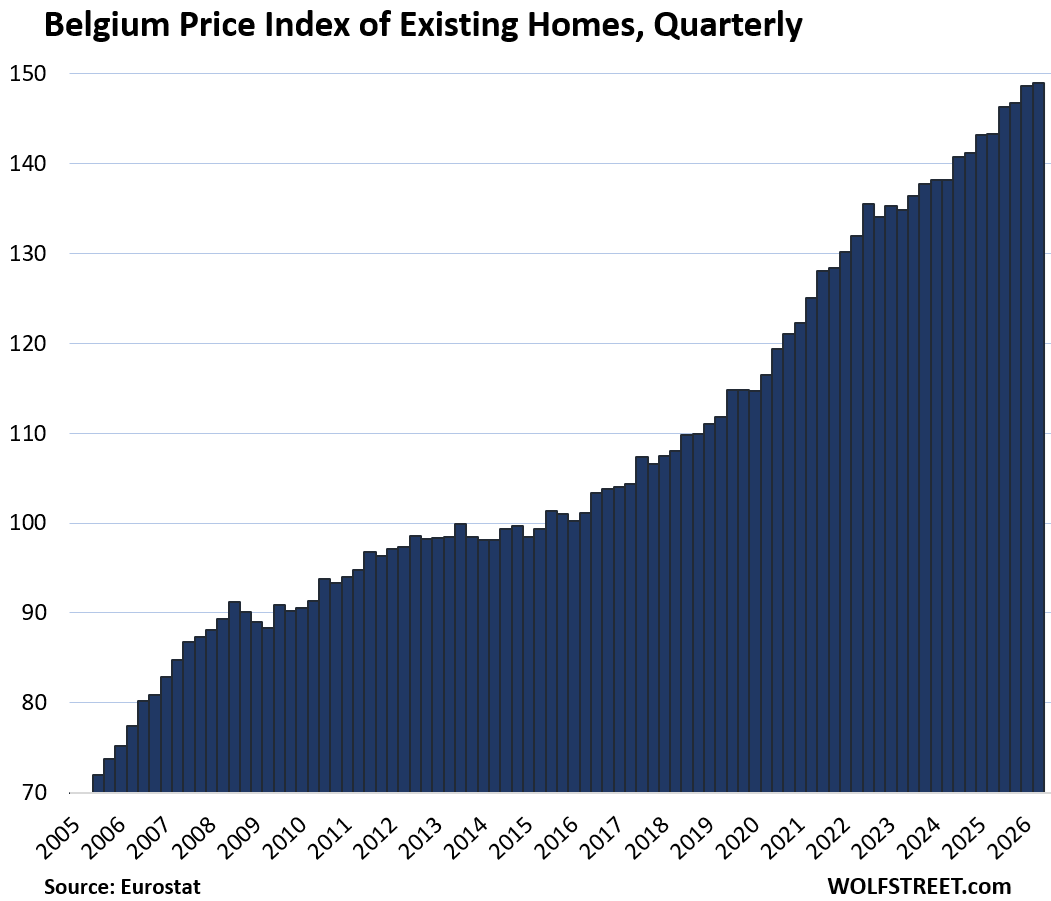
Eurostat’s transaction-based data goes back to 2005 for some countries; for other countries, it goes back less far. But they’re depicted here on the same timeline going back to 2005 for easier comparison.
The vertical axis shows index values. The index was set at 100 for 2015 for each market. Since the index value is not a price in currency but just an index value (similar to the Case Shiller Index for the 20 cities in the US), it is not possible to compare the price levels across different markets. But it does show the changes of the prices within each market.
The little tables show three or four columns, from left to right: % change since 2010; quarter-over-quarter (QoQ) % change; year-over-year (YoY) % change; and % decline from the peak in prior years, for the six countries where that occurred.
| Germany, Prices of Existing Homes | |||
| since 2010 | QoQ | YoY | From peak |
| 85% | 0.3% | 0.5% | -10.0% |
| France, Prices of Existing Homes | |||
| Since 2010 | QoQ | YoY | From peak |
| 29% | -0.9% | -0.8% | -7.4% |

| Italy, Prices of Existing Homes | |||
| Since 2010 | QoQ | YoY | From peak |
| -6% | 1.6% | 3.8% | -8.9% |
| Spain, Prices of Existing Homes | ||
| Since 2010 | QoQ | YoY |
| 40% | 3.7% | 12.9% |
| Netherlands, Prices of Existing Homes | ||
| Since 2010 | QoQ | YoY |
| 97% | 0.9% | 4.2% |
| Poland, Prices of Existing Homes | ||
| Since 2010 | QoQ | YoY |
| 122% | 1.6% | 6.1% |
| Ireland, Prices of Existing Homes | ||
| Since 2010 | QoQ | YoY |
| 90% | 0.4% | 5.9% |
| Belgium, Prices of Existing Homes | ||
| Since 2010 | QoQ | YoY |
| 65% | 0.2% | 3.9% |
| Sweden, Prices of Existing Homes | |||
| Since 2010 | QoQ | YoY | From peak |
| 96% | 2.0% | 3.6% | -3.6% |
| Bulgaria, Prices of Existing Homes | ||
| Since 2010 | QoQ | YoY |
| 177% | 4.3% | 17.6% |
| Norway, Prices of Existing Homes | ||
| Since 2010 | QoQ | YoY |
| 122% | 1.9% | 3.7% |
| Austria, Prices of Existing Homes | |||
| Since 2010 | QoQ | YoY | From peak |
| 134% | 3.5% | 5.2% | -1.1% |
| Denmark, Prices of Existing Homes | ||
| Since 2010 | QoQ | YoY |
| 84% | 2.8% | 9.4% |
| Slovakia, Prices of Existing Homes | ||
| Since 2010 | QoQ | YoY |
| 150% | 1.3% | 14.3% |
| Romania, Prices of Existing Homes | ||
| Since 2010 | QoQ | YoY |
| 41% | 4.4% | 11.8% |
| Czech Republic, Prices of Existing Homes | ||
| Since 2010 | QoQ | YoY |
| 177% | 2.4% | 10.0% |
| Finland, Prices of Existing Homes | |||
| Since 2010 | QoQ | YoY | From peak |
| -3% | 0.4% | -3.5% | -16.5% |
| Hungary, Prices of Existing Homes | ||
| Since 2010 | QoQ | YoY |
| 307% | -1.6% | 11.5% |
| Portugal, Prices of Existing Homes | ||
| Since 2010 | QoQ | YoY |
| 197% | 3.6% | 18.0% |
| Croatia, Prices of Existing Homes | ||
| Since 2010 | QoQ | YoY |
| 138% | 3% | 14% |
Enjoy reading WOLF STREET and want to support it? You can donate. I appreciate it immensely. Click on the mug to find out how:


In 2026, the property market in Europe and globally is in a state of serious differentiation, with the largest decline in the number of deals (transactions) observed in Bulgaria, Croatia and Poland, as well as in countries with high sensitivity to lending such as the UK and Australia.
Property transactions in Bulgaria sank in the third quarter to their lowest level since at least 2005, as long as data is available on the Registry Agency website
For Bulgaria In economic terms, this phenomenon is called a “low-liquidity property bubble.” The number of transactions is decreasing because the mass buyer with normal incomes has already been completely squeezed out of the market. The few transactions that are concluded are made by people with very large savings or very high incomes. Since they buy expensive, luxury or premium properties, this artificially raises the average price of the statistics, even though the total number of sales is falling
These are also greenfield and high-priced deals concluded 2-3 years ago that are now being registered on Act 16
The decline in the number of deals is the first clear signal that buyers have hit the brakes. Historically, however, real estate prices react with a 6 to 12 month delay after the decline in deals. Sellers are still living with the feeling of the boom of previous years and refuse to accept the new reality that buyers can no longer afford these levels.
💔
“100% of this text is AI,” according to Pangram. I checked because the very first paragraph sounded like AI and I didn’t read further, but checked.
Pangram said: “This appears to be AI text that has been paraphrased or rewritten.”
This text was STOLEN by AI from other publications and presented by AI as its own, and you stole it from AI presented it as YOUR own.
People, this is one of the seven deadly sins of commenting.
Maybe Julian is an AI agent that was trying to hack into Wolfstreet and found the content so interesting that it commented?
Hey Gattopardo, my favorite restaurant in Manhattan, Il Gattopardo, West 54th. There’s a place where prices never seem to decline.
@Jwmbubs, I used to go there often in the 2010-14 era. It was among my faves back then, nor was it all that expensive (for NYC). Looked at the menu recently. Holy smokes!
Time to implement an AI screening moderator don’t you think?
Just say whatcha gonna say.
Using AI to say whatcha wanna say is kinda weird.
Why can’t you just spit it out without computer assistance?
Haha
AI-checks are quite unreliable.
Some texts are obvious but the problem is that AI tries to write like humans and thus there are quite a few humans who write like AI.
At least its not a trash comment littered with emojies lmao.
The commenter admitted it was AI in a comment that I deleted.
In short, when the total volume of transactions drops dramatically (reaching the lowest levels in 21 years), the market deforms:
Buyers with lower opportunities – the mass – have completely disappeared due to the high cost of living and high price levels.
Buyers in the luxury segment or those who buy three-room/four-room apartments in quality buildings in large cities remain active. When fewer transactions are concluded, but they are mainly for more expensive properties, the average price per square meter in the statistics rises, although the mass market has frozen
The collapse of transaction has been the rule in the US for four years, and I cover that ad nauseam every month at least once, but often three times or more. This is happening everywhere, including in Canada, in Europe, in Australia, etc.
I know this because I regularly read your articles. Now it’s happening in Bulgaria too. So as I said, what I copied from the АI is my conversation with it and I don’t see any other explanation for this collapse of transactions, accompanied by the huge increase in prices. However, people don’t understand this and think that everything is temporary.
The difference is that in the US, prices in many large cities are already falling by up to 27-29 percent, while in Bulgaria we are still at the stage of a collapse in transactions BUT a rise in prices.
Article opening sentence in Victoria BC local news source this morning: (CHEK NEWS)
Greater Victoria’s housing market moved into buyer’s market territory in September as sales dropped and the number of homes available for sale continued to climb, according to the Victoria Real Estate Board.
Condos way down in price, too.
S&P 500 and Nasdaq rise toward record highs, even as bond yields keep climbing
I’d love to see what’s happening with the rental market in those countries for comparison. I’ve completely lost the will to maintain a house after doing it for so many years, but I would like to move away from my home country and have considered many of these European countries.
Especially for Bulgaria, rents show that the real estate market is in a huge bubble. With an average asking price of an apartment in the capital Sofia of 220k euros and an average salary of 1750 euros gross (highly distorted because people on the whole earn up to 1000-1500 euros gross), the average rent is between 700 and 800 euros or 10-12 euros per m2
Spend a year living in vacation rentals in your favored European country to see if you can handle it. Expat life in a foreign country is not for everyone. Some love it, some come back frustrated.
The grass is never greener – just different weeds.
Smoke em if ya got them.
You are correct, it’s not for the squeamish. I retired 14 months ago and moved to Slovakia from my final assignment in China. I’m fortunate that most of my adult life was spent living and working overseas, speak three languages excluding my native English and have second citizenship in an EU country so retiring here was easy taking just two weeks to get my residency permit.
People need to do what is called a “country study.” It involves reviewing EVERYTHING to include access to transportation hubs of all sorts to include airports, trains, mass transportation, rivers, etc.
Fortunately, my apartment is a unicorn and they’ll have to carry me out of it on a stretcher before I leave.
“Spend a year living in vacation rentals in your favored European country”
If it’s anything like US vacation rentals, you’d go broke quickly. Airbnb prices are breathtakingly overpriced.
Lots of places in Europe are a lot cheaper than the US. If you’re used to California prices, even Germany is a deal!
Which countries allow you to just move there for a year?
Zoroto,
Allow?
The old trick is to leave the country before the period is over, such as 90 days, then return 2 weeks later, if anyone pays attention.
But Japan is pretty picky about that. You have 90 days. If you leave on your 90th day, and 2 weeks later come back from a third country, such as South Korea, they will interview you pretty hard. If you do it a second time, they might not let you in. People bought vacation homes in Japan thinking they can just come and go, and now are blocked from re-entering.
Europe is different. In the Schengen area, there are many countries, and the borders between them are mostly uncontrolled, though occasionally they check. I just went to Germany and Austria this summer, and didn’t even get a stamp in my passport. I crossed the border between Germany and Austria on foot while hiking in the mountains, and no one cared. I lived for quite a while in France without any kind of visa. But if you try to get a job there or open a bank account with a US passport, that’s an entirely different story. Good luck!
Maybe pay what it takes to get a golden visa and get an EU passport from Cyprus or Malta or whatever country is in this business, and then you’re good to go. But that costs a bundle.
@Wolf
US citizens are mostly rejected at banks, because of the hassle with the paperwork. The US gov. demands vast amounts of it. And it has to be repeated yearly.
That’s why banks ask if you are a US person nowadays. If so, then: “no thanks”.
Up to date information for most markets is readily available through recent youtube content and local market FB groups from long and short term expats residing in these cities.
Across most markets, in the highest demand cities in the CBDs or historic centers rents have risen a fair amount over the last five years but in suburbs or smaller communities prices have been quite stable.
As wolf says, living abroad is not for everyone and testing the waters with months long stays in various cities is a good approach. Research and planning, especially if your native language is not commonly spoken, go a long way in making it a pleasant experience.
Seems like everybody would like to see real estate prices decline. Since cash is devaluing at a rapid rate given inflation, and QE – the fed has 7 trillion Plus of Treasury securities I read this morning- low priced real estate is be a bargain.
$4.56 Trillion of Treasuries as of its current balance sheet. But that’s still a lot.
It also still has $1.90 trillion of MBS.
All assets are denominated in fiat currency, and fiat currency is a leaky bucket.
As long as an asset (real estate, gold, stocks) remains unsold, you hold only a paper valuation expressed in constantly depreciating slips of paper. You have no actual cash in your pocket, yet the value of what you own is steadily eroded by inflation, because the cost of living, services, and other faster-moving assets (such as gold during certain periods) outpace your asset.
This is how the fiat system devours the value of everything, even if you do not sell:
Why does inflation eat up ALL assets?
It erodes the purchasing power of absolutely everything. The reason is that inflation is not merely a rise in the price of goods—it is the destruction of the measure of value (money) itself.
Asset bubbles: When money is printed, it first flows into markets (real estate, stocks). However, when inflation spills over into the real economy (renovations, food, energy, wages), the cost of living skyrockets. The value of your asset on paper can no longer keep pace with the surge in actual expenses.
The tax trap: The state taxes you based on the nominal (virtual) value.
If your property doubles in value solely due to inflation, you will pay twice as much in taxes—using devalued currency—without actually becoming any wealthier.
Ultimately, in a world of fiat money, no one can fully escape inflation. Assets are simply an attempt to outrun the printing press; once you sell, you realize your purchasing power has been eroded.
If you hold the asset, you simply possess virtual figures.
This is the final nail in the coffin of the “safe asset” illusion. Every single asset undergoes brutal market crashes where its nominal value in fiat currency evaporates within a matter of months.
You lose purchasing power to inflation during good years, while during a crisis, the market also crashes the nominal price of your asset. That is when your virtual profit transforms into a very real—and massive—virtual loss.
History shows that no asset is immune to a crash:
Real estate: The 2008 crash proved that property values can not only drop by 30% to 50% globally but also become completely illiquid—no one wants to buy, yet you urgently need cash.
Gold: Although considered a “safe haven,” gold has experienced massive bear markets. After peaking in 1980, its price fell and stagnated for nearly 20 years. Anyone who bought back then had to wait decades just to break even in nominal terms (while inflation eroded the real value).
Bitcoin and cryptocurrencies: They regularly go through so-called “crypto winters,” where their price drops by 70% to 80% from the peak. Volatility is so extreme that the asset can crash before you even realize what is happening.
Stocks: Crashes like the Dot-com bubble in 2000 or the Great Depression in 1929 wipe trillions of dollars off the markets in a matter of days.
Seems like mortgage rates are going to continue to head up as global supply of bonds issued is going to continue to explode. At some point will the treasury just stop issuing bonds to prevent rates from continuing upward. What says debt has to be backed by bonds ? Treasury Sec could just say “we will spend the money now and sell the bonds next year “.
Treasury has about 3-5 months’ worth of cash on hand if the only thing it does at Treasury auctions is refinance maturing securities and doesn’t add to them. After that, it has zero cash left over and can no longer pay government salaries or anything else. Once the cash level in its account drops to low-ish levels, the bond market will get very nervous, likely causing yields to spike out the wazoo. Bond market doesn’t like defaults. That’s what’s keeping Treasury from doing what you proposed.
Isn’t it strange to see house prices being bid up this way, when the demographic inverted pyramid is telling us there will soon be a lot more houses than people?
Indeed, it’s bizarre in my view.
Houses today are an now expensive asset to buy, either it’s new and ‘cheap’ to run but costly to maintain longer term (as they’re built like crap and imo will see high medium to long term maintenance costs (what I’m seeing in UK at least)), or need costly modernisation that’s going up rapidly (esp via labour costs, not so bad if you diy, actual tool costs aren’t bad, it’s materials that have gone up most).
And after all that, who is gonna buy it off you in the future? There will be tons of choice for the next generations so yours will have to stand out and be ‘right’ to even attract an ok price.
Fine today, the high paper value looks good, but in 20 years say?
When you look at these charts and the 2020 free money bonanza you kinda get a sense that it was a great excuse to fire up inflation again as QE had run its course and inflation was low.
Now we have hot inflation and everyone seems happy but it really is a K shaped economy.
Stock breadth is super narrow, housing will be K shaped with desirable stuff, and stuff that’s gonna become impossible to even sell.
Even the likes of VAG who just a few years back wanted to focus on high margin low volume (K shape) are now struggling, what a surprise that strategy didn’t pay off once tue helicopter money turned off.
Weird times ahead.
Shirley at some point the inflation trade can’t work and with bonds/gilts rising quite quickly the cross-over point is approaching faster now.
The exit certainly isn’t big enough for everyone so as Wolf alluded to the other day, I think it’s time to start some organised swizzling into these higher yielding debt products.
“And after all that, who is gonna buy it off you in the future? There will be tons of choice for the next generations so yours will have to stand out and be ‘right’ to even attract an ok price.”
Yes. Who is going to buy all those ghastly white body with black trimmed cold, sterile and soulless domiciles? And Apartments? And Office buildings? And…
Almost no proper tax in EU, no tax when selling property and then plenty of investment properties in big cities
1) people occupy more space. What used to be a 2 bedroom appartment for a family of 5-7 is now barely enough for a couble without kids.
2) Quite a lot of empty/ roomy houses in small village available but the younger generations push into the cities. Thus the market is, like always, local and there is always not enough supply where the jobmarket has the best opportunities.
If you take immigration into account, the population in many EU countries is actually growing.
In the UK at least, the bulk of the immigrant base is not buying all these expensive houses though.
They might be bought and then rented by councils and government (tax payers or people lending to government via gilts and fiscal deficits) though, but that only lasts so long.
You can only indulge in economic negative multiplier spending if you have a currency hegemony and a trade surplus.
Most of the EU can’t do that, the UK definitely can’t.
The bulk of this generation of immigrants have no/little existing wealth/future inheritance etc to bring into the game either, and even people living in the UK increasingly rely on that for getting a property.
Plus the current UK political party is keen on giving more power to renters, and freezing inheritance tax thresholds, capital gains taxes up, and so the attraction for investors in housing is subdued which will have a downward pressure on prices.
I’m not sure I’d be bullish property vs inflation in the coming 20 years.
These prices were discovered and set by the boomers with very low interest rates and financial deregulation (in the uk and I’m sure elsewhere).
That environment isn’t set to be repeated, arguably it’s set to invert.
Wolf – after admittedly skimming through your article, I can only say “Woo Hoo, the jerk bankers not only created a monstrous housing bubble in the U.S., they have created a worldwide monstrous bubble.”
I own an apartment in EU and one big difference, comparable with US is that property tax in many EU countries is practically almost zero. This is perhaps reason why my apartment in EU was growing in price faster than my house in US. Also in many EU countries no need to pay tax when selling property. One other point is that there is impossible to get 30 years fixed rate for mortgage (only 5years fixed rate :-( ).
Note that there is a big difference between different EU countries with their laws related to ownership and then graph for each country should be considered with this in mind.
I was surprised about numbers of “investment” apartments in many EU cities.
‘.. property tax in many EU countries is practically almost zero. ‘
This also holds true for Britain.
Britain’s annual property tax (Council Tax) is based on property values recorded in 1991 which have never been updated.
So the tax raised hasn’t kept pace with accelerating house prices.
Owners of large homes in the most sought-after areas, eg London suburbs, benefit the most.
According to the Fairer Share Campaign, the effective rate of Council Tax can be as low as 0.2%.
There is another, much larger, property tax known as Stamp Duty.
But that’s a transaction tax paid when the house is sold; and the buyer pays it, not the seller.
The correlation between housing appreciation across all the graphs shown above and when QE started is so telling. It leads me to think what may have happed back in 09 if the fed just stayed pat. Well they didn’t and those charts don’t lie. It is what it is.
@wolf My understanding is that Eurostat uses the local currency, which is not necessarily Euro, and reports nominal increases.
In the case of Romania, the YoY price increase was 11.8%. A quick AI query shows that an investor who put Euros in that market actually lost money:
Q3 2025 to Q2 2026
Romanian house prices, nominal, local currency: +12.1%
After removing Romanian inflation: +5.5%
After converting to Euro and accounting for the local currency depreciation: +1.7%
After removing the Eurozone inflation: -1.2%
All foreign investors with a different currency face this issue everywhere, including euro investors buying houses in the US. It’s called currency risk.
But this article isn’t about whether or not foreign investors come out ahead. Home price indices are for locals.
The $27 question – what the heck is wrong with Finland :D
Probably right next to Russia?
Wolf doesn’t show them, but I wonder about the numbers for the 3 small Baltic countries.
Prices in The Netherlands have topped because of changes in the tax rules.
The income from renting out a home used to be tax-free. But no longer. Many people owning one or two rentals, have to pay so much income tax now, that it is no longer profitable and they put the property up for sale at last years prices. But they no longer sell like hot cakes as they used to.
An average family home costs about nine times a median income. And with rising interest rates, stagnating wages and other costs rising, people can’t afford last years prices.
Always funny and totally not unexpected to see Greece as an exception.
FYI for anyone interested, beyond valuation prices from BoG, there is a index from Spitogatos website which tracks asking prices for sale and rent in Greece (Spitogatos Price Index – SPI).
I live in Hungary, and the figure shown in these statistics is a national average. In the capital, prices have increased sevenfold since 2014. People are buying one bedroom shitholes with 10 percent depostis.
All of the charts look like the peak is either in are very close
Youth unemployment , under 24 , is around 25% now in several countries and in France and Spain things are looking dodgy with trouble on the streets.
Will the Euro buckle under the strain ?
Buying a property in a far away place means taking a big bet on a foreign currency , maybe good if you get it right.
Many US stars have said ” rent and own nothing ” Jack Reacher thought the same .
Jack’s logic had some substance , being able to go where and when you feel like it in these crazy days coming seems like a plan.
Don’t be europoor boys ;)