
Income from wages & salaries, small businesses & farms, rentals, dividends, interest, and from the government.
By Wolf Richter for WOLF STREET.
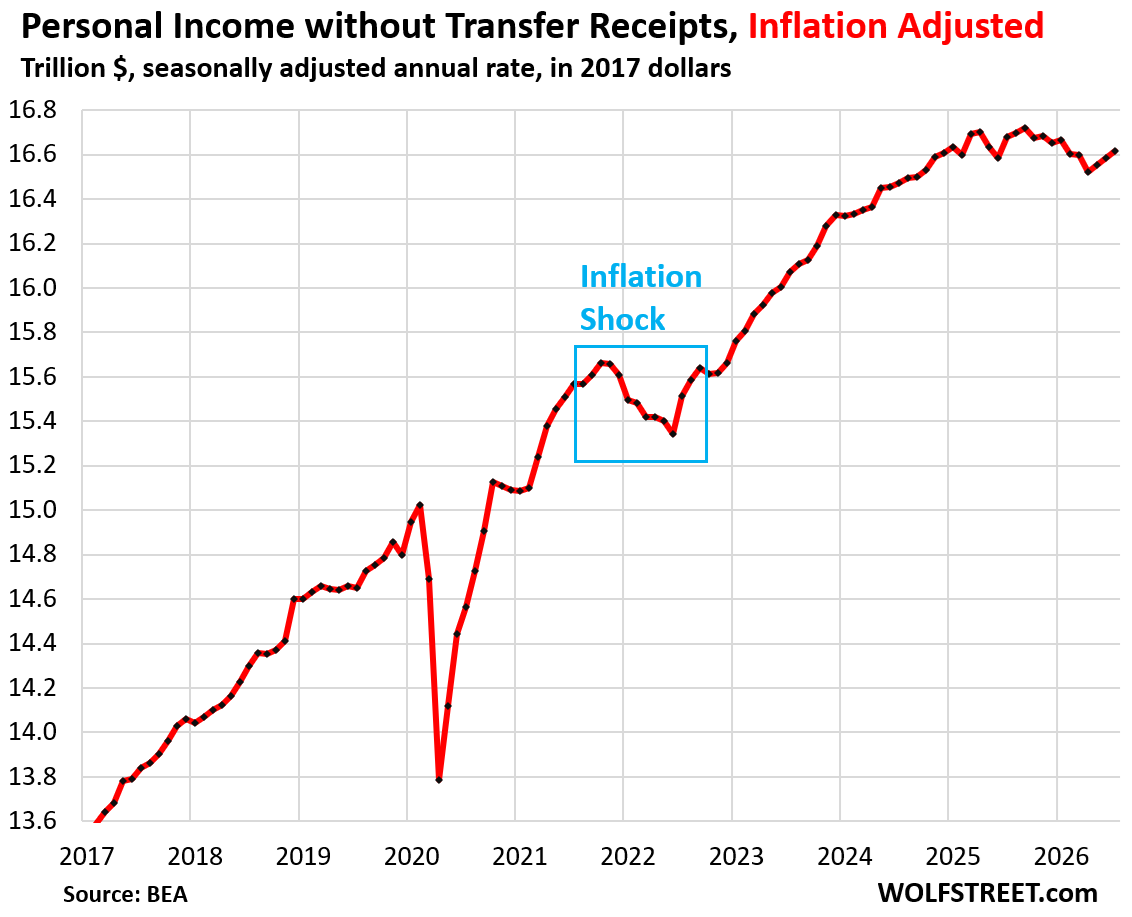
The surge of inflation since mid-2025 has knocked a hole into the purchasing power of the income that Americans earn, but not as bad as the hole during the high-inflation years from 2021 through mid-2022, which took big pay increases and well over a year to dig out of. Then, after rising through mid-2025, their earnings’ purchasing power got whacked again by the next surge of inflation – though smaller this time.
Inflation-adjusted personal income, excluding transfer receipts from the government (Social Security and other government programs), rose by 0.19% in July, the third month in a row of increases after a series of declines since September 2025. Compared to the peak in September, it was down by 0.63%. Compared to July last year, it was down by 0.38%. Compared to July two years ago, it inched up by only 0.86%. That’s the effect of a sudden increase of inflation that started mid-2025 while wage increases initially lag behind.
This income does not include capital gains where the wealthy make most of their money. And it does not include benefits paid by the government. It includes:
- Wages and salaries
- Employer contributions to private and government pension and insurance plans
- Proprietor’s income (from personally owned businesses and farms)
- Rental income
- Interest income and dividend income
Not adjusted for inflation…
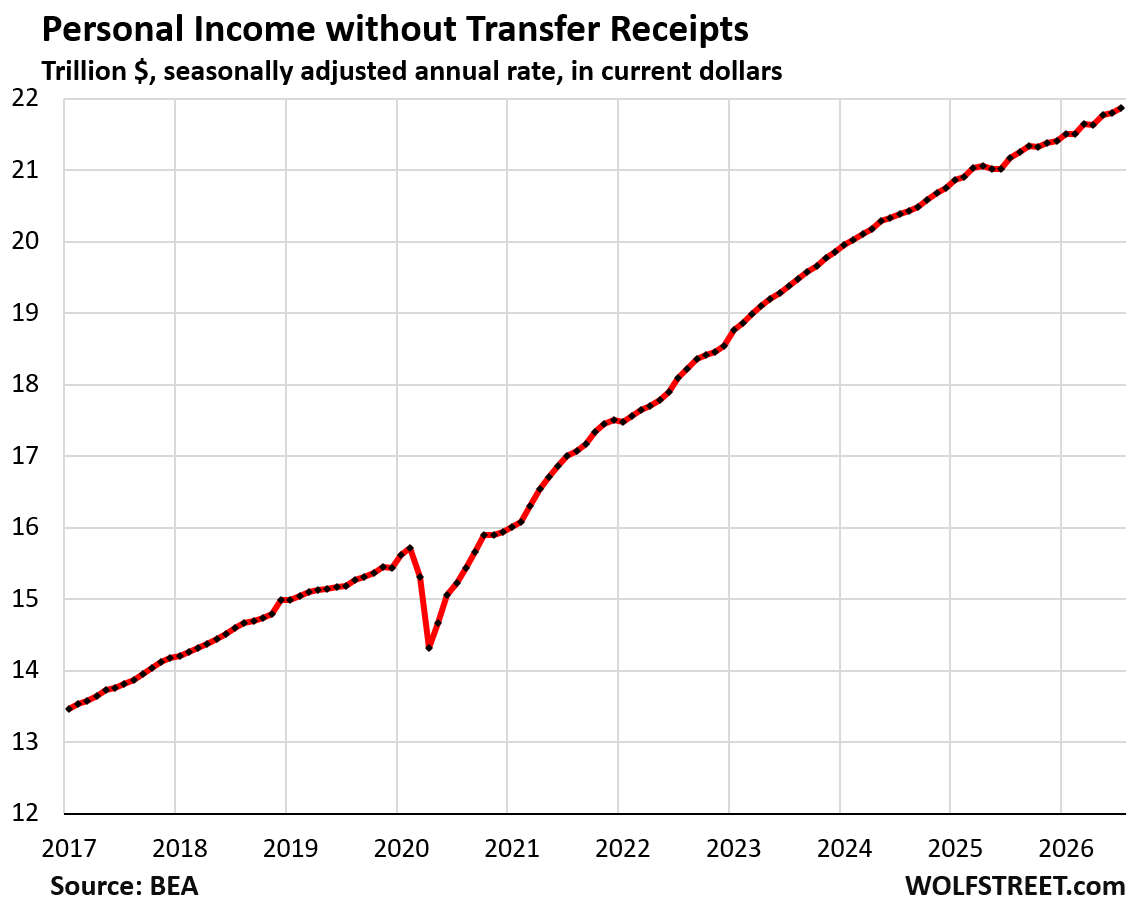
Personal income without transfer receipts from the government rose by 0.35% in July from June, and by 3.3% year-over-year, not adjusted for inflation, to a seasonally adjusted annual rate of $21.9 trillion in “current dollars” (while the chart above is expressed in “2017 dollars” for inflation adjustment).
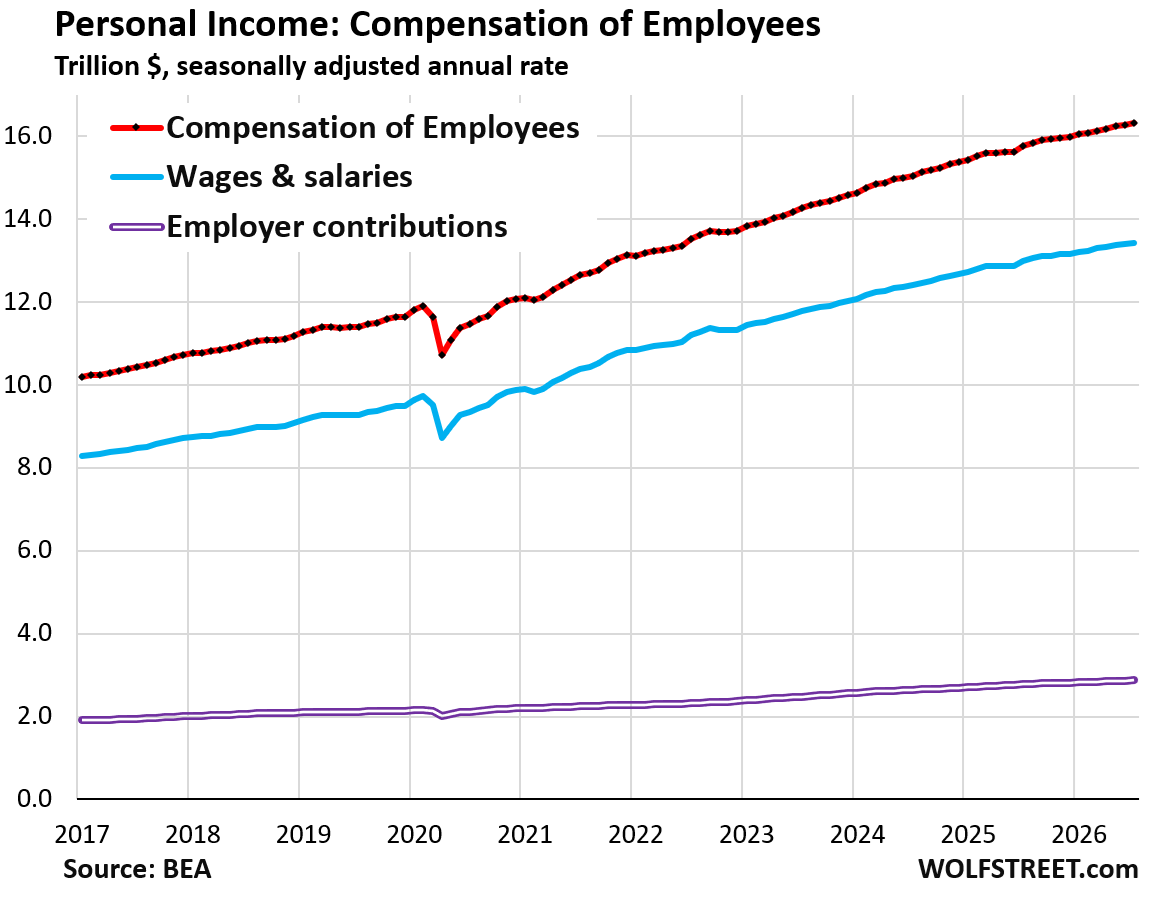
Compensation of employees consists of wages and salaries and employer contributions to employee pension and insurance funds and to government social insurance. Compensation of employees accounted for 60% of total income.
Not adjusted for inflation, compensation of employees increased by 38% since January 2020. Increases in July from June, and year-over-year, by category:
- Compensation of employees (red): +0.29% monthly, +3.5% YoY
- Wages and salaries (blue): +0.29% monthly, +3.5% YoY
- Employer contributions (purple double line): +0.27% monthly, +3.6% YoY.
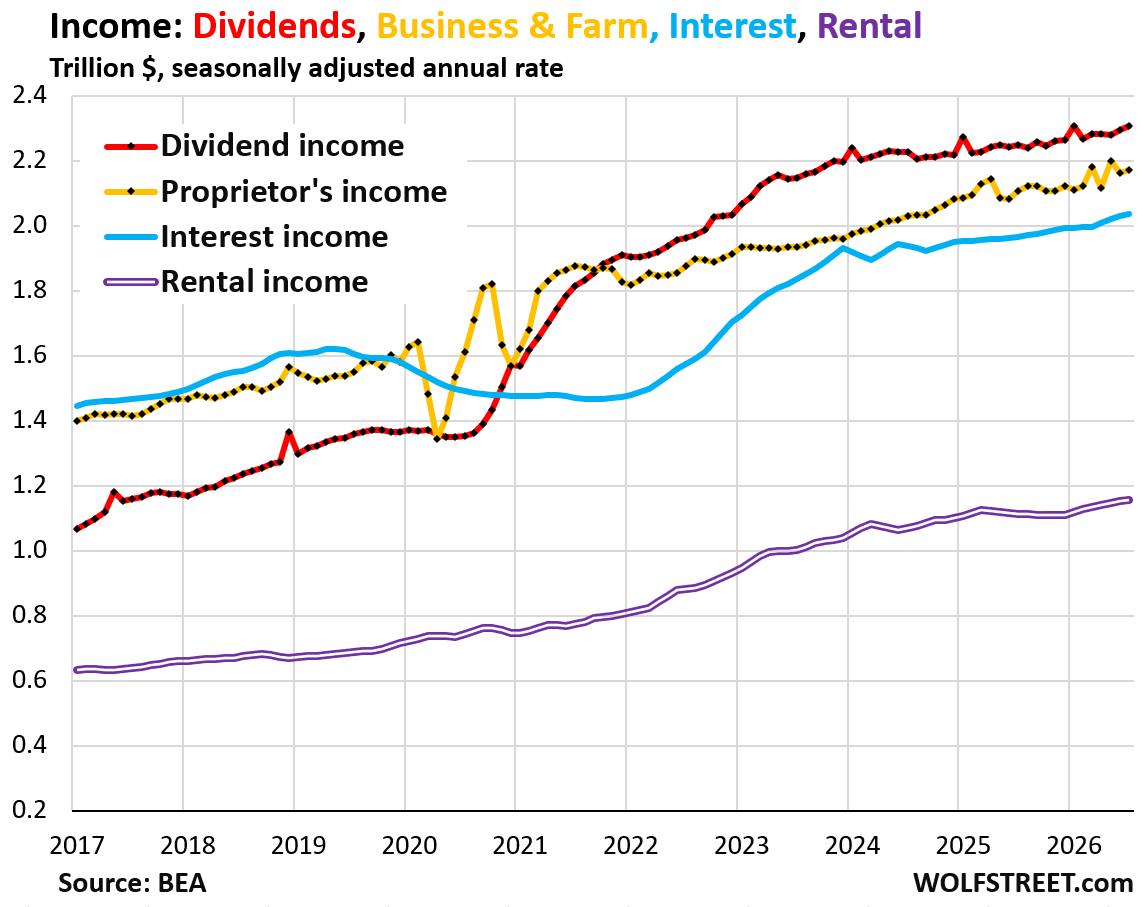
Income from other sources: Two categories are income from investments (dividend income and interest income) and two categories are from entrepreneurial endeavors: Proprietor’s income (from personally owned businesses and farms) and income from rentals.
Dividend income became #1 in this group during the stock market surge fueled by the Fed’s money printing mania in 2020 and 2021. Since January 2020, it increased by 68%.
Proprietor’s income rose by 35% since January 2020, slightly behind wages and salaries (+39%). It remained #2 in this group, but the gap between it and dividend income widened.
Interest income declined after the Fed started cutting interest rates in 2019 and then rose again when the Fed hiked rates. Since January 2020, it increased by 30%.
Rental income has increased by 60% since January 2020, a result of the massive inflation, that included soaring rents in the 2020-2022 period.
Month-to-month and year-over-year by category:
- Dividend income (red): +0.58% monthly, +3.6% YoY
- Proprietor’s income (gold): 0.50% monthly, +3.1% YoY
- Interest income (blue): +0.32% monthly, +3.6% YoY
- Rental income (purple double line): +0.33% monthly, +4.0% YoY
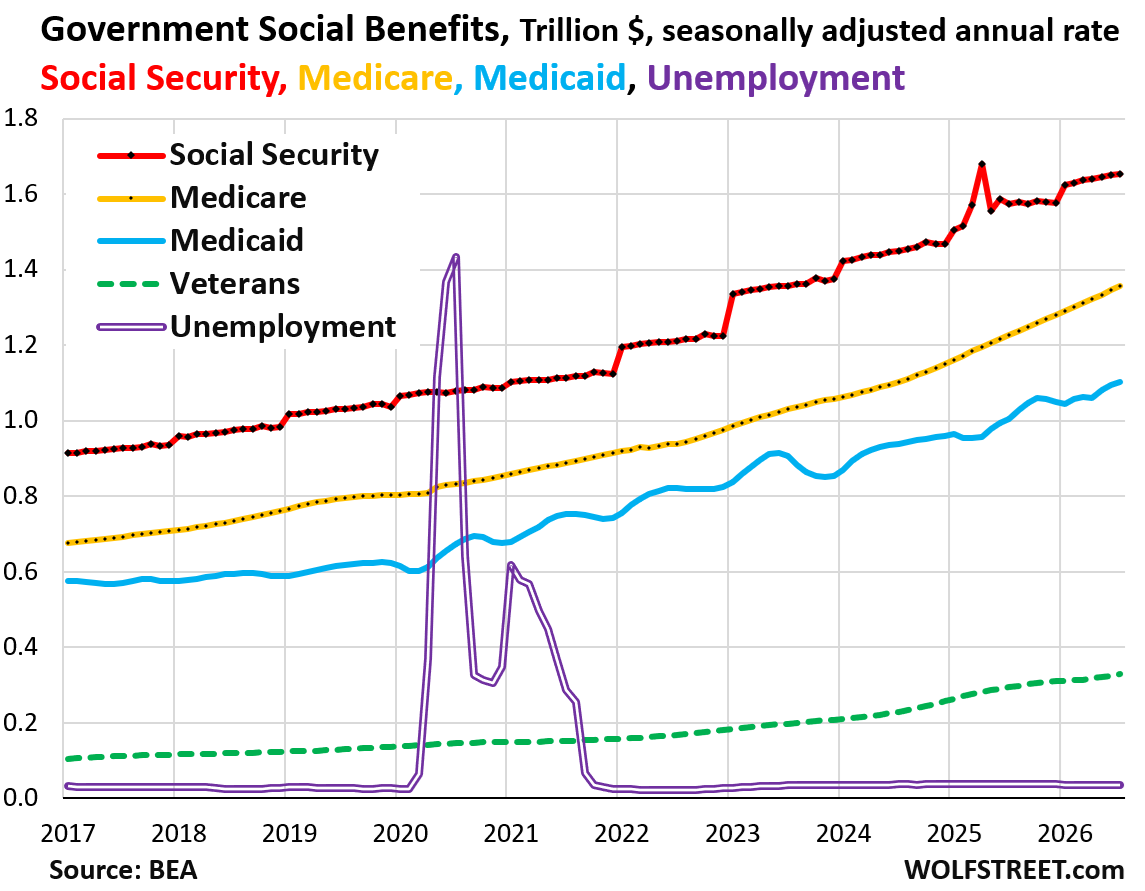
Government social benefits to persons rose by 0.59% monthly and by 5.1% year-over-year. This includes amounts that are paid directly to consumers, such as Social Security benefits and unemployment insurance benefits; and it includes amounts that are paid to service providers, such as Medicare and Medicaid, with indirect benefits going to consumers.
Medicare, Medicaid, and V.A. payments to healthcare providers soared over the past 12 months.
But unemployment insurance benefit payments fell further.
- Social Security (red): +0.20% monthly, +5.0% YoY
- Medicare (gold): +0.83% monthly, +10.5% YoY
- Medicaid (blue): +1.33% monthly, +8.5% YoY
- Veterans’ benefits (dotted green): +1.08% monthly, +11.3% YoY
- Unemployment insurance benefits (double purple): -1.7% monthly, -9.0% YoY
In case you missed it: How Americans Spent their Trillions of Inflation-Adjusted Dollars on Goods & Services and How that Changed
Enjoy reading WOLF STREET and want to support it? You can donate. I appreciate it immensely. Click on the mug to find out how:


I was wrong. I though that our economy had a fairy godmother, but apparently, its not a godmother! Musk’s alleged Magic Money Machines must be overheating by now.
you mean the expected fraud payments from govt
got it
can’t touch those – uniparty says so
Slightly bigger paychecks but even higher
inflation. It will bite eventually.
Well I would focus on the 22.1% increase in real income over a decade, but what do I know.
Good point. But look at that in context. I get the “real” part. Not sure how that has been measured.
In the same 10 year period, the dollar has lost 28% of its purchasing power (quick I-Net AI query so who knows if valid).
Interesting the flip between propertary and dividend income in 2021. Do you have any further insights on that Wolf? Do you expect it to reverse again?
I don’t know. Some thoughts:
As stocks have soared, companies have raised their dividends. So we can see that. At the same time, small personally owned businesses never have an easy ride. They’re juggling cost increases that are coming at them from all side (I can attest to that), and that they’re having trouble passing on.
A long stock market turn-down and/or a lot of uncertainty may reduce the dividend payouts.
In the outdoor power equipment ( lawn equipment) residential side people are squeezed to the max. I shifted my business over to home standby generators services. This area is tightening too, not so much on the high-end just low-end consumers.
Interest and Dividend income flipped too. What happened to cause this — even before inflation impacted interest rates? Did a change in the tax code bring this about? I thought corporations were emphasizing share buybacks rather than dividends partly to avoid double taxation of dividends.
The Fed cut policy rates to 0% in early 2020, which caused all short-term interest rates to vanish. Existing bonds and CDs continued to earn the interest rate established in prior years, but money market funds, T-bills, savings accounts, CDs, etc. went to 0% (T-bills went slightly negative even on a few occasions. That caused the dip in the blue line. Then the Fed hiked and long-term rates also rose, which cased the blue line to rise again.
It turns out that the surge in dividends (which seemed highly unusual) was due to BEA adjustments in 2023 that “found” about $200 billion in hitherto uncounted dividends and -$134 billion in overcounted interest going back to mid 2020. So, dividends went up, and interest went down starting in mid 2020. That’s when the flip occurred. So, this is mostly BEA statistical adjustment, apparently.
Are ACA subsidies counted in the transfer payments you listed, or is that yet another bucket of money? I looked around a little bit, and couldn’t find a straight answer of who pays for those.
Medicare and Medicaid increasing (no idea what Mr. Richter would assign to the increase . Baby boomers coming into SS age with numbers increasing without a substantial number leaving (death) . What I am surprised at is the large increase in Medicaid payments . Maybe the increases are directly related to medical cost increases and the large number of boomers on Medicaid that qualify for nursing home care and that number of patients is increasing as their health declines exponentially.
Demographic graying = higher healthcare expenses
My understanding is that discussions on instituting means based testing for social security payouts is pretty far along. Implementation time? 2030-32 timeframe?
Not a good time to be 20-40 years old. Future not looking bright. As the venerable Thorton Mellon once stated “live at home and let parents worry about education.”
Gen X is being their usual passive aggressive selves and not defending Social Security like the Boomers did. Boomers would utterly destroy any politician who even brought up the possibility of SS/Medicaid/Medicare cuts.
But now we live in a world where paid social media influencers have more political influence than citizen-led groups like the AARP, and so Gen X feels it is inevitable they will be the first generation to lose SS. Maybe we’ll learn to eat irony.
Thanks for showing personal income without transfer receipts. Part of those receipts, Medicare and Medicaid, and maybe some of what’s considered transfers for Veterans, is actually paid directly to health care providers. So while it’s on behalf of “persons” in a sense, it’s not money households actually see. I like leaving off all of the transfers, or at least the health care transfers, as a better economic indicator of consumer pressure.
Not my favourite source, but I have no reason to doubt the underlying statistic
“U.S. workers’ share of national income falls to a new low”
The share of capital has been rising because of automation of work that used to be done by people. Automation takes a lot of capital to install. Think of a big automated factory replacing 50,000 workers 50 years ago, or a corporate computer network replacing a gazillion jobs doing nothing but processing paper and data entry 50 years ago. The internet sped up that process, replacing numerous people-functions in retail, banking, and all around the economy with automation. That is the effect of capital replacing workers in the share of the national income.
In absolute terms, adjusted for inflation, and per capita, incomes of workers have risen substantially over this multi-decade period. Automation does do that.
Apologies — I should have left the link off and merely referenced the title.
Which was “U.S. workers’ share of national income falls to a new low”
Wolf, can you provide the slopes of each of the lines in the above graphs over the time frame of 2017 to present? (Current dollars)
It looks like income streams increased differently by different sources. The government income could be just due to demographics. As a guy in his 20s, it’s a bummer to see the slope of the income from compensation to employees looking like it’s one of the smallest in increases from 2017.