
The average weekly mortgage rate, at 6.76%, is not high historically. Inflation is high. And home prices are high.
By Wolf Richter for WOLF STREET.
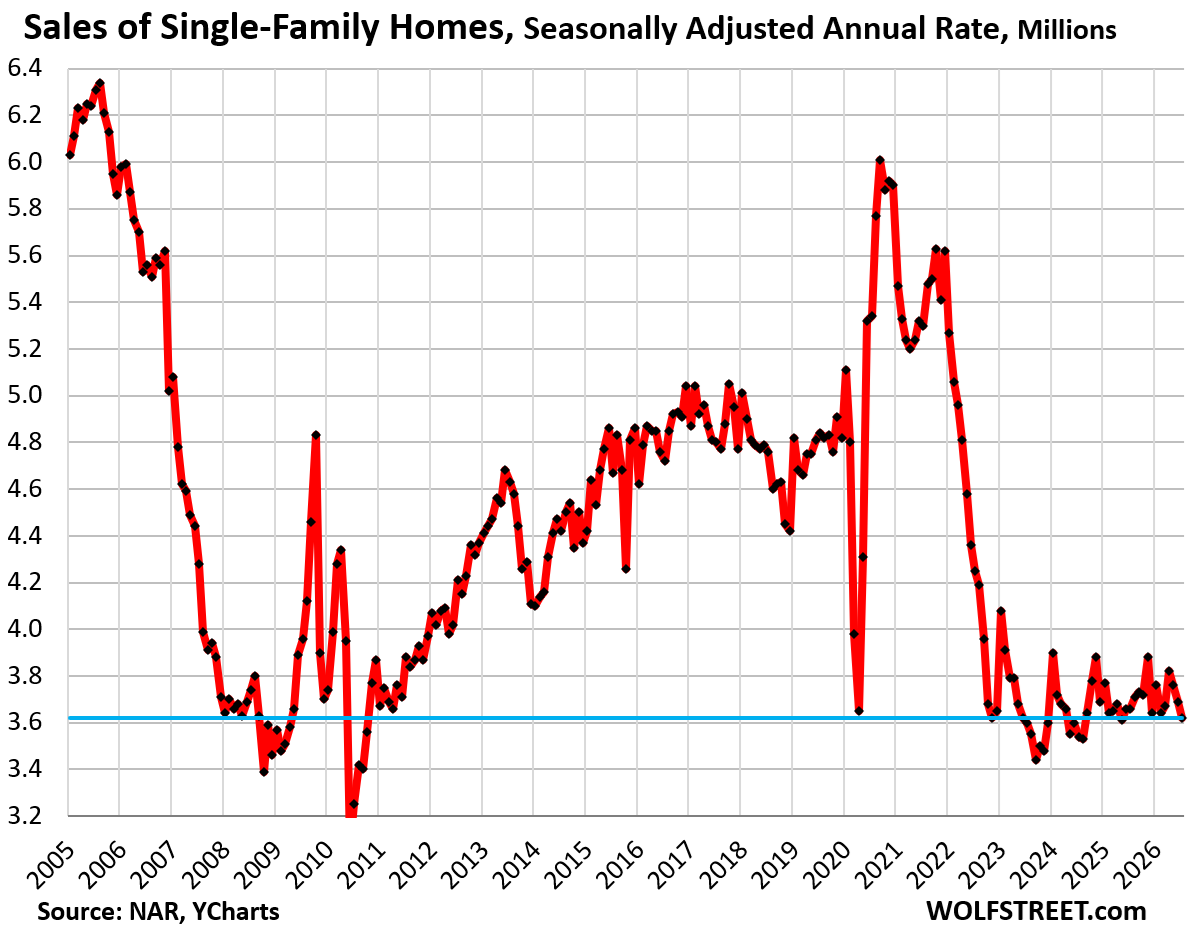
Sales of existing single-family homes fell by another 1.9% in August from July, seasonally adjusted, the third month in a row of declines, to an annual rate of just 3.62 million sales, according to data by the National Association of Realtors today.
Sales were down by 1.1% from the already crushed levels a year ago, by 25% from August 2019, by 9% from August 2009 during the Housing Bust, and by 5% from 30 years ago in August 1996, scraping along the bottom of the four-year plunge.
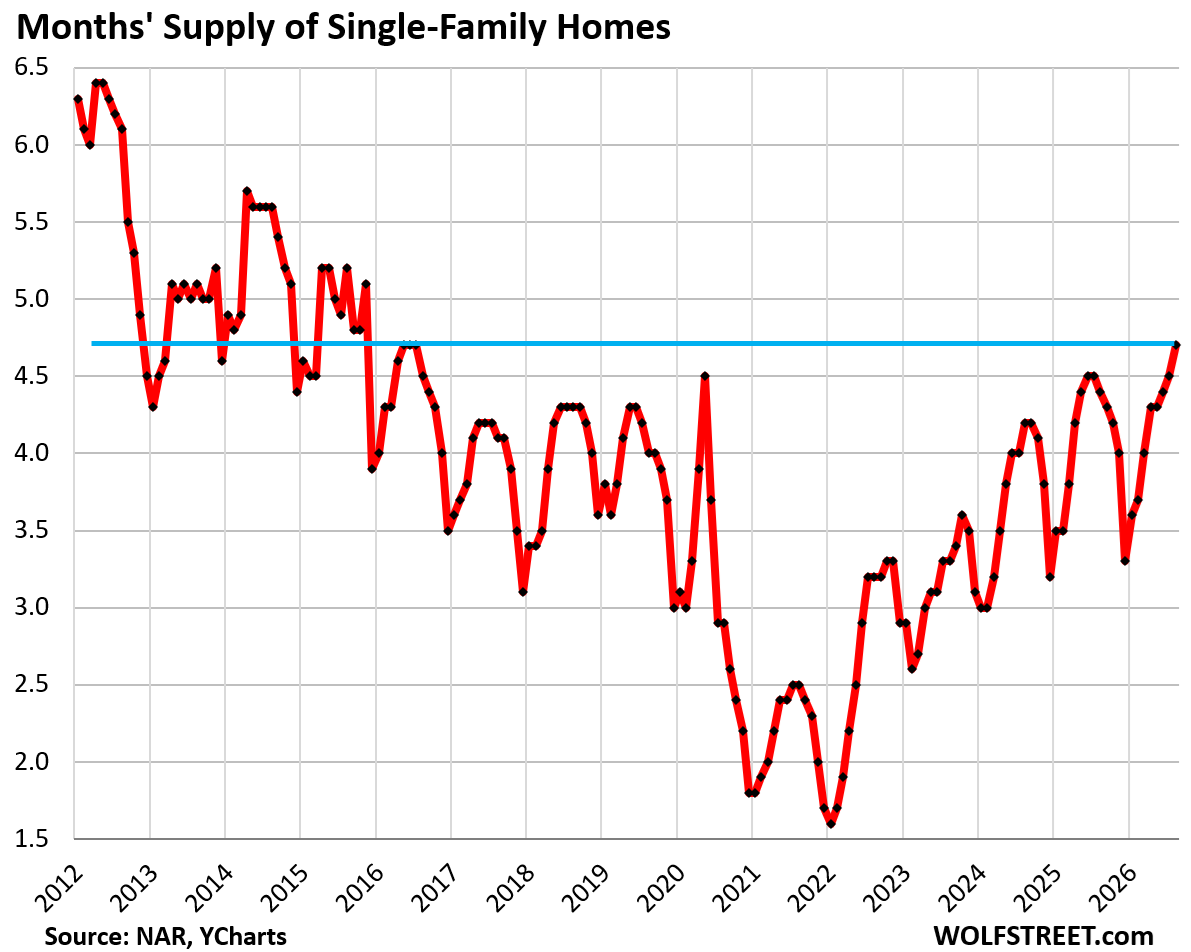
Supply of single-family homes rose to 4.7 months in August, same as in the summer of 2016, and all were the highest since November 2015.
Supply is a function of inventory and sales – how much inventory there was at month-end in relationship to sales during the month. Sales sank further, while inventories rose further to 1.42 million single-family homes for sale.
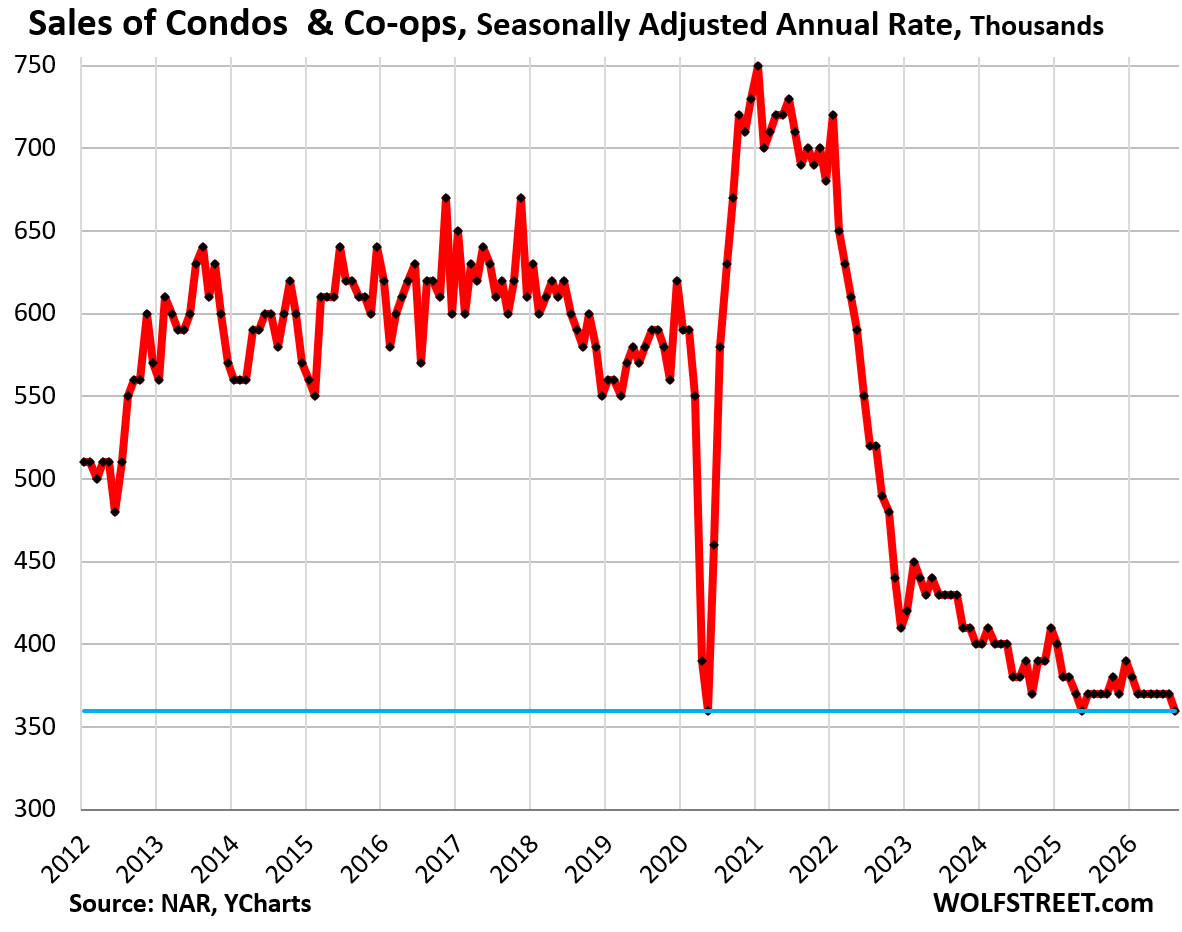
Sales of condos and co-ops fell by 2.7% in August from July, seasonally adjusted, to an annual rate of 360,000, matching the record low in the data that go back only to late 2011.
Compared to the crushed levels a year ago, sales fell by 2.7%. Compared to August 2019, sales plunged by 39%. Compared to August 2012, the first August in the data, sales plunged by 35%.
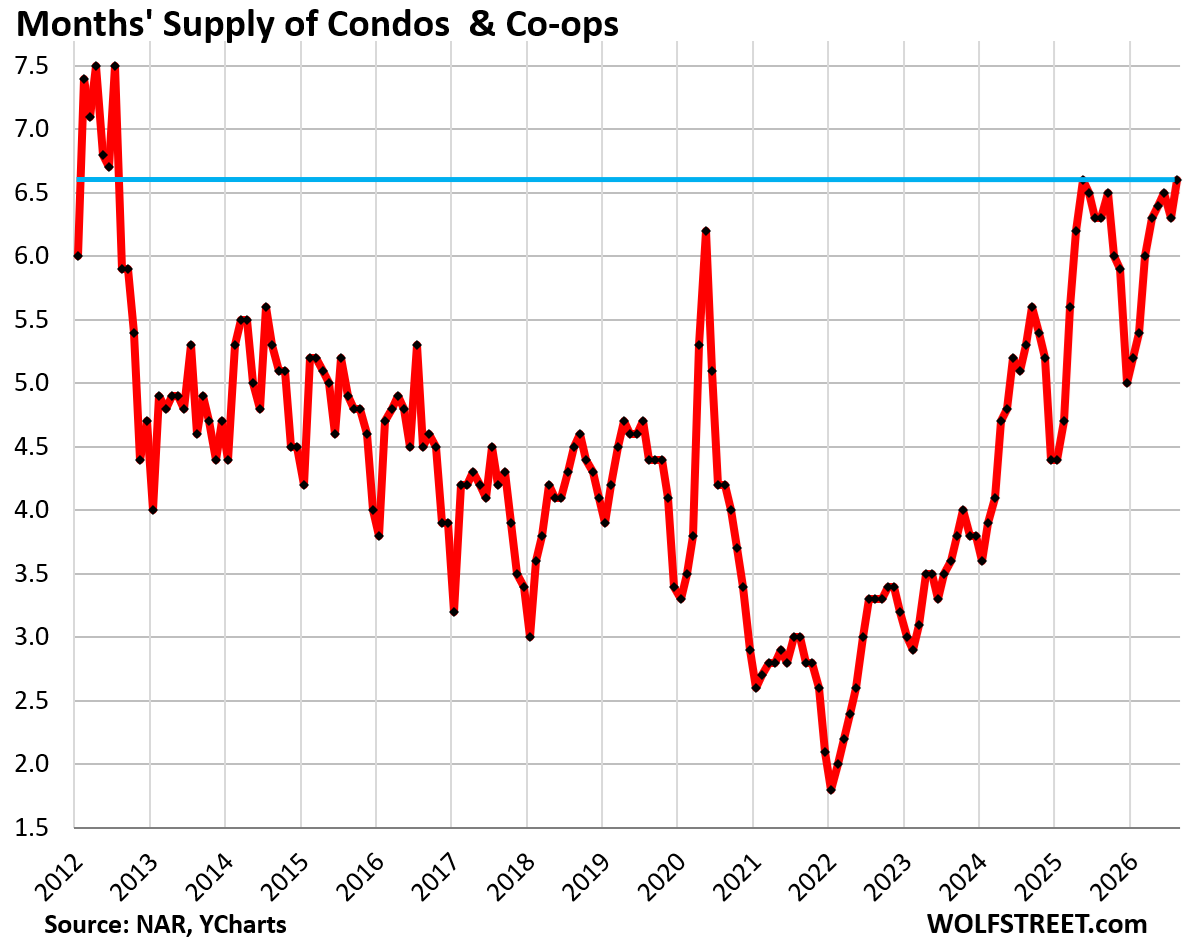
Supply of condos rose to 6.6 months, along with May 2025, the highest since 2012.
Sales by region.
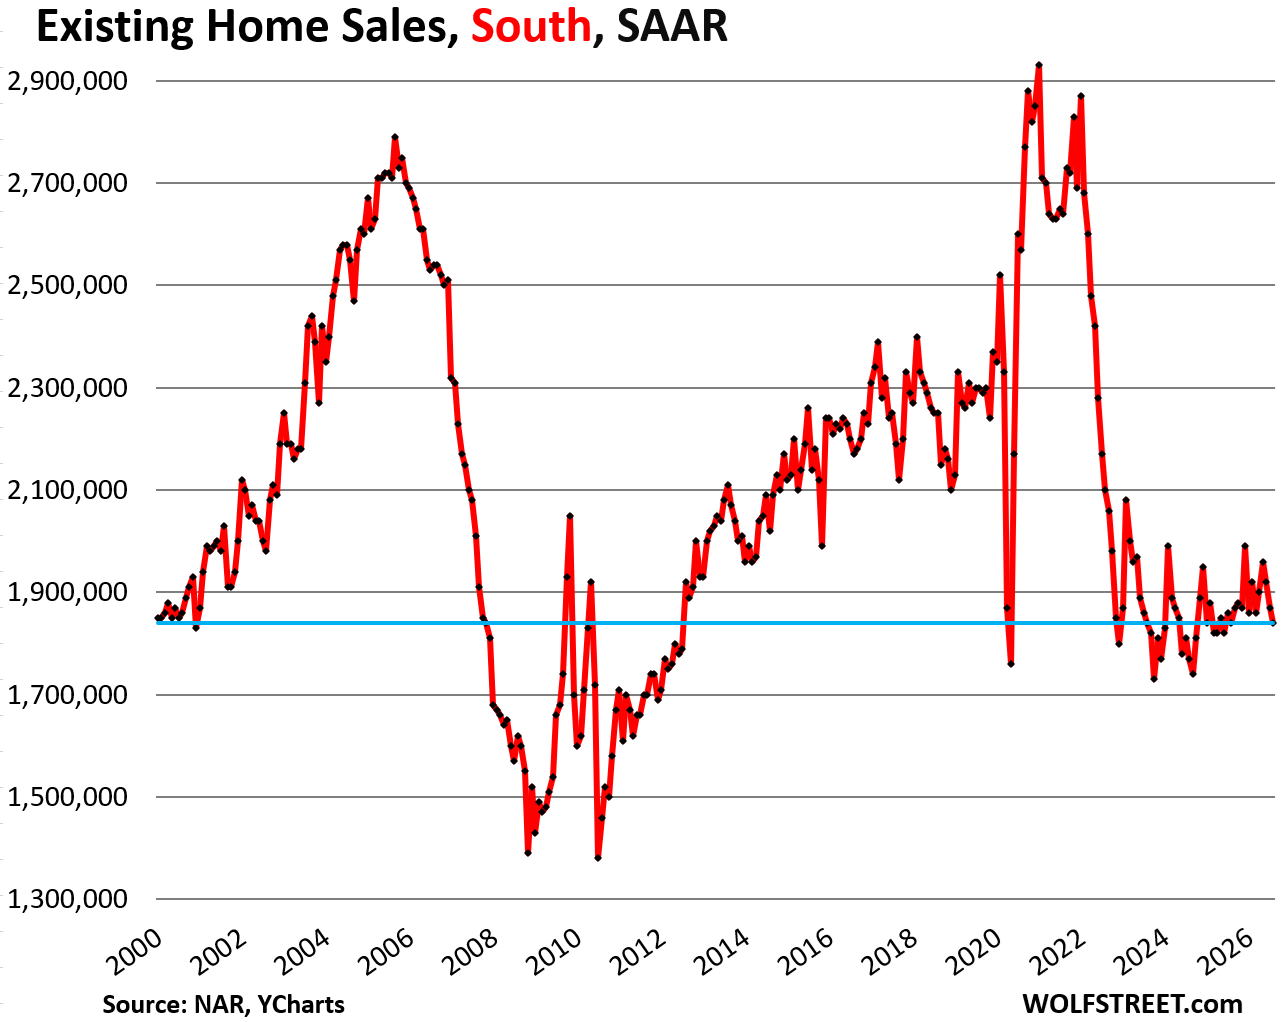
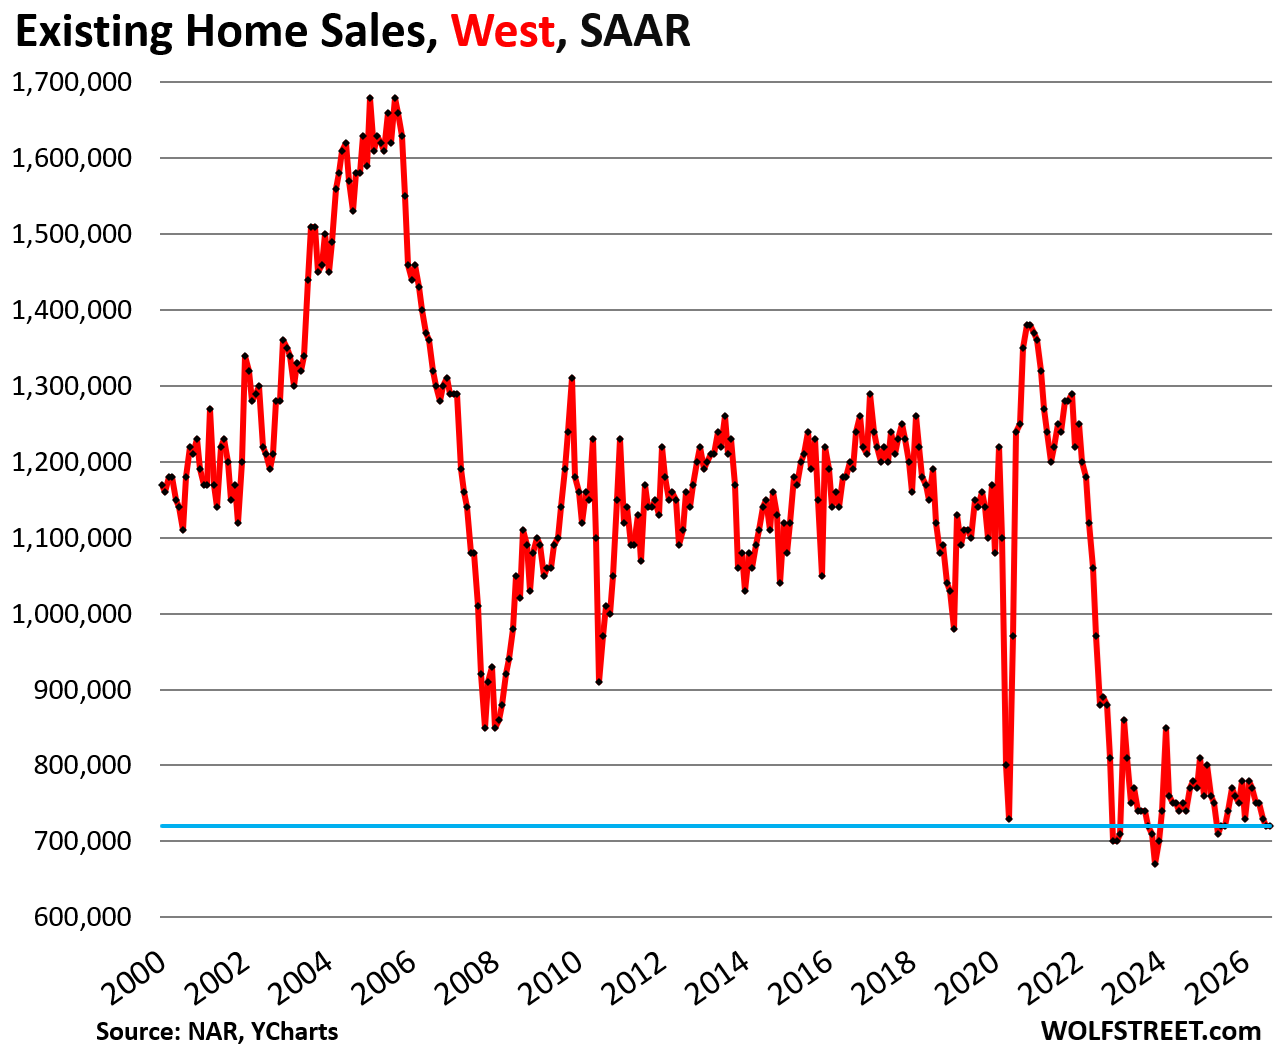
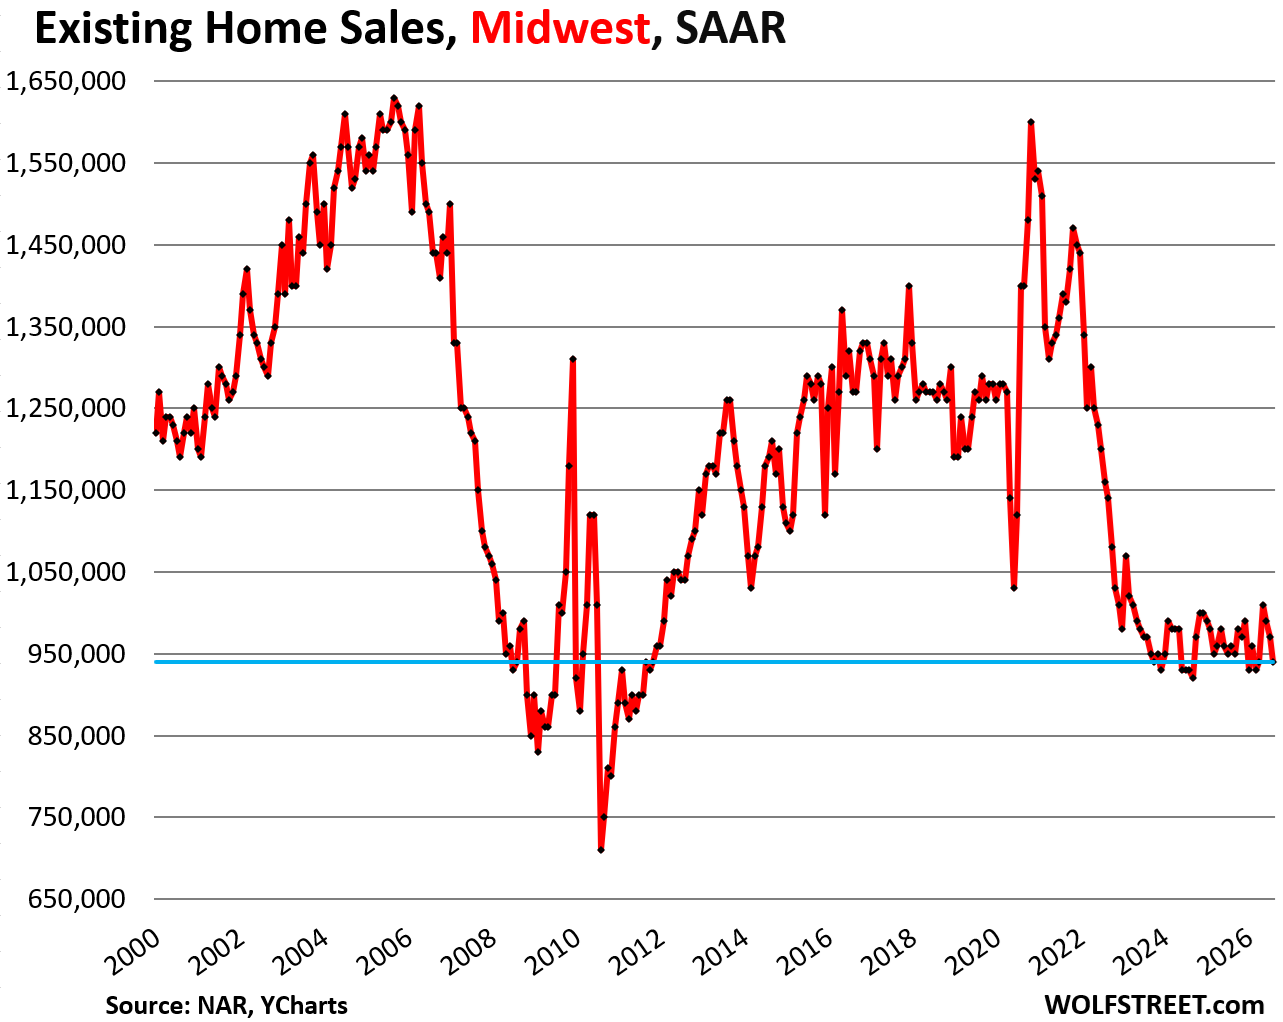
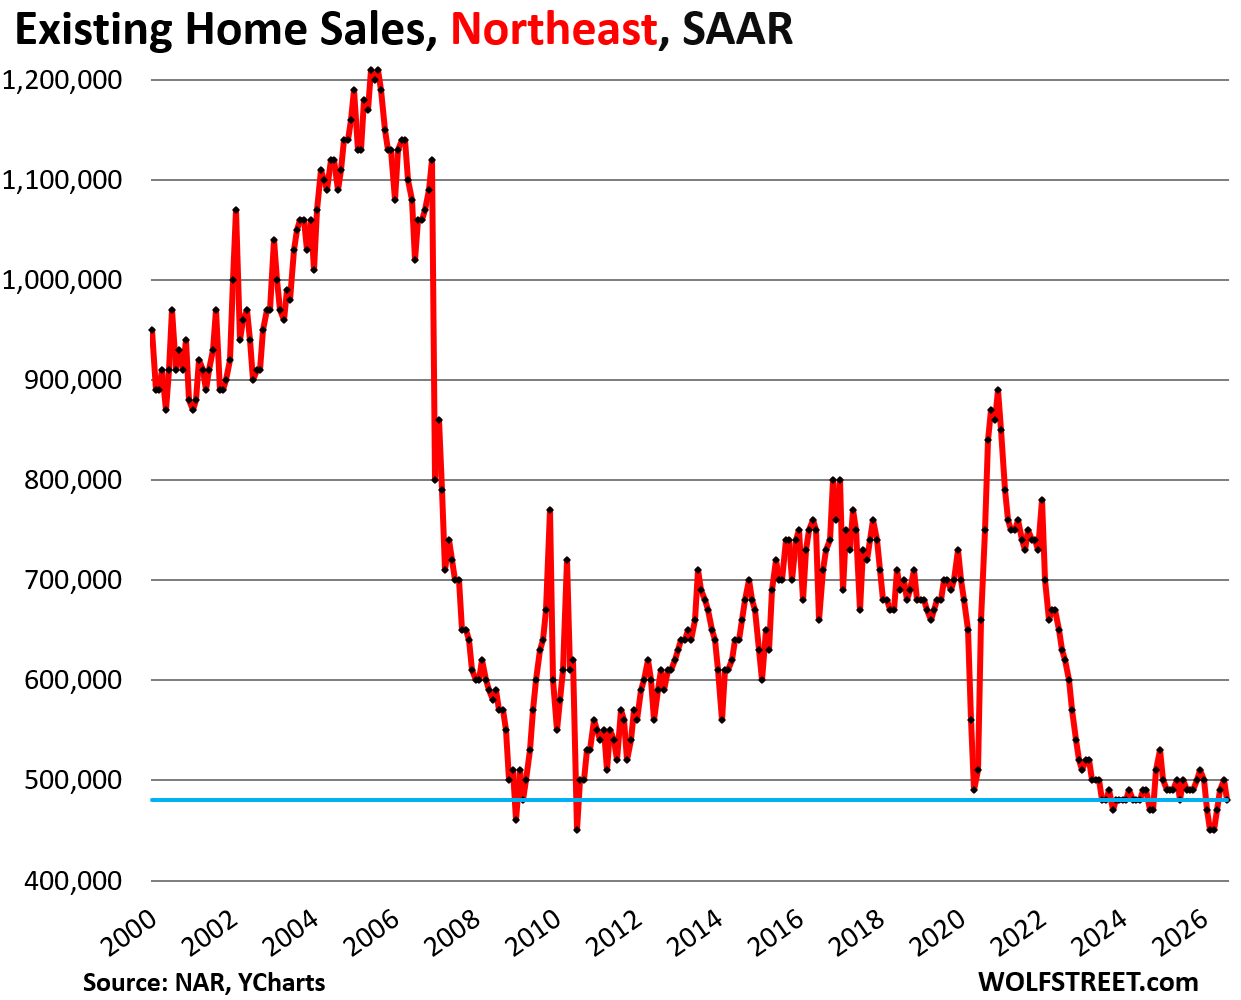
Sales of existing homes (single-family, condos, and co-ops combined) fell month-to-month in three of the four regions, and in the West was unchanged from the downwardly revised July sales. All of them near the bottom of the dumpster.
In the South, the seasonally adjusted annual rate of sales fell by 1.6% in August from July, the third month in a row of declines, to 1,840,000 homes.
Compared to August in prior years:
- 2025: 0% (year-over-year)
- 2024: +4.0%
- 2023: 0%
- 2022: -12.4%
- 2019: -20.0%
- 2018: -18.2%
In the West, the seasonally adjusted annual rate of sales was 720,000 homes, same as the downwardly revised July sales.
Compared to August in prior years:
- 2025: -2.7% (year-over-year)
- 2024: -2.7%
- 2023: -2.7%
- 2022: -19.1%
- 2019: -36.8%
- 2018: -35.7%
In the Midwest, the seasonally adjusted annual rate of sales fell 3.1%, to 940,000 homes, fourth month in a row of declines.
Compared to August in prior years:
- 2025: +2.1% (year-over-year)
- 2024: +4.3%
- 2023: 0%
- 2022: -19.2%
- 2019: -23.6%
- 2018: -23.6%
In the Northeast, the seasonally adjusted annual rate of sales fell by 4.0%, to 480,000 homes.
Compared to August in prior years:
- 2025: -2.0% (year-over-year)
- 2024: -2.0%
- 2023: 0%
- 2022: -22.6%
- 2019: -31.4%
- 2018: -31.4%
Mortgage rates are not high; inflation and home prices are high.
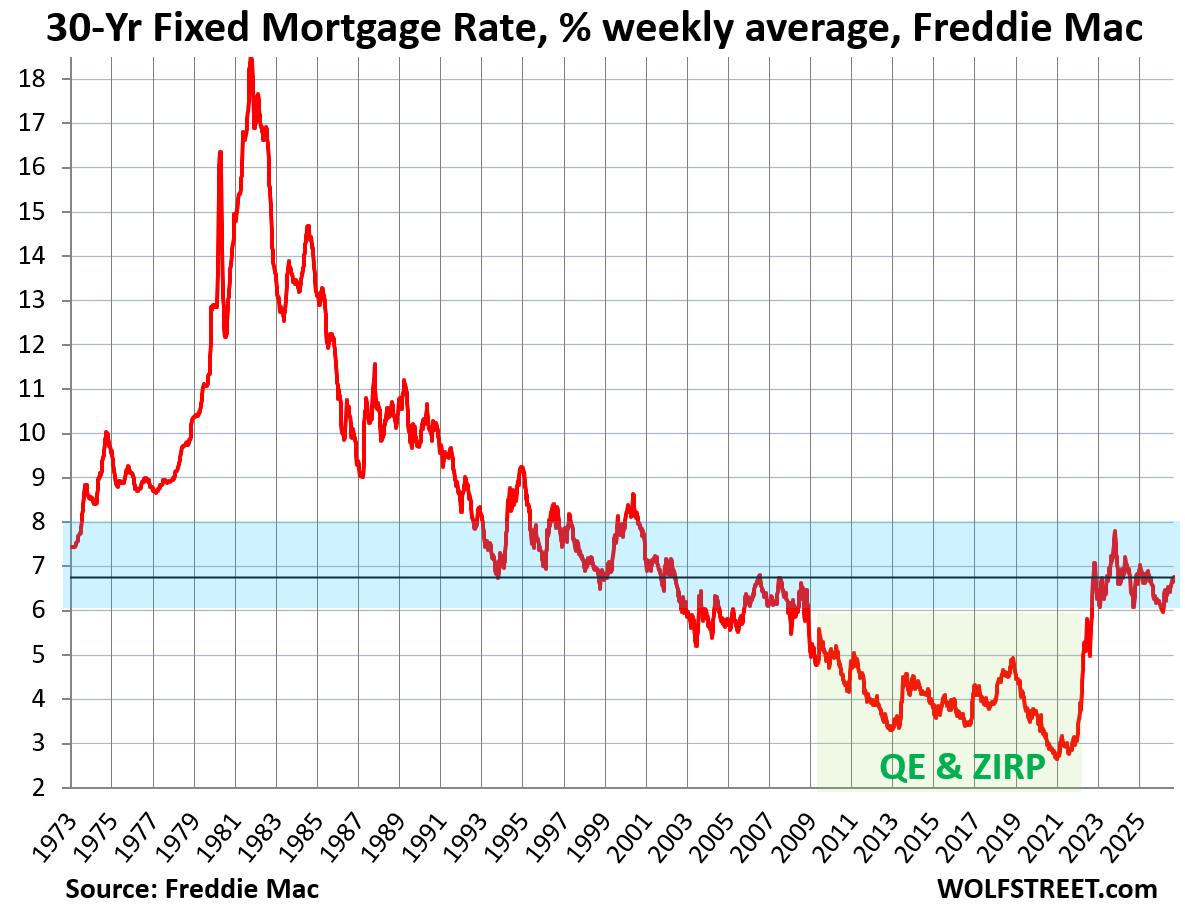
The average 30-year fixed mortgage rate rose to 6.76%, according to Freddie Mac’s weekly measure today.
In a five-decade context, mortgage rates at this level are not high. They’re only high in the context of the Fed’s financial repression that began in 2008 and – with a pause – lasted into 2022 (green box in the chart below). During this period of financial repression, the Fed bought trillions of dollars of Treasury securities and mortgage-backed securities (MBS) to repress mortgage rates and other interest rates and inflate home prices and other asset prices. This experiment ended in 2022 with the highest consumer price inflation in 40 years and a historic two-year home price explosion that has since then morphed into the “affordability crisis” and crushed home sales.
Mortgage rates in that near 7% range are at the lower end of the spectrum before the Fed’s financial repression started.
National median price v. local prices.
The national median price of single-family homes declined along seasonal patterns to $434,800 in August, not seasonally adjusted. Year-over-year, it was up by 1.7%.
The “affordability crisis” was caused by the 40% explosion of the national median price in the two years through mid-2022 that had come on top of already high prices.
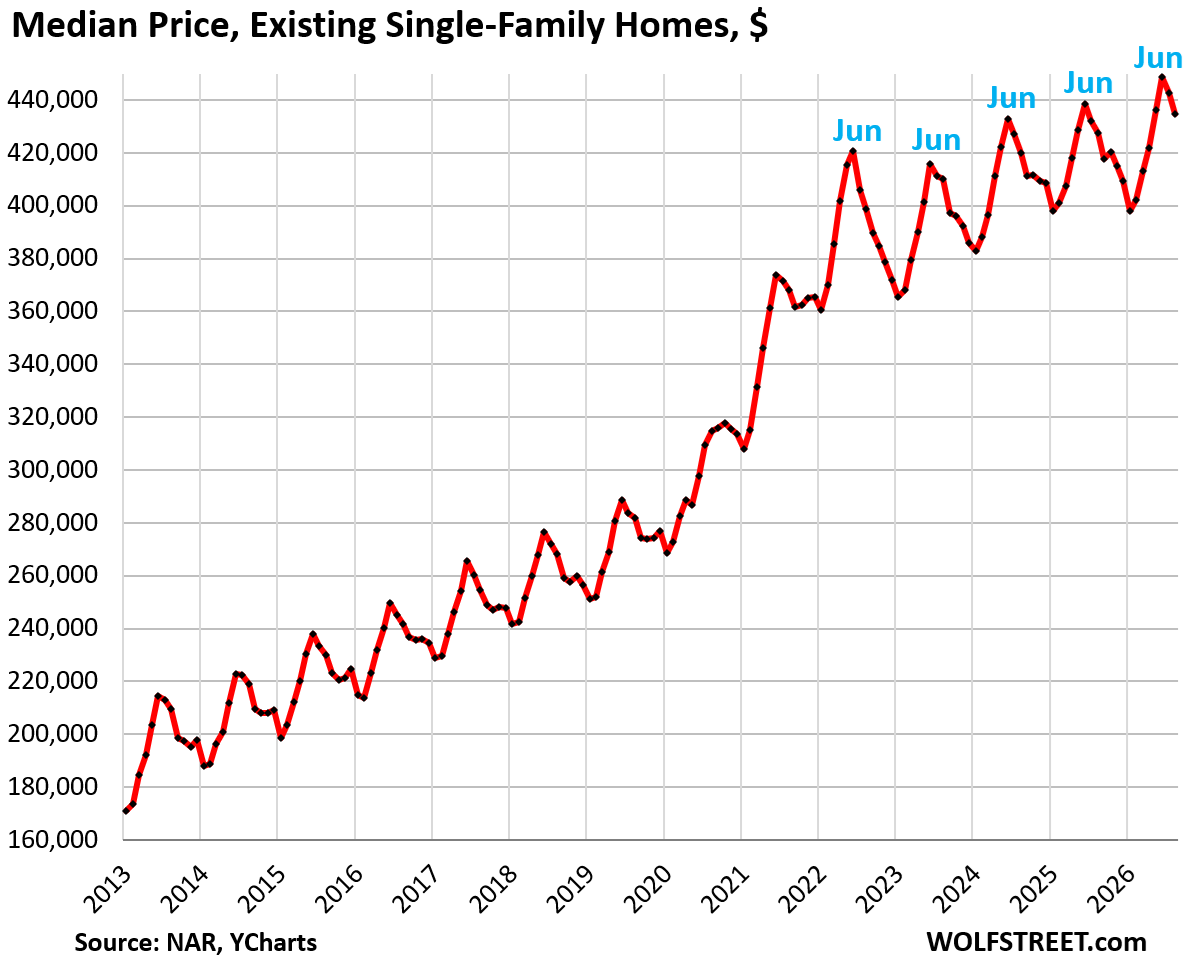
Since late 2022, national wages have increased faster than the national median price of single-family homes, thereby easing very slowly, over many years, the affordability crisis.
The price explosion ended in June 2022. Over the four-plus years since then through August:
- National median price of single-family homes: +3.3%.
- Average hourly earnings: +17.3%
- Consumer Price Index (CPI): +13.3%.
But for people buying or selling a home, the national median price is unrelated to their endeavors. What matters to them are local prices, and they vary dramatically. And in some of those markets, the affordability crisis has softened by quite a bit through the combination of rising wages and falling home prices, for example:
Prices of single-family homes fell by 11% to 26% in 15 bigger markets, including:
- Austin, TX: -26%
- Oakland, CA: -24%
- Cape Coral, FL: -22%
- New Orleans, LA: -20%
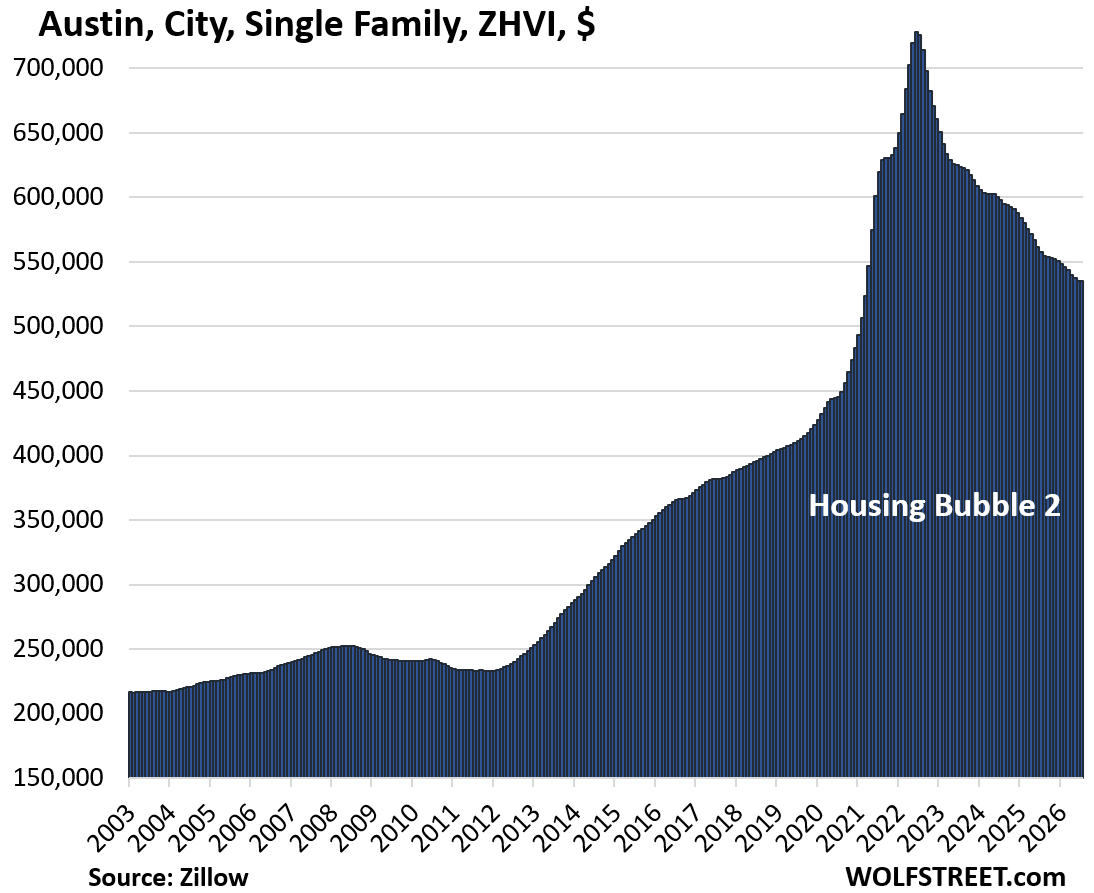
But in some other bigger cities, prices of single-family homes have continued to rise to new highs and worsened the affordability crisis. The biggest cities with the biggest year-over-year gains:
- Chicago: +4.9%
- Rochester: +4.4%
- New York City: +4.1%
- Milwaukee: +3.5%.
The national median price of condos and co-ops declined along seasonal lines in August. Year-over-year, it was up by 1.5%.
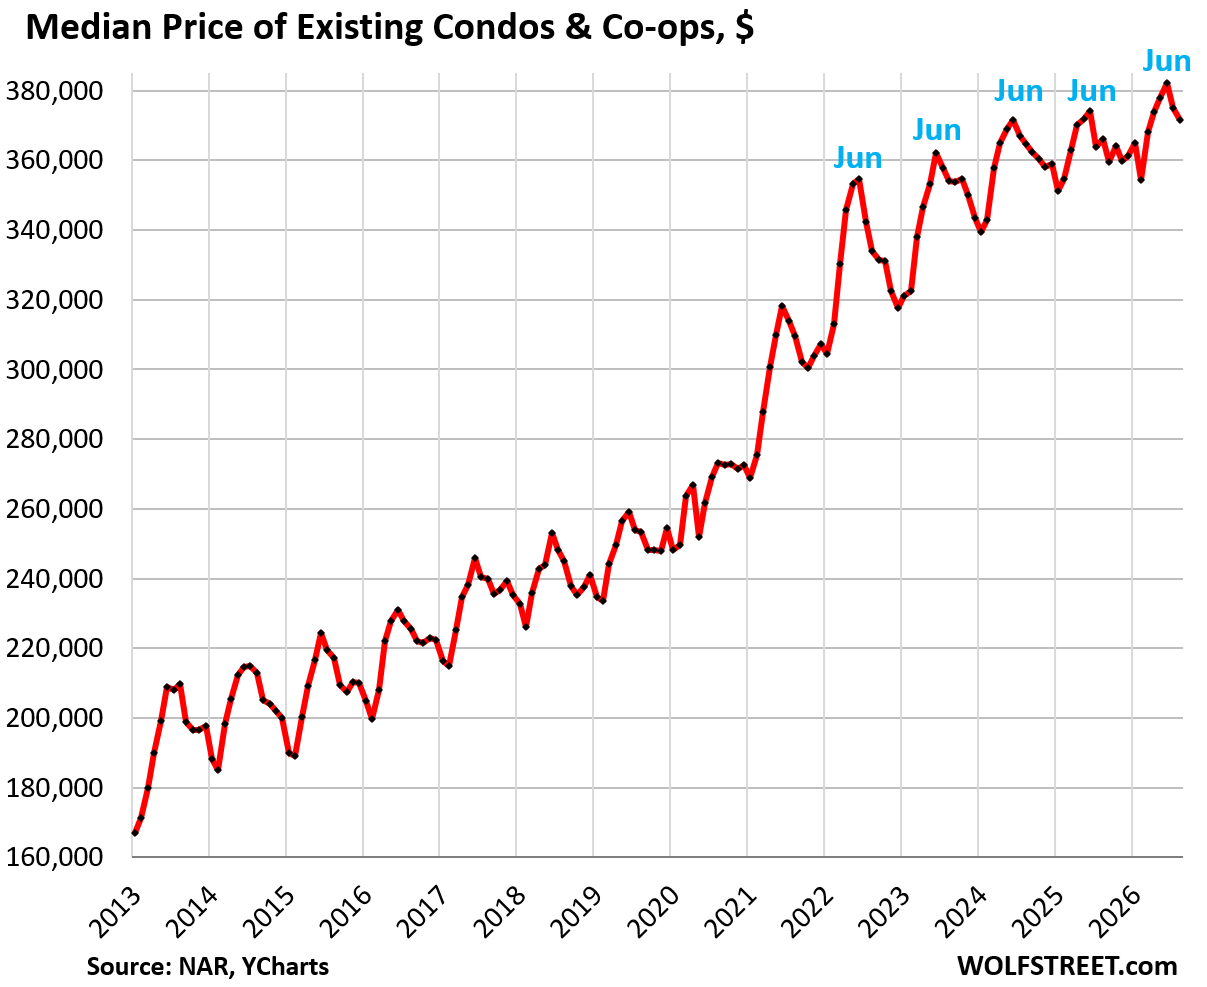
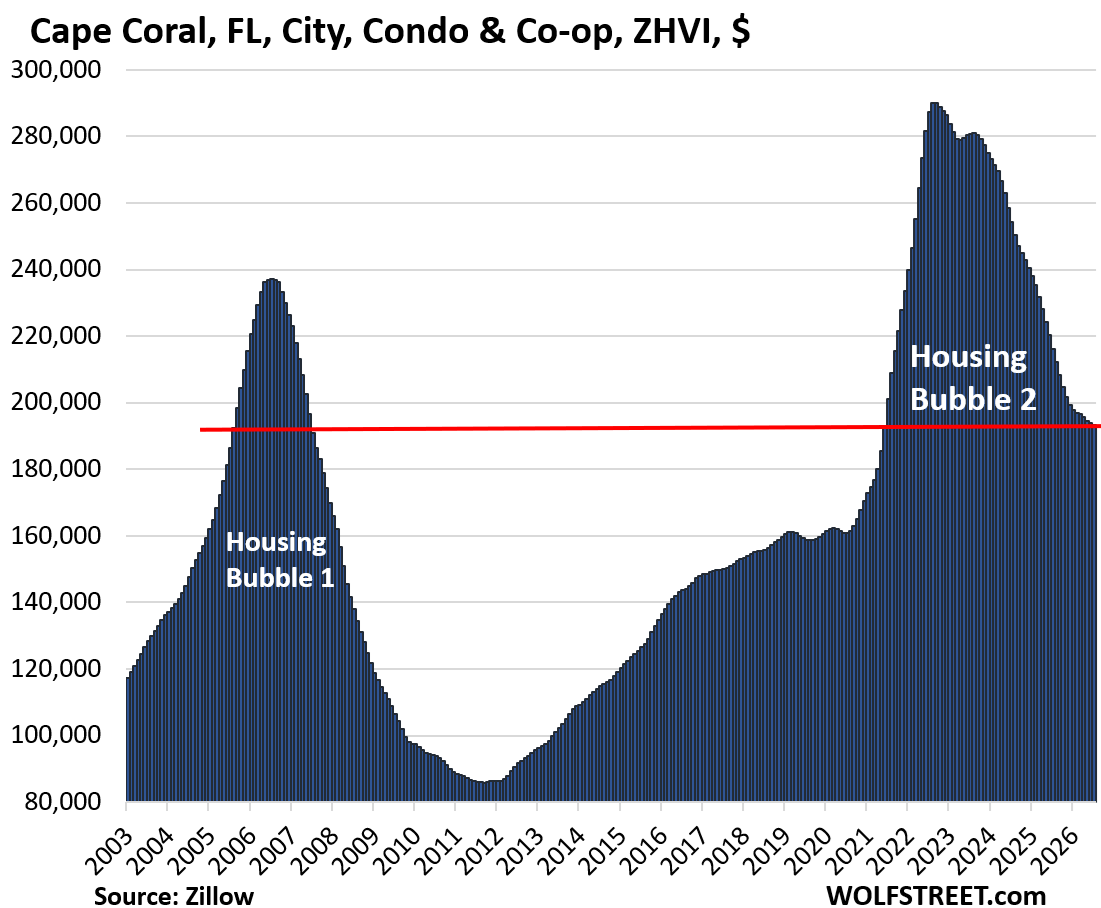
But the affordability crisis has softened substantially in many condo markets, as condo prices in those markets have taken a drubbing, including by 15% to 33% from peak in 33 bigger markets, with several dropping below their highs in 2006:
- Cape Coral, FL: -33%
- Oakland, CA: -32%
- Petersburg, Fl: -30%
- Austin, TX: -28%
- Fort Myers, FL: -27%
- Sarasota County, FL: -24%
- Garland, TX: -22%
- Tampa, FL: -21%.
See my analysis of condo prices with 33 charts: Oh Dear, Condo Prices Fell by 15% to 33% in 33 Bigger Markets, Some Below 2006 Levels, as Historic Condo Bubbles Deflate.
The national median condo price is just about irrelevant to condo buyers and sellers anywhere. Cape Coral, for example:
In case you missed it: What the Infamous “Inventory Shortage” Looks like: Inventory of New Single-Family Homes Jumps, Prices Drop to Lowest since 2021, Sales Sag
Enjoy reading WOLF STREET and want to support it? You can donate. I appreciate it immensely. Click on the mug to find out how:


I listed my home in Hawaii last month because I’m ready to move to be closer to family. Started at $1.6 and had a lot of interest but no offers. I saw the writing on the wall and decided to cut $150K off the price to move it. Got an all cash offer and closing in a week.
Inventory is back to pre covid levels and it seems like people are figuring out that things don’t always go up so they’re trying to get out.
It will be interesting to see how this plays out. I think there were lots of speculators who missed the covid run up still gambling in 2023/2024 since they believed inflation would be tamed, the fed would cut rates, mortgage rates would go lower, and they could then sell for a profit. We know how that is playing out right now.
Also, I had a 2.5% conventional loan. I’d rather get a root canal with no drugs than be a landlord.
Your comment about being a landlord is spot on. Got taken for a ride during COVID.
Another 50% down and I will start buying condos.
I’m willing to buy a condo, but only if the HOA is well funded with ample reserves to prevent special assessments and no amenities where service inflation could cause dues to increase too quickly.
This made me howl!
That is exactly what our condo community had. We sold for a great price and moved to a 55+ community
Back at 7% mortgage rates. Some real damage being done to mortgage investors this week.
My sister’s best friend has a condo in ft Myers worth about 300k Zillow value. It’s a 2 bed 2 bath maybe about 1100 sq foot box, not on the end so zero side windows.
The HOA, hold your horses now, $2000 a month. I am sure there is also a community development district tax also, but that goes on the property tax.
Oh, and don’t forget the 700 a quarter minimum food and beverage tab.
This place was totally wiped out in the hurricane, first floor.
Only an insane moron would buy this for a penny over 100k, and then it’s a stretch.
How is the HOA higher then renting such a place, its crazy.
Damn, my entire mortgage + T&I escrow is just over $1k and she’s paying twice as much for an HOA?
Meanwhile, I’m getting a 3BR SFH on a quarter acre lot with no risk from fires, floods, or hurricane winds.
But hey, I’m not on the beach am I? Which is why I only pay $1k per year for homeowner’s insurance. Guess I have to mow the lawn too, don’t I?
I think the formula for getting wealthy has shifted to NOT owning a home. Let one of these cash-flow-negative HGTV-educated amateur landlords subsidize you.
“The “affordability crisis” was caused by the 40% explosion of the national median price in the two years through mid-2022 that had come on top of already high prices.”
Well not entirely. We can thank the Fed, as usual, for creating the affordability crisis starting with Bernanke and Yellens QE, ZIRP and negative real interest rates.
Its time the the financial press came down hard on the real culprits.
Read the article. You’re misrepresenting what I said, one of the seven deadly sins of commenting. This is what I said:
In a five-decade context, mortgage rates at this level are not high. They’re only high in the context of the Fed’s financial repression that began in 2008 and – with a pause – lasted into 2022 (green box in the chart below). During this period of financial repression, the Fed bought trillions of dollars of Treasury securities and mortgage-backed securities (MBS) to repress mortgage rates and other interest rates and inflate home prices and other asset prices. This experiment ended in 2022 with the highest consumer price inflation in 40 years and a historic two-year home price explosion that has since then morphed into the “affordability crisis” and crushed home sales.
If it started with Bernanke and Yellen, why were prices affordable between 2009-2020? That’s a long time to say “it just hadn’t kicked in yet.”
MW: The 30-year mortgage rate just crossed 7% for the first time in over a year
Assuming you’re in SoCal like me…I’m amazed that prices have remained so sticky out here. Prices have remained completely out of sync with wages since 2022. You’d think 7% mortgages would do the trick but sellers haven’t capitulated. Yet.
The Fed’s monetary distortion of buying Treasuries and MBS allowed the entire world to refinance at generationally low rates and term out maturities. Everybody took advantage except the one that needed to most which was the US Treasury. Not terming out the debt may be the biggest blunder in Treasury history.
This frozen housing market will not thaw for decades unless there is forced sellers. No teaser mortgages this time around, all are 30 year fixed
They had 12 trillion in debt before they added the next 28 trillion during low rates. The rate isn’t the problem, the deficit is. Liberals spend money and don’t pretend they want to pay for it. Conservatives spend more money and cut taxes while telling you they care about the budget. They both spend while they trick us into fighting against one another. The. We pretend we are smart on message boards. Bread and circuses.
Janet Yellen will forever go down in history as the worst U.S Treasury Secretary because she was responsible for not taking the opportunity to refinance trillions of dollars of U.S. debt at all time low interest rates at long term maturities. Instead, she chose to refinance expiring debt into short-term maturities that as they have come due, are having to be refinanced at dramatically higher interest rates. That woman has cost taxpayers trillions of dollars in interest on the national debt over the next 30 years through her sheer incompetence.
If she had done that, banks would have had to buy those 30-year bonds, trillions of dollars of them, and maybe 1,000 banks would have collapsed because of it, instead of 3, when yields rose from 2022 forward. It was probably a wise thing to do. Those 30-year bonds sold in 2020 and 2021 became massively toxic. The 2020 vintage has lost over half their value.
Isn’t this exactly what Bessent is doing today? Playing “operation twist” to force the government to borrow at short term yields when, by all indications, yields are going to be rising soon?
Will we in 5 years be wishing Bessent had sold more 20-30 year bonds back when the yield was only 5.2% to 5.5%?
Lol. Yeah, it’s her fault. “That woman”. Not the men who ran up the debt. She should have refinanced. Lol. You probably still think Republicans are fiscally conservative.
It astonishes me that people haven’t realized that the Republican Party has been taken over by conservative socialists. The Reaganites have all been purged.
This Time Is Different: Eight Centuries of Financial Folly by Carmen Reinhart and Kenneth Rogoff proves that financial crises are recurring, predictable patterns rather than isolated, unique. Core PremiseThe illusion: Societies frequently convince themselves that “this time is different” because of new technologies, modern financial systems, or era-specific growth. The reality: Financial meltdowns, banking panics, and sovereign defaults are universal rites of passage across both emerging and developed markets. The authors [analyze eight centuries of financial data across 66 countries to show that debt-fueled booms always share the same underlying mechanisms
Finally, an article where I agree with most of the analysis. I live in SW Florida and Cape Coral is right next door to me. The real-estate market is a bloodbath over there. Not only are existing homes being heavily discounted, but they are competing with new homes where builders are offering financial incentives and helping with financing. I have lived in this area for over 9 years and taxes keep rising, insurance has shot through the roof and the general cost of living continues to rise. The last part is being supercharged by an unnecessary war in the middle-east. High fuel prices mean that anything that is transported is also going to increase in price. The supermarket is where the tire hits that pavement. Affordability is not just tied to home prices or interest rates, but the ability to eat, work and maintain a certain lifestyle.
When I bought my first house in 1989 up in the lovely state of Maryland, I was paying 10.5% on a 30 year loan. It was a starter home and I barely qualified. However, it was the first stepping stone to my next 4 houses including my current retirement home in Fort Myers, which I paid off a few years ago after financing it for 15 years at 3.99%. I don’t know if such low rates will come again in my lifetime, but they were the result of the Treasury and the US Government interfering in the bond markets during the pandemic.
Those 2.99% rates offered during the pandemic to keep our economy from collapsing will never be back. They were an artificial boost to the housing market and other forms of long-term loans. They were an historical aberration. Bite the bullet, buy a house and begin building wealth. Cheers.
Why would people buy now?
I can rent for significantly less than the interest expense and property taxes on a comparable property. I also have no maintenance costs. No requirements to keep it up to date to hold it’s value. If I need to relocate, I just can. I can also reinvest the difference in the stock market which my portfolio has been doing an annualized 20% or so the last 7 years. I also can make 4% in treasuries on my 20% down payment which is about 10k a year.
You’d have to be financially illiterate to buy at current prices in a lot of markets right now. Housing was an one point a great builder of wealth 2000-2022, prior to that it was seen as a terrible investment returning 2-3% a year while you were spending 7% on a mortgage.
A lot of people are way too attached to the paper money (i.e. zillow value) making them feel rich. Unrealized gains aren’t real money.
^ THIS.
A whole generation is about to learn that home ownership has become as much as a boondogle as the crushing debts they sign people up for at the car dealerships. The people who build wealth over the next 20 years will be in small apartments with big IRAs.
There are still lots of amateur HGTV-educated landlords out there willing to go cash-flow negative subsidizing your housing because they think losing money is hedging inflation. Rip them off whenever possible.
Also every idiot with a $1M house thinks they’re rich. Thing is if you sell you have to buy another $1M house. Same thing would happen if your house was $300k. All that happens is you pay more in property taxes and home owners insurance.
The only time housing gains matter is in you had investment properties you sell and don’t replace. 1:1 housing transactions are a wash.
This is different than my NVDIA stock which I can sell for cash because I don’t have to live in it or a similarly priced asset.
Yes, lifestyle creep works this way. But the problem is that your salary is close to the same whether you live in a $1M house, a $300k house, or a rented studio apartment in a sketchy neighborhood. Of the 3 living arrangements described above, the studio apartment dweller will be able to build up the most wealth because they will be able to save and invest more.
This is partly true, but many baby boomers with home equity over a million are moving to areas where homes are much cheaper. Cities in New Mexico and Arizona for example.
Agree, my first mortgage was 7.75% but how much lower can the price of existing homes go? surely with inflation the cost of building a new home has also gone up. Would price of existing homes go down below the cost of building a new one?
Lennar, possibly by now the #1 builder in the US, shows what can be done:
If people / builders would build more 2BR/1BA homes on 50ft wide lots, as was the middle class standard for generations in America, then the price would be very reasonable. Most people don’t have large families anymore, and most homeowners are over 40, so simpler homes represent less waste in every way. Today, we see single people and couples who plan to stay childless buying 4 bedrooms and 2 baths – for what? Of course it’s unaffordable to waste resources in this way. It always was unaffordable. The difference is that people in the past chose financial prosperity over a roofline that looks like a mountain range.
Agree.
Essentially 20 years of ZIRP horribly distorted the housing market, especially what got built.
I’m sure the Fed geniuses of 2003 assumed that slicing interest rates in half would lead to an explosion of SFH home-building/home-building employment as SFH prices kept more or less steady and monthly mtgs fell by half too.
But that isn’t what happened…and continued to not happen for the next 20 years.
While the Fed remained absolutely brain dead at the switch.
Instead, it became the Golden Age for half-wit SFH speculators (wholly ignorant of what was going on in every other part of the macro-economy) and McMansions for McMorons.
Instead of constant SFH prices and halved monthly mortgages, we got 20 years of doubling SFH prices (even as wages uttely stagnated in the face of China), constant monthly mortgage pmts, and specalutive tap dancing in a mine field.
Well done, Fed.
Just imagine the chaos is we didn’t have a centrally mis-managed economy.
I wonder if there is a bit of link between slow housing turnover and low job turnover? If you are worried you can’t sell your house you might be less willing to change jobs and vice versa if your not changing jobs you don’t need to sell/buy a house.
I have often thought the same thing. Also, if you change jobs for a big pay raise, it will often entail moving to an area that is higher in cost of living (and higher home prices, higher property taxes, etc.).
Also, companies that help employees with moving expenses upon a transfer could be minimizing such transfers due to the large increases in moving costs and other relocation expenses.
How’s the great Dave Ramsey advice of “marry the house, date the rate” is working out..
I know the AI bubble is keeping our GDP positive, but eventually the low home sales will drag the US negative. Need prices to come down so transactions get back to normal levels.
Doc is waiting to buy the dip in Oakland. Waiting it out till I see a bounce in the data the mighta consider buying somewhere near the redwoods.