
But the fundamentals for the bond market – inflation, supply of new debt – are as ugly as before, or even uglier.
By Wolf Richter for WOLF STREET.
The week was rough for stocks, particularly Friday, particularly for tech stocks involved in the AI investment boom, and super-particularly for semiconductor stocks. On Friday, the PHLX Semiconductor Sector index [SOX] plunged by 10.7%. For the whole week, it plunged by 17.1%. And it’s down by 43% from its peak in June.
There was quite a bit of fear, especially in the tech stock circus, and we saw that in various ways as I discussed here, including in the “haven trade,” where scared investors sold stocks and bought longer-term Treasury securities to move their money into safety.
Prices of longer-term Treasuries jumped on Friday, and Treasury yields plunged, as the sell-off in the stock market – but also in gold, silver, and crypto – took on momentum, and as frazzled investors sold stocks and bid up Treasury securities, after having already done so over the prior four days.
The drop in yields during the week reversed a portion of the big spike in yields during the prior week.
But the fundamentals are as ugly as ever.
Inflation looked as bad as the week before, maybe worse. On Tuesday, November 17, data on import prices were released. Import prices spiked across a broad range of manufactured goods – and exploded for electronics, driven in part by the AI investment boom – throwing more inflation fuel on the fire.
Going into the week, we already knew that CPI inflation was running at 4.0%, as reported on November 10, which had caused Treasury yields to spike; and that the PPI inflation rate accelerated to 6.5%. That’s the inflation that businesses face, and they’ll try to pass it on, plus some.
The second wave of inflation is shaping up before our eyes, and the bond market knows it. But it didn’t matter over the past five days because stocks were careening lower, and investors were selling stocks, creating selling-pressure in the stock market. And they were buying Treasuries, creating buying-pressure in the bond market, and bond prices rose, and yields fell, and to heck with inflation, we’ll worry about that later, or whatever.
In terms of the tsunami of new debt coming at the bond market that bond investors have to buy, there was no improvement either, but ominous signs of things getting worse on the budget front, and the bond market front:
Several ideas for stimulus checks have been floated for the new Democrat-run Congress next year, to cover the rising toll of inflation. Stimulus checks, on top of the already hot economy (lots of inflation, lots of nominal economic growth) would be devastating: They would accelerate inflation and thereby further accelerate the rising toll of inflation. We already learned that during the rounds of stimulus checks in 2020 and 2021: when money is free, prices don’t matter, and prices explode. Plus, stimulus checks would cause issuance of new debt to surge even more to fund that scheme.
Whether or not stimulus checks get even close to reality is kind of irrelevant at the moment. What matters is what zany thinking the bond market will be up against.
And one more thing: If the stock market selloff is deep enough and long enough, it will reduce capital gains tax revenues early next year, and that would have to be replaced by issuing even more new debt.
Nothing over the past five days indicated any kind of favorable development for Treasury securities. Everything pointed to even higher inflation and even more supply of new debt.
But those fundamentals didn’t matter at all during the week, they were thrown out the window, to heck with inflation and supply, what mattered was the stock market selloff – and the haven trade.
All yields beyond the 3-month yield fell during the week.
But at the very short end of the Treasury yield curve, the 1-month to 3-month yields rose as buyers and sellers solidified their expectations of a 25-basis-point rate hike by the Fed at its December FOMC meeting.
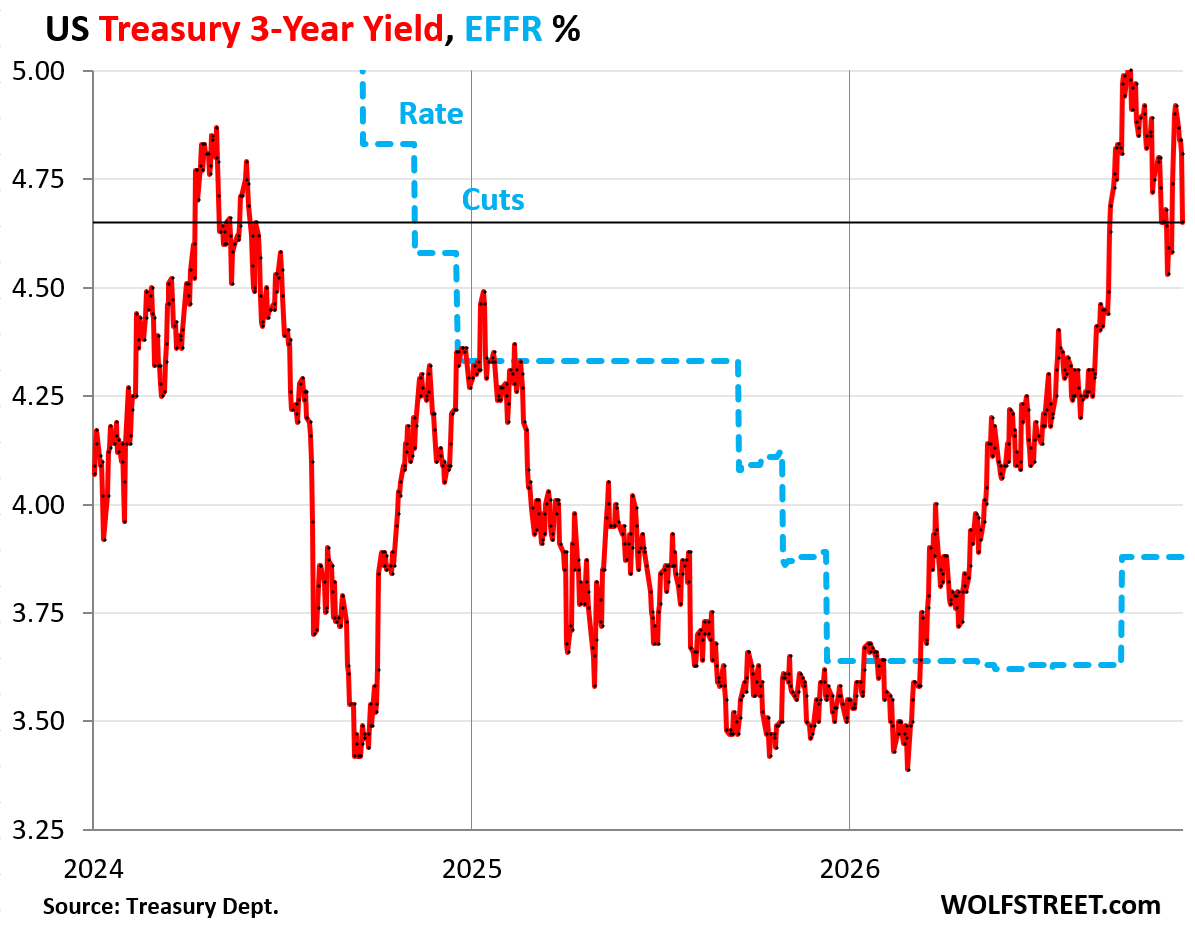
The 3-year and 5-year Treasury yields dropped by about 22 basis points during the week, the biggest yield-drops for the week across the yield curve.
On Friday alone, their yields plunged by 16 basis points intraday, before turning around mid-afternoon and heading higher again, as the fear trade had begun to abate later in the day, and by the end of the day were down 13 basis points.
But in the prior week, those yields had risen by about 34 basis points, a fairly steep selloff in these Treasury maturities. So the rally over the past five days undid about two-thirds of the selloff in the prior week.
The combination of the yield spike in the prior week and the subsequent drop over the past five days stand out in this three-year timeframe.
The dotted blue line represents the Effective Federal Funds Rate (EFFR), which the Fed targets with its short-term policy rates.

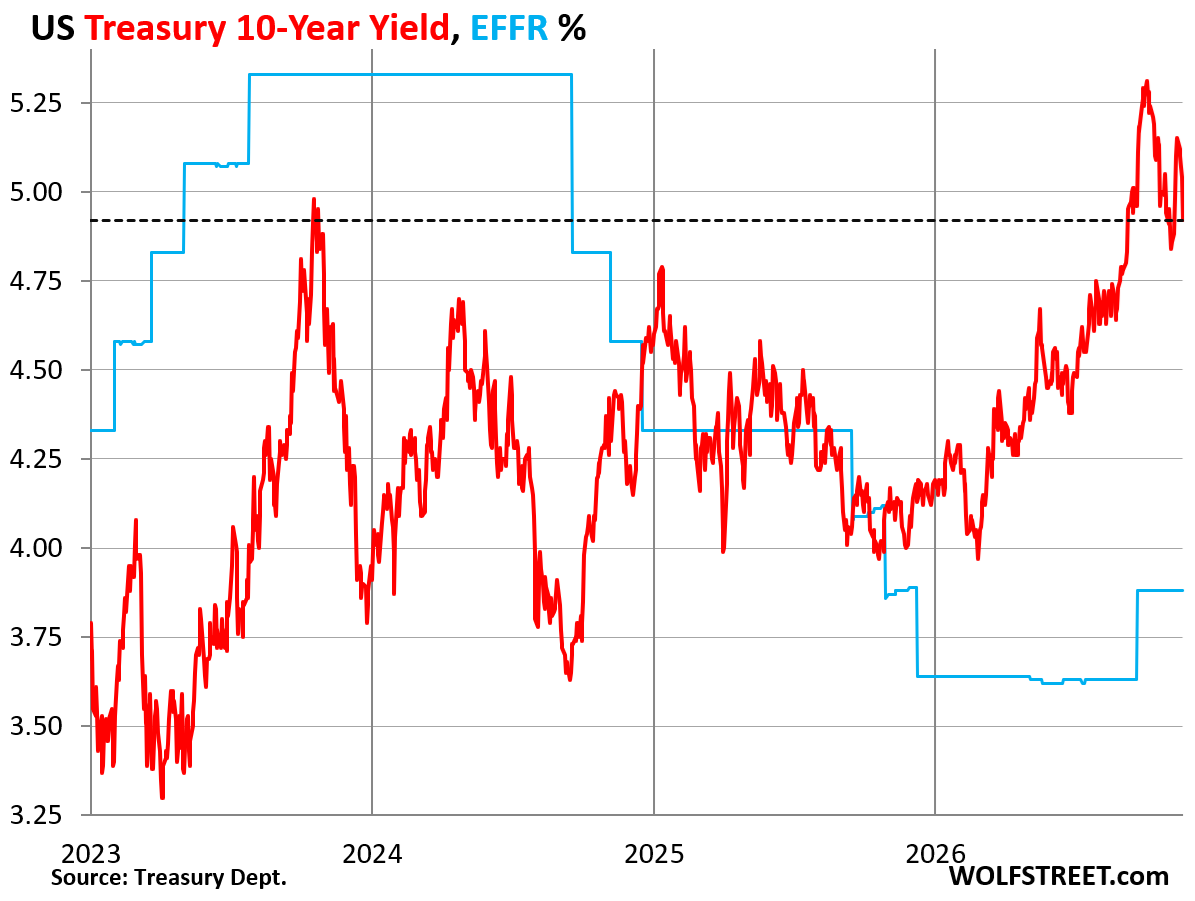
The 10-Year Treasury yield plunged on Friday by as much as 14 basis points to 4.90% intraday, before turning around mid-afternoon and rising again as the fear trade was abating, and ending the day at 4.95%. For the whole week, it dropped by 20 basis points.
But in the prior week, the 10-year yield had risen 29 basis points, and those last five days knocked about two-thirds of it back off.
There was a 20-year Treasury bond auction on Wednesday, November 18, at the beginning of this rally. Early in the morning, hours before the auction, the 20-year yield was still over 5.50%. Then before the auction, the yield began to fall.
At the auction, the 20-year bonds were sold at a yield of 5.46%. Intraday on Friday, the 20-year yield fell as low as 5.34%, before rising again as the fear-trade was abating.
And it ended at 5.38%, down about 15 basis points for the week. In the prior week, the 20-year had risen by 23 basis points.
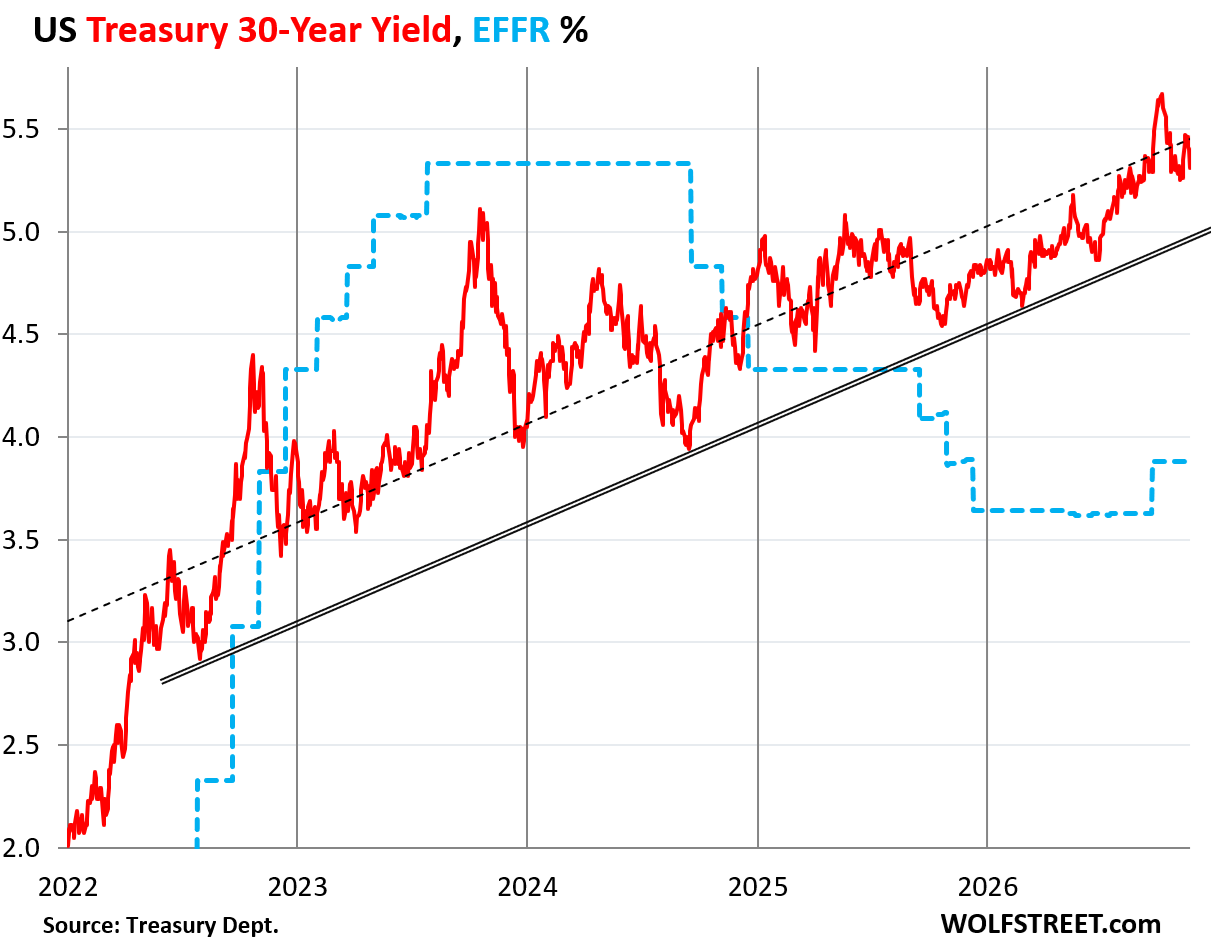
The 30-year Treasury yield fell by about 15 basis points during the week, after having risen by 21 basis points in the prior week.
On Friday, it had fallen as low as 5.29% by mid-afternoon, but then, as the fear-trade was abating, it rose again and ended the day at 5.34%.
The trend higher remains intact. The black double-line connects the lowest lows since mid-2022. Every single rally (when yields dropped) was defeated at or before the black double-line, and yields then snapped back. The two recent rallies, the first through November 5 and the second through Friday didn’t get anywhere near the double-black line.
The trend line (dotted black line) reflects the yields in the time frame of the chart going back to 2022.
By mid-afternoon, the haven trade was over.
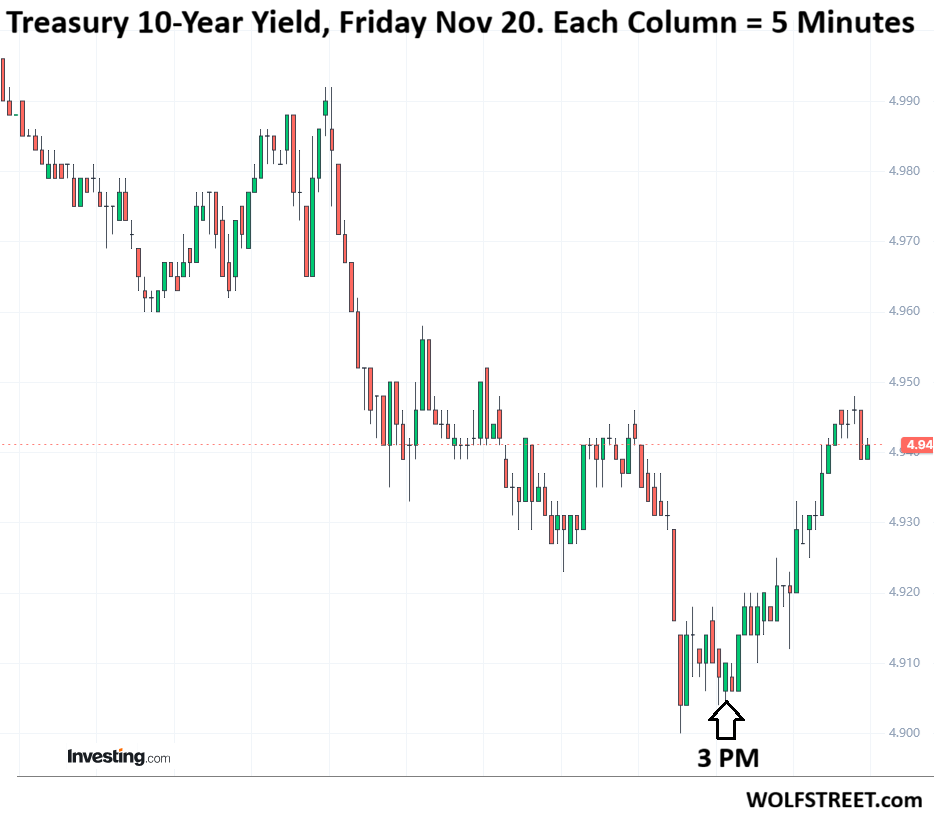
All long-term Treasury yields turned around mid-afternoon on Friday, after sharply dropping during the earlier part of the day and in the prior days. At that point, Friday at around 2:30 PM, the haven-trade rally had run out of fuel, and yields rose again by about 4 to 5 basis points before the end of the day.
For example, the 10-year Treasury yield hit the low for the day at about 2: 30 PM, stayed around there for a while, and starting at 3 PM took off and rose about 5 basis points by the end of the day.
The chart below (via Investing.com) shows the 10-year yield on Friday from 6 AM through the end of the day, in 5-minute increments (each column represents 5 minutes).
In market situations like these, bond market fundamentals are out the window, and trading reverts to haven demand, which is a classic short-term bond market function.
It’s also a pretty good measure of the ebb and flow of fear in the stock market.
Enjoy reading WOLF STREET and want to support it? You can donate. I appreciate it immensely. Click on the mug to find out how: