
Upward revisions pushed prior month-to-month PPI readings off the chart.
By Wolf Richter for WOLF STREET.
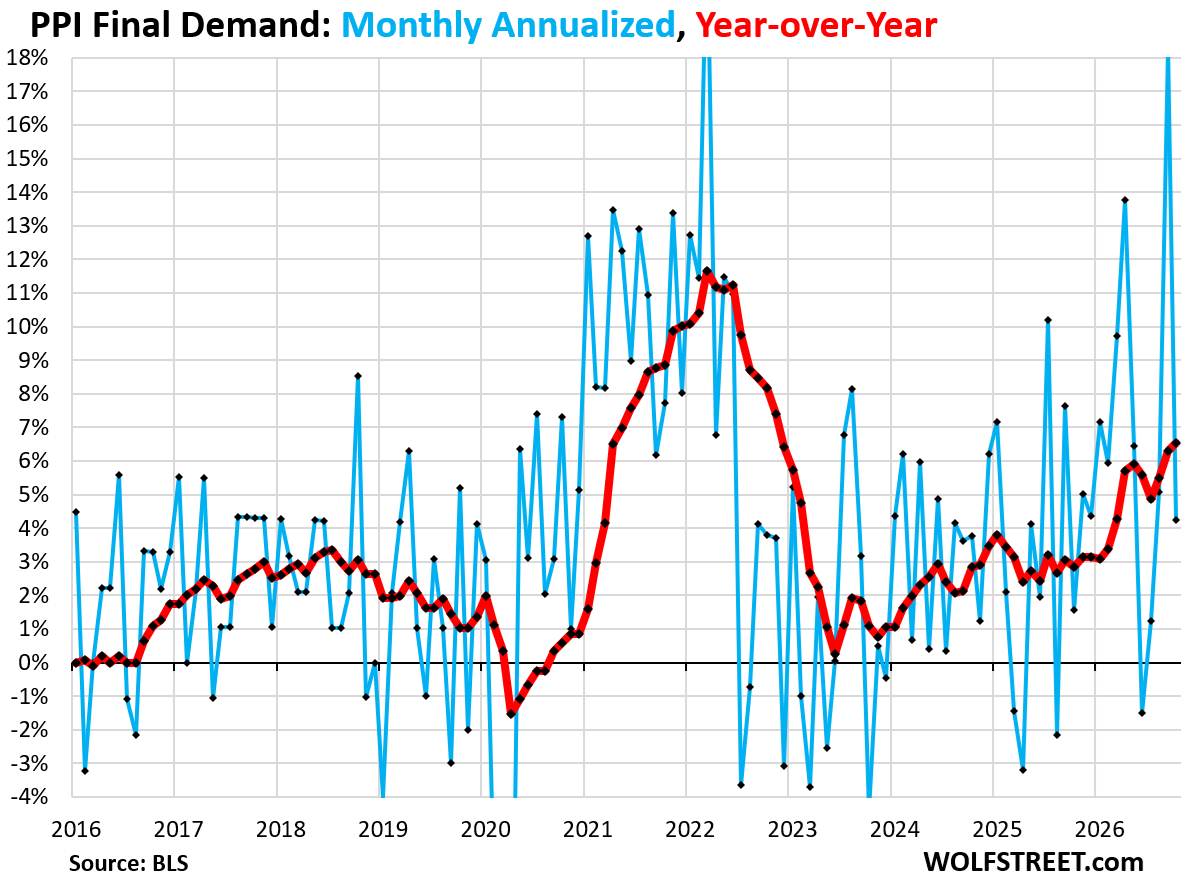
Inflation in prices that businesses face – tracked by the Producer Price Index (PPI) final demand – accelerated to 6.5% year-over-year in October, the worst inflation for businesses since November 2022 (red in the chart). It has accelerated in its zigzag manner since the low point in mid-2023, during which time the Fed has cut its policy rates as if to encourage this process.
The prior month-to-month increase (for September) was revised up to +1.41% (+18.3% annualized) from the originally reported +1.3% (+17.4% annualized) and pushed it off the chart (blue line in the chart).
In October, the month-to-month increase of 0.35% (+4.3% annualized) came on top of the off-the-chart increase in September, as per the data released by the Bureau of Labor Statistics today.
Services that businesses buy account for 68% of the overall PPI. In October, inflation in services accelerated to 5.0% year-over-year. Inflation in core goods accelerated to 5.2%, worst since January 2023. Energy inflation spiked by 36.8%. Prices of foods that businesses buy, such as manufacturers of packaged foods, rose by 1.7% year-over-year, but ominously spiked month-to-month for the second month in a row. The “core” PPI, which excludes food and energy, accelerated slightly to 5.0% year-over-year, the worst since December 2022.
Inflation has been far worse for businesses (6.5% year-over-year) than for consumers, though inflation has also been heating up for consumers, with the Consumer Price Index accelerating to +4.0% year-over-year in October.
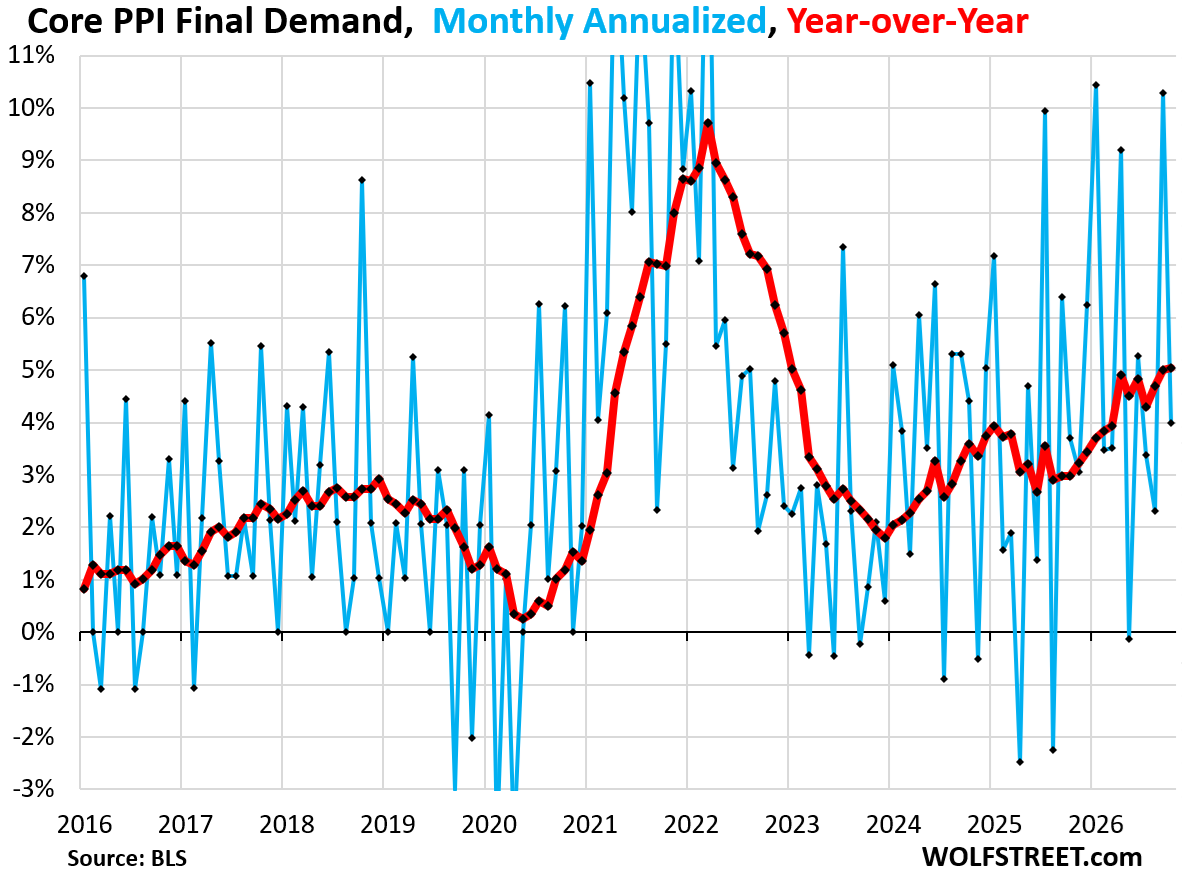
Core PPI Final Demand, which reflects the overall PPI minus the energy and food components, accelerated slightly to 5.0% year-over-year, the worst since December 2022 (red in the chart below).
The core PPI has been zigzagging higher since the low point in January 2024.
Month-to-month, September was revised higher to 0.82% (+10.3% annualized) from the originally reported 0.68% (+8.5% annualized, blue).
In October, it rose by 0.33% (+4.0% annualized) on top of the upwardly revised September.
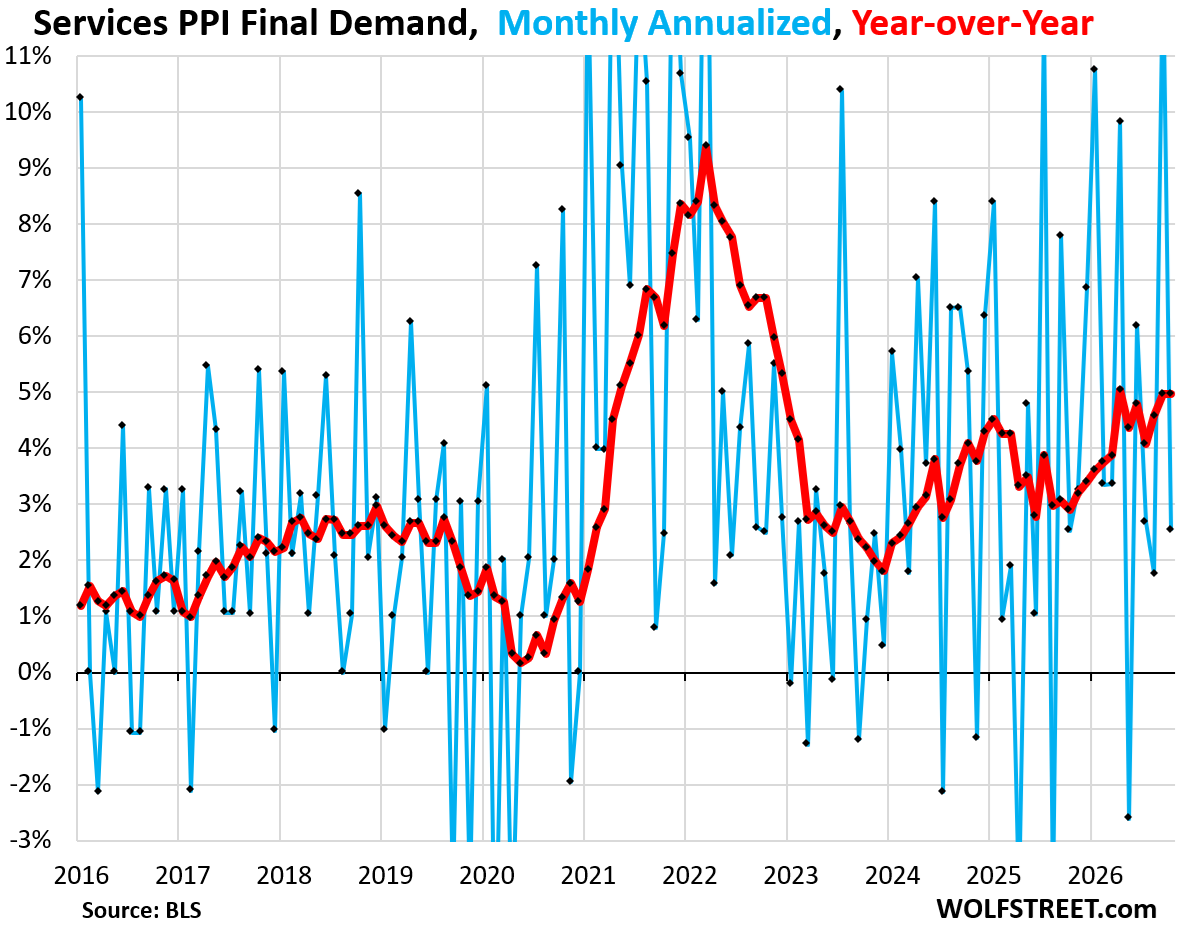
The services PPI accelerated slightly to 5.0% year-over-year. October, September, and April – all at around 5.0% – were the worst since December 2022 (red in the chart below).
Month-to-month, the spike in September was revised even higher to 1.00% (+12.6% annualized) and pushed it off the chart (blue line).
The month-to-month increase in October of 0.21% (+2.6% annualized) came on top of the upwardly revised off-the-chart spike in September.
Services account for 68% of the overall PPI final demand.
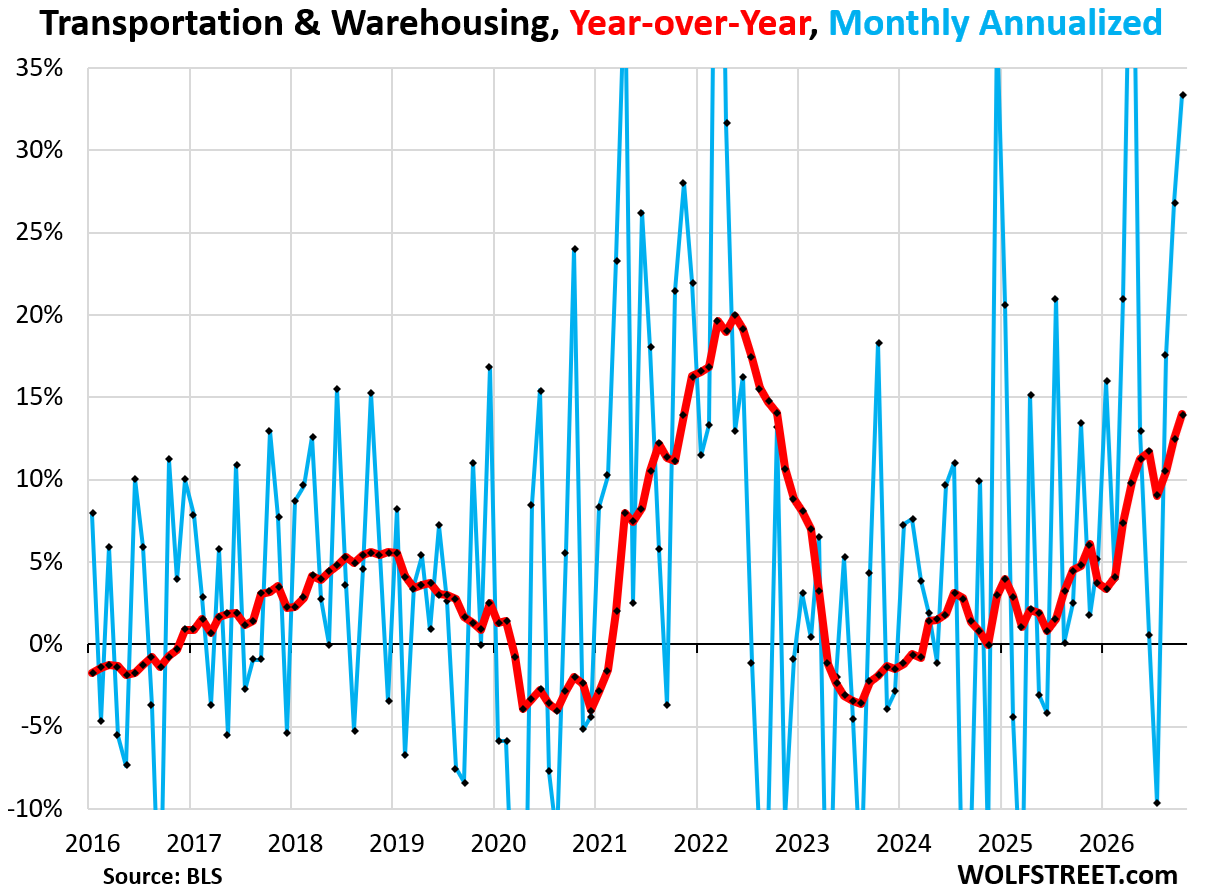
The transportation & warehousing PPI, which is part of the services PPI, soared by 14.0% year-over-year, the worst since October 2022 (red). It has been zigzagging ever higher since the low point with negative readings in July 2023.
Month-to-month, it spiked by 2.4% (+33.3% annualized, blue), driven by higher input costs (red).
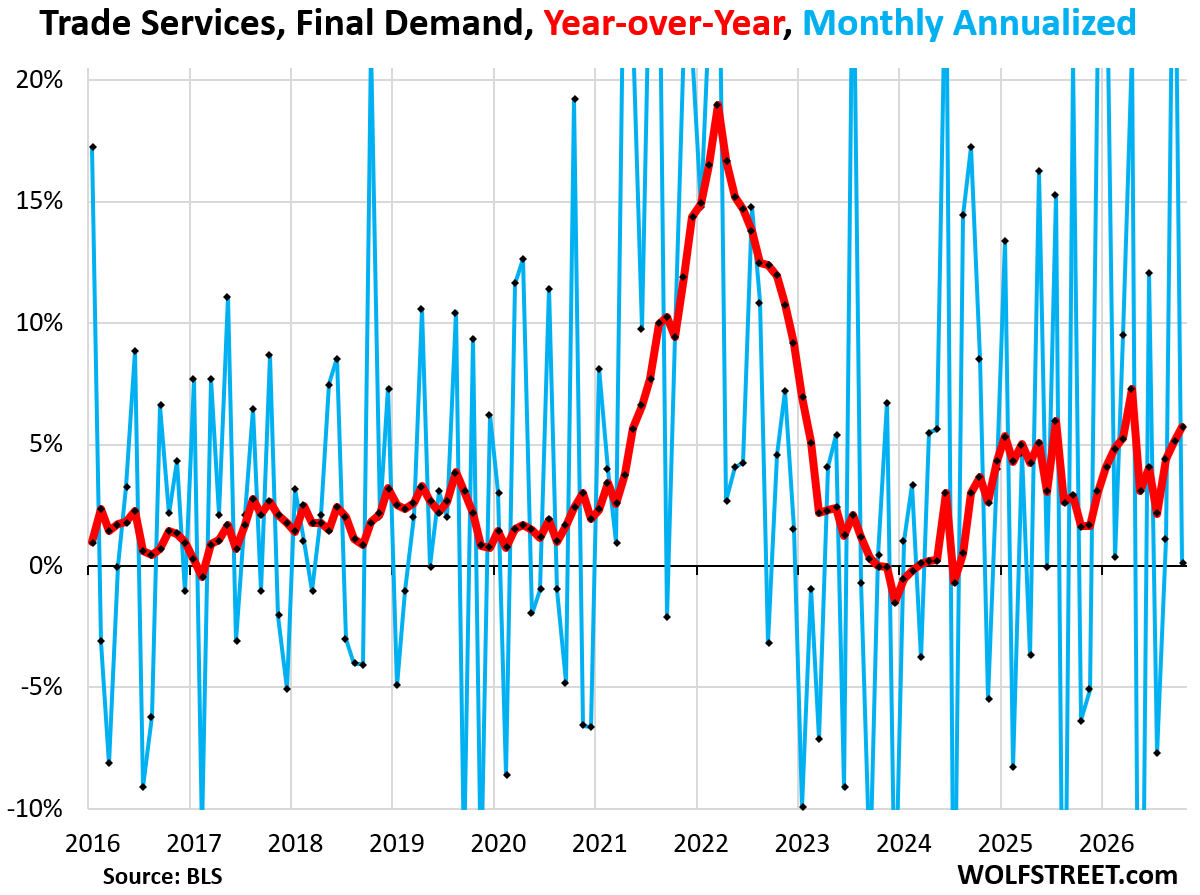
The trade services PPI, which is also part of the services PPI, accelerated to 5.7% year-over-year, the worst since April (red). That range is about double the normal range before the pandemic.
Month-to-month, the spike in September was massively revised higher to +2.29% (+31.2% annualized), from the previously reported +1.38% (+17.8% annualized), and pushed it way off the chart.
In October, the index then didn’t add further increases to the massively upwardly revised September spike.
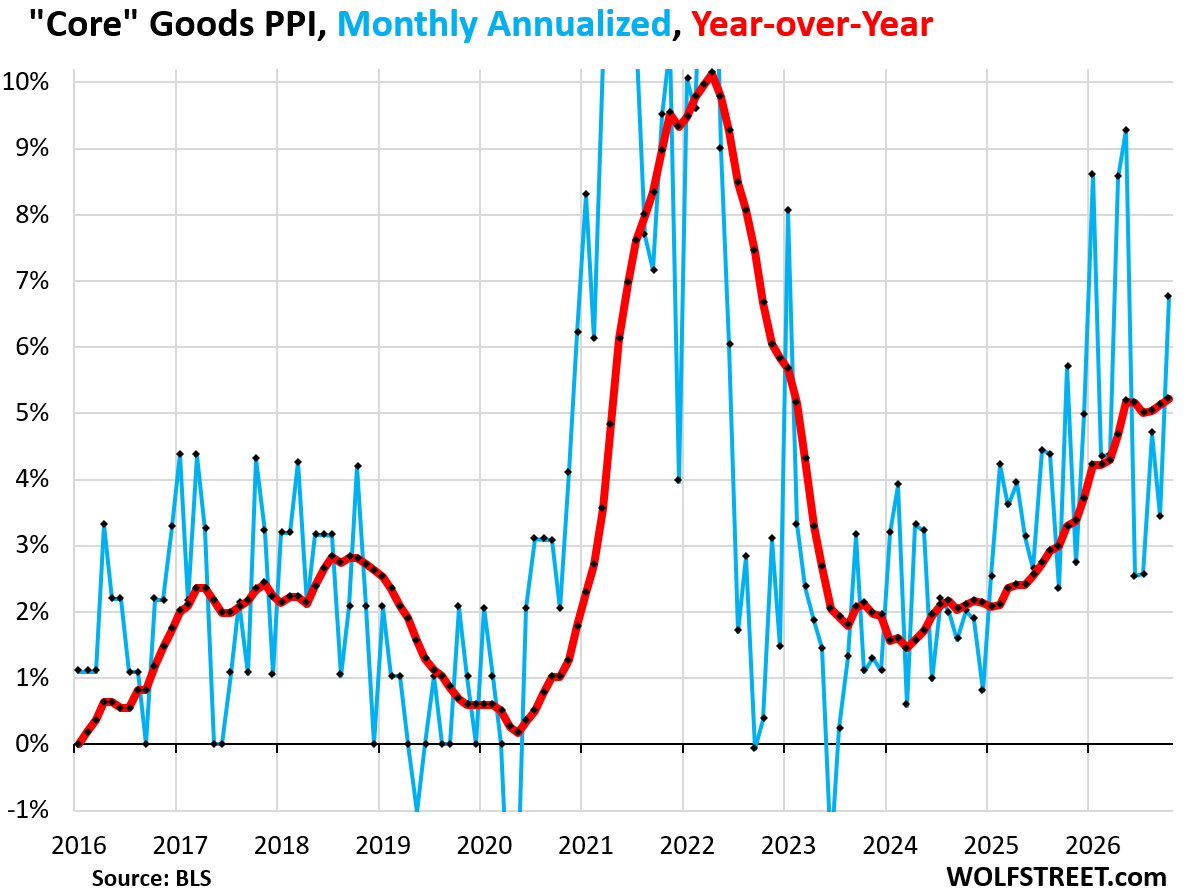
The PPI for core goods, which excludes energy and food components, rose by 5.2% year-over-year, the worst since January 2023, having squeaked past the highs earlier this year.
It has been zigzagging higher since March 2024.
Month-to-month, the index spiked by 0.55% (+6.8% annualized).
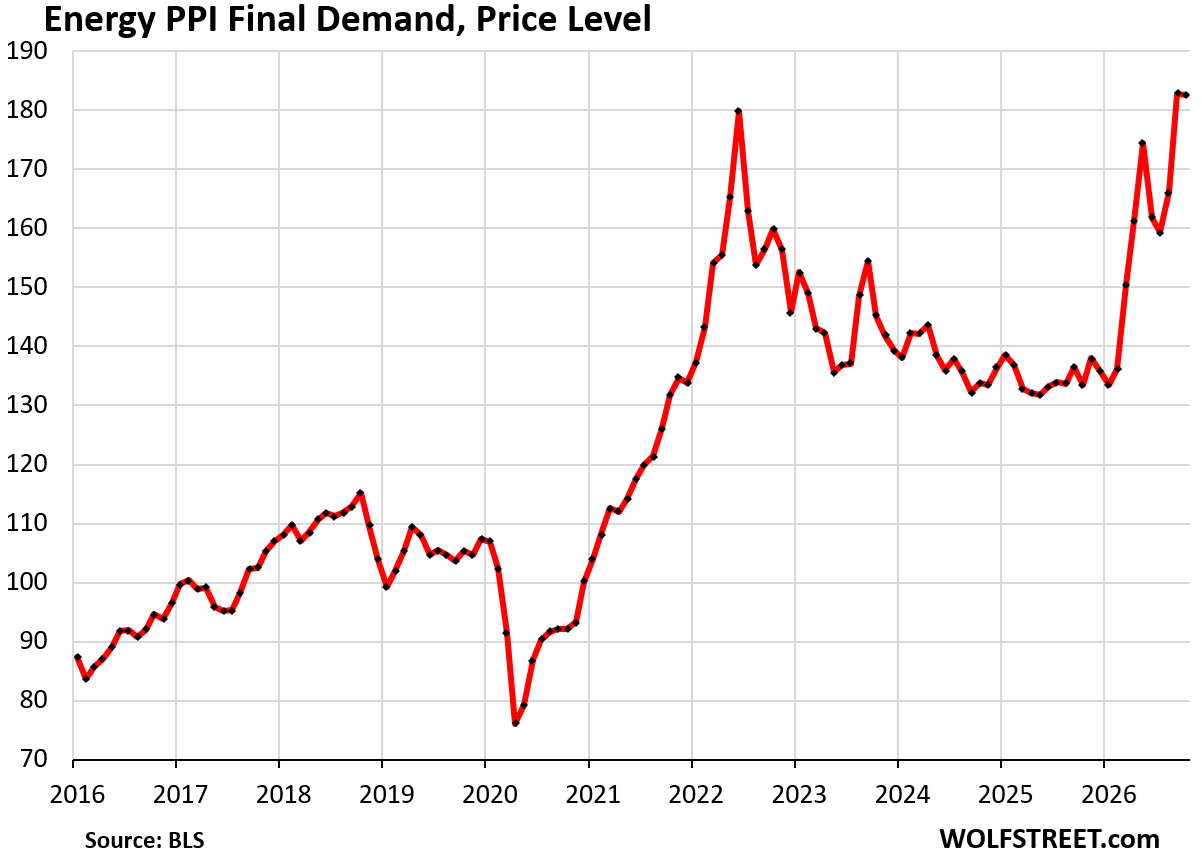
The PPI for energy was essentially unchanged month-to-month and up by 36.8% year-over-year.
The chart shows the price level of the energy PPI, and not the percentage changes. The price level in September and October have surpassed the June 2022 peak.
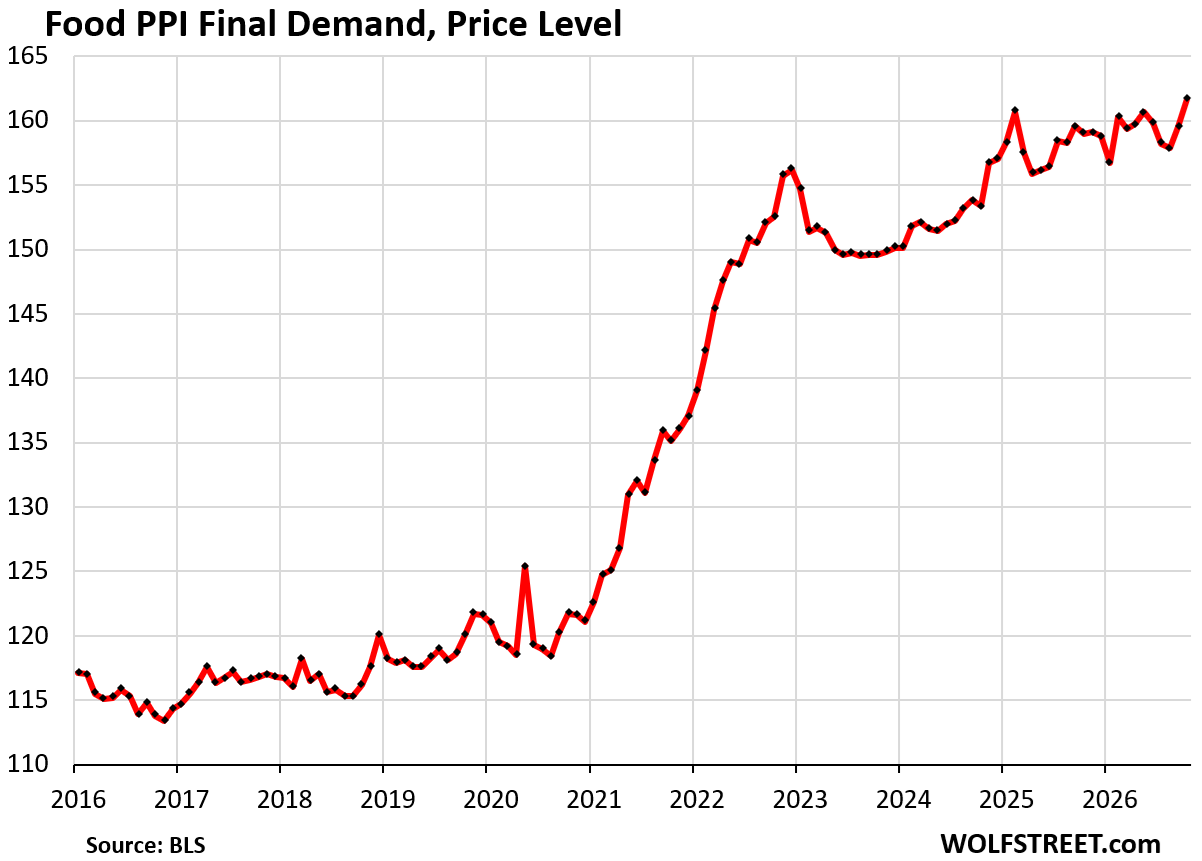
The PPI final demand for food that businesses face, such as manufacturers of packaged foods, spiked month-to-month by 1.34% (+17.3% annualized), after the 1.05% spike in September, following three negative readings in a row in June, July, and August. The spikes in September and October point ominously at a potential re-acceleration of food inflation.
The increases in September and October pushed the year-over-year food PPI to an increase of 1.7%, after a series of flat to negative readings.
Blistering food inflation occurred from mid-2020 through 2022, when food costs soared by about 31%, but then hit a ceiling and fell in 2023.
In case you missed it: No Inflection Point Yet: Near-Exponential Data Center Boom Sends Shockwaves to Industrial Economy, Construction Hit by 2nd Wave of Inflation
Enjoy reading WOLF STREET and want to support it? You can donate. I appreciate it immensely. Click on the mug to find out how: