
Core services CPI +4.5% annualized, Core CPI +4.1% annualized, all-items CPI +8.1% annualized in September from August.
By Wolf Richter for WOLF STREET.
The month-to-month all-items CPI spiked by 0.65% in September from August seasonally adjusted (+8.1% annualized, blue line in the chart), the second month in a row of sharp acceleration, after a low positive reading in July and the steep negative reading in June when energy prices had plunged.
Year-over-year, the all-items CPI, which includes energy and food, accelerated to 3.7% in September. Since the beginning of 2020, it has surged by over 30%.
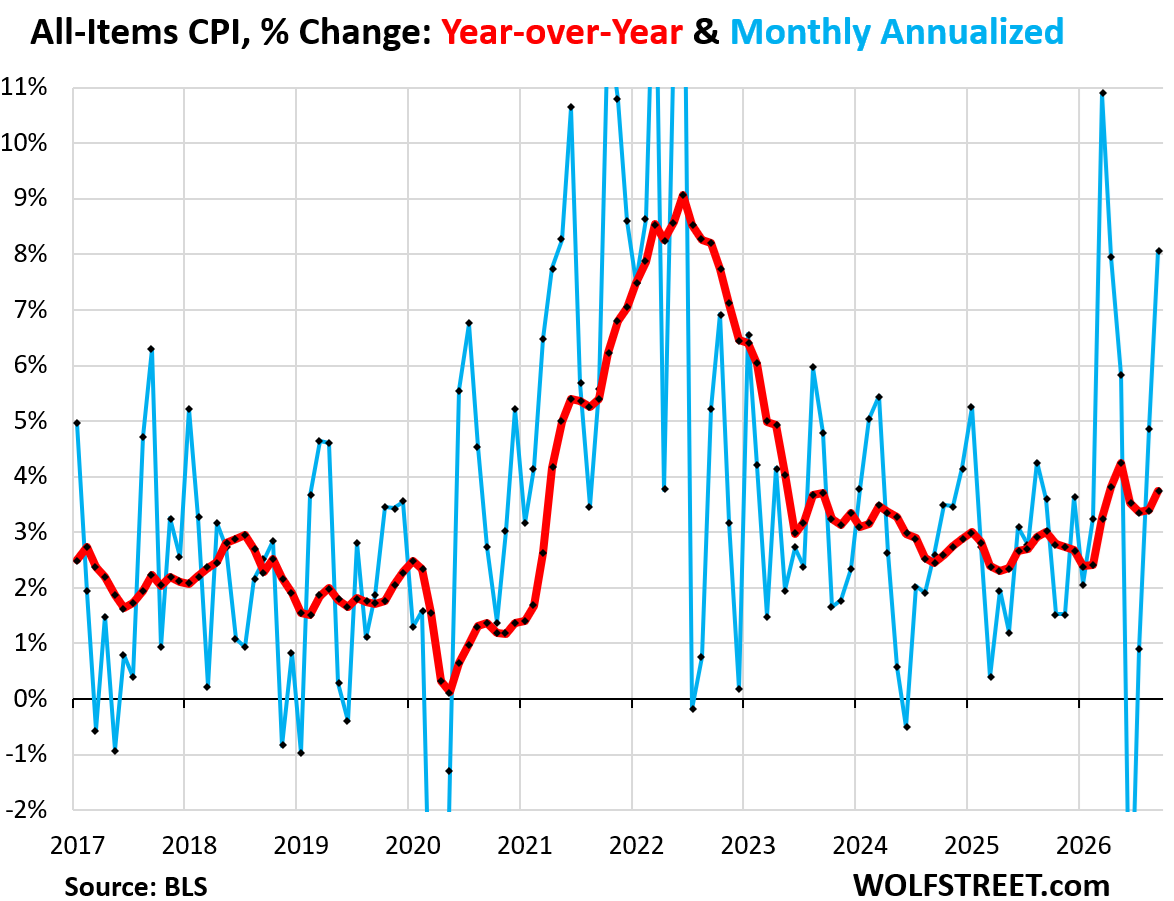
This inflation has spread deeply into the economy. Only part of it was driven by the jump in energy prices.
A big driver was the “core services” CPI, which jumped by 0.37% (+4.5% annualized). Core services move the needle: They account for nearly two-thirds of the all-items CPI and include housing, healthcare, insurance, etc.
Another big driver was the jump in “core” goods prices, the worst since January 2025 (they exclude energy and food). Among the main culprits: prices of electronics and related products, thanks to the AI boom, and prices of used vehicles.
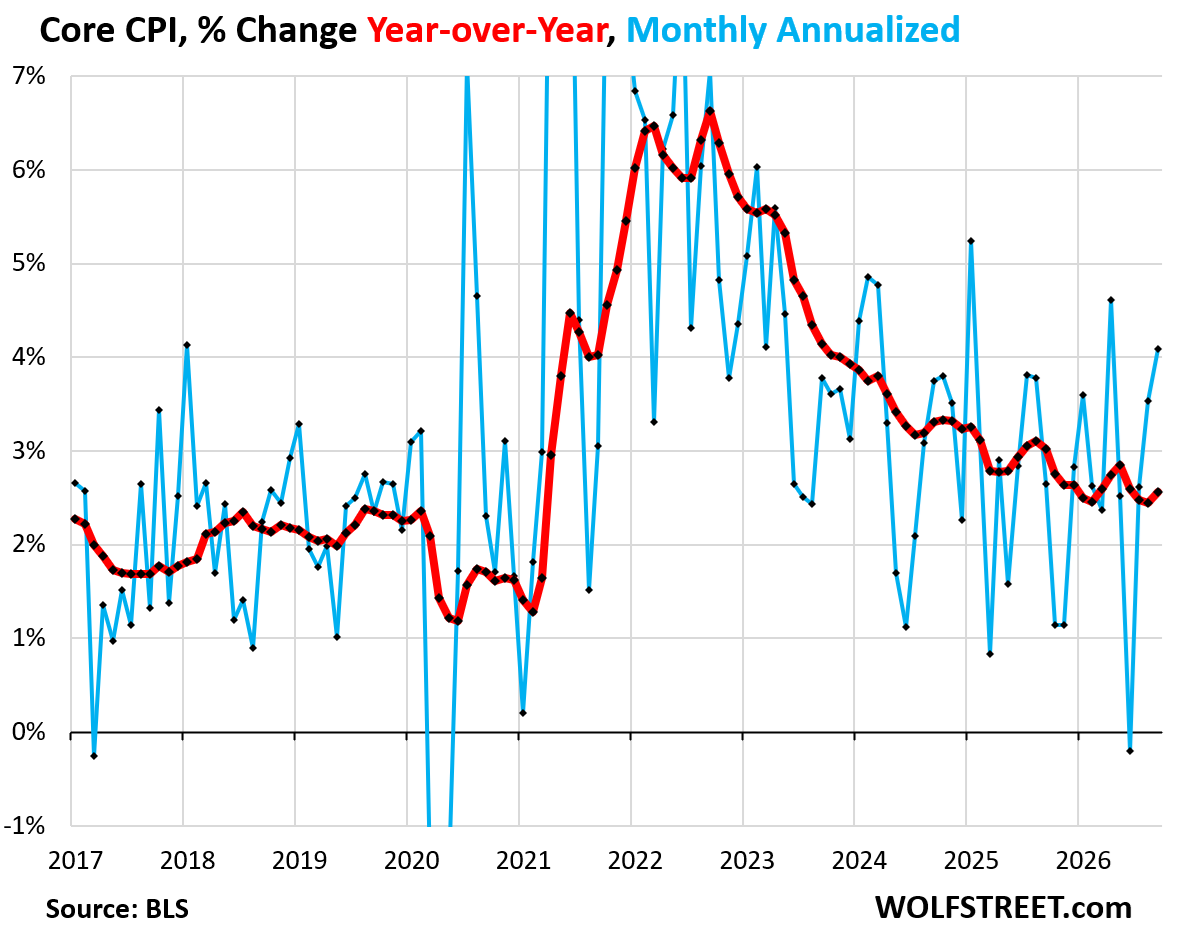
The “core” CPI, which excludes energy prices and food prices, jumped by 0.33% month-to-month (+4.1% annualized), the worst since April, pushed up by the core services CPI (+4.5% annualized) and not helped by the core goods CPI (+3.1% annualized), the worst since January 2025.
Year-over-year, the core CPI accelerated to 2.6% (red line).
The biggie, inflation in services.
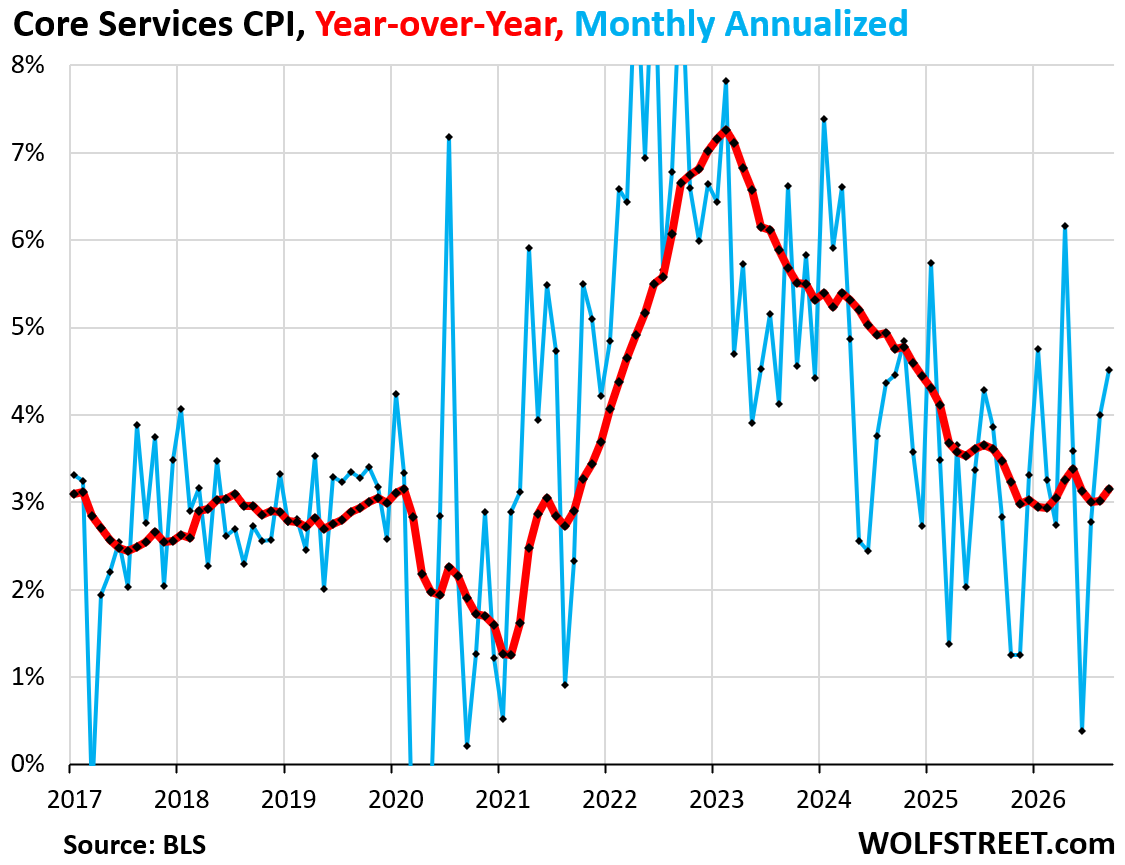
The core services CPI, which excludes energy services such as electricity and utility natural gas services, rose by 0.37% (+4.5% annualized) in September from August (blue in the chart below).
Part of that was driven by the resurgence of housing costs. And part of that was driven by non-housing costs as the “supercore” services CPI, which excludes housing costs, jumped by 3.7% annualized in September from August.
Year-over-year, the core services CPI rose by 3.2% (red line).
Since the beginning of 2020, the core services CPI has surged by over 31%.

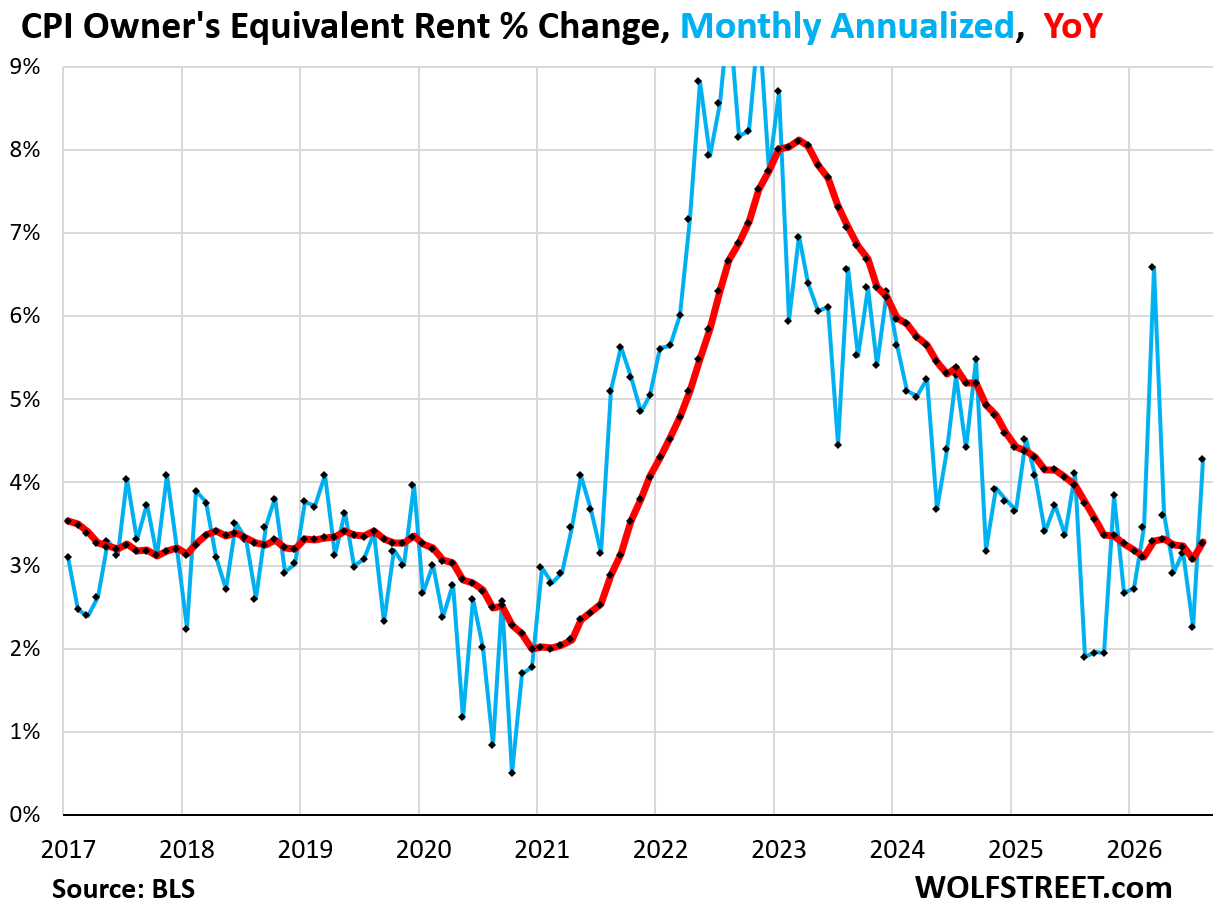
Owner’s Equivalent of Rent (OER): +0.35% in September from August (+4.3% annualized); +3.3% year-over-year:
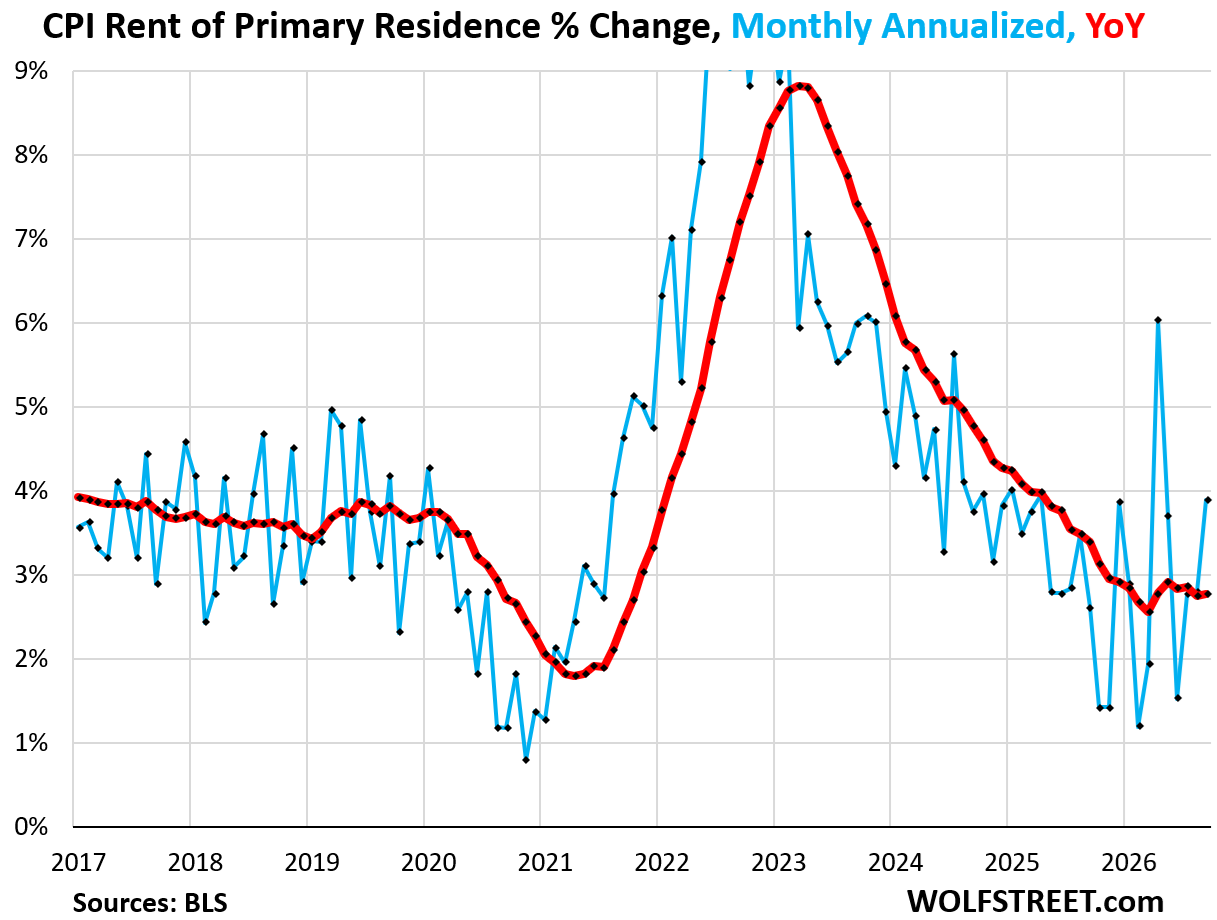
Rent of Primary Residence: +0.32% in September from August (+3.9% annualized); +2.8% year-over-year:
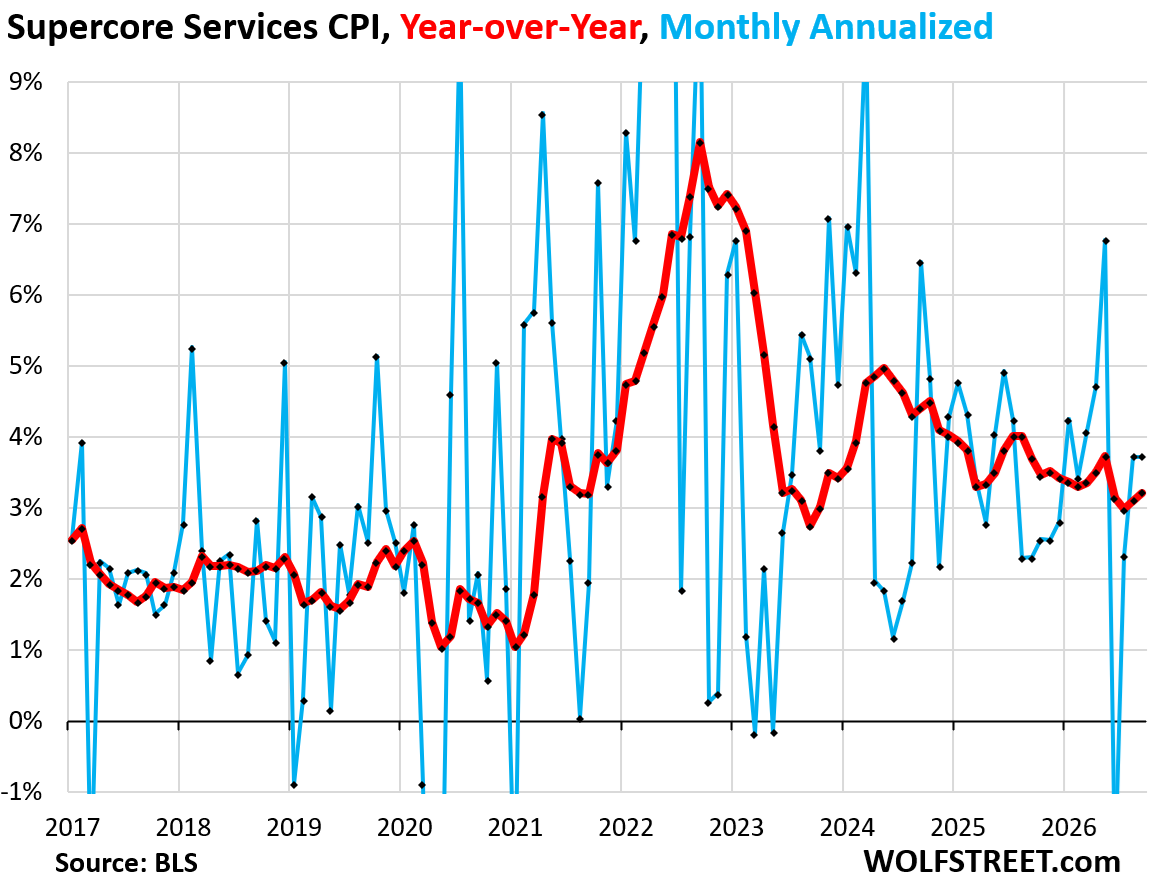
Supercore services (core services without housing): +0.31% September from August (+3.7% annualized); +3.2% year-over-year.
Airline fares (+1.2% monthly, +22% year-over-year) and motor vehicle maintenance (+0.72% monthly, +5.8% year-over-year) were among the drivers.
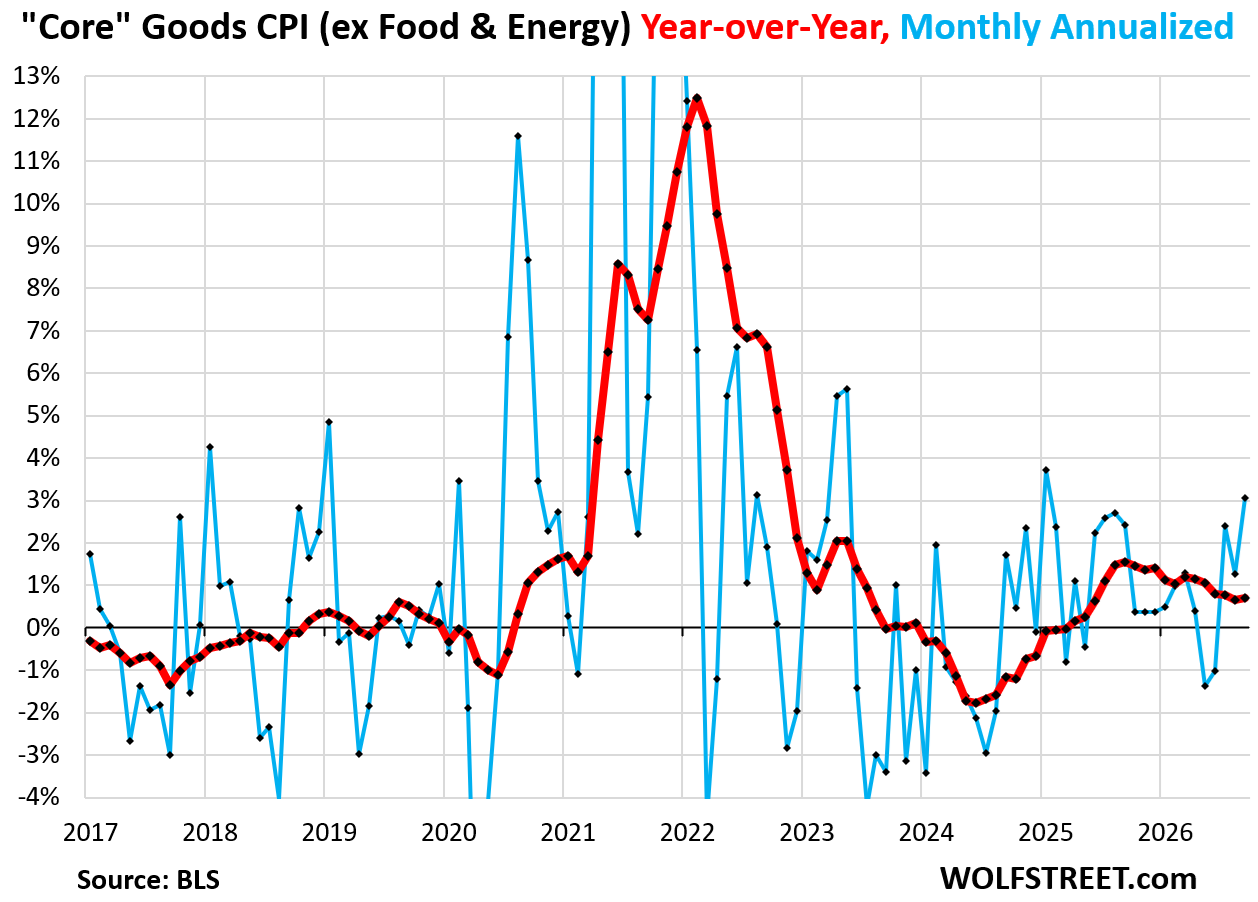
The “core goods” CPI (all goods except food & energy) in normal times reflects a very competitive environment marked by lower per-item production costs due to globalization and ever more efficient automation of manufacturing. The internet has made comparative shopping very easy. So generally, core goods are marked by either low inflation or slight deflation. And they generally counterbalance the much higher inflation in core services.
The pandemic inflation spike blew that apart. Goods prices spiked more than services. But then, coming out of that, goods prices began to drop, including and on a very large scale for used vehicles and electronics.
That phase appears to be over. Over the past three months, core goods prices, including for used and new vehicles, and for electronics, have been rising at a sharp clip on a month-to-month basis. And that has started to move up the year-over-year inflation reading that had been decelerating.
The core goods CPI rose by 0.25% (+3.1% annualized) in September from August, the biggest month-to-month increase since January 2025. Year-over-year, it reversed the deceleration trend and accelerated to 0.71%.
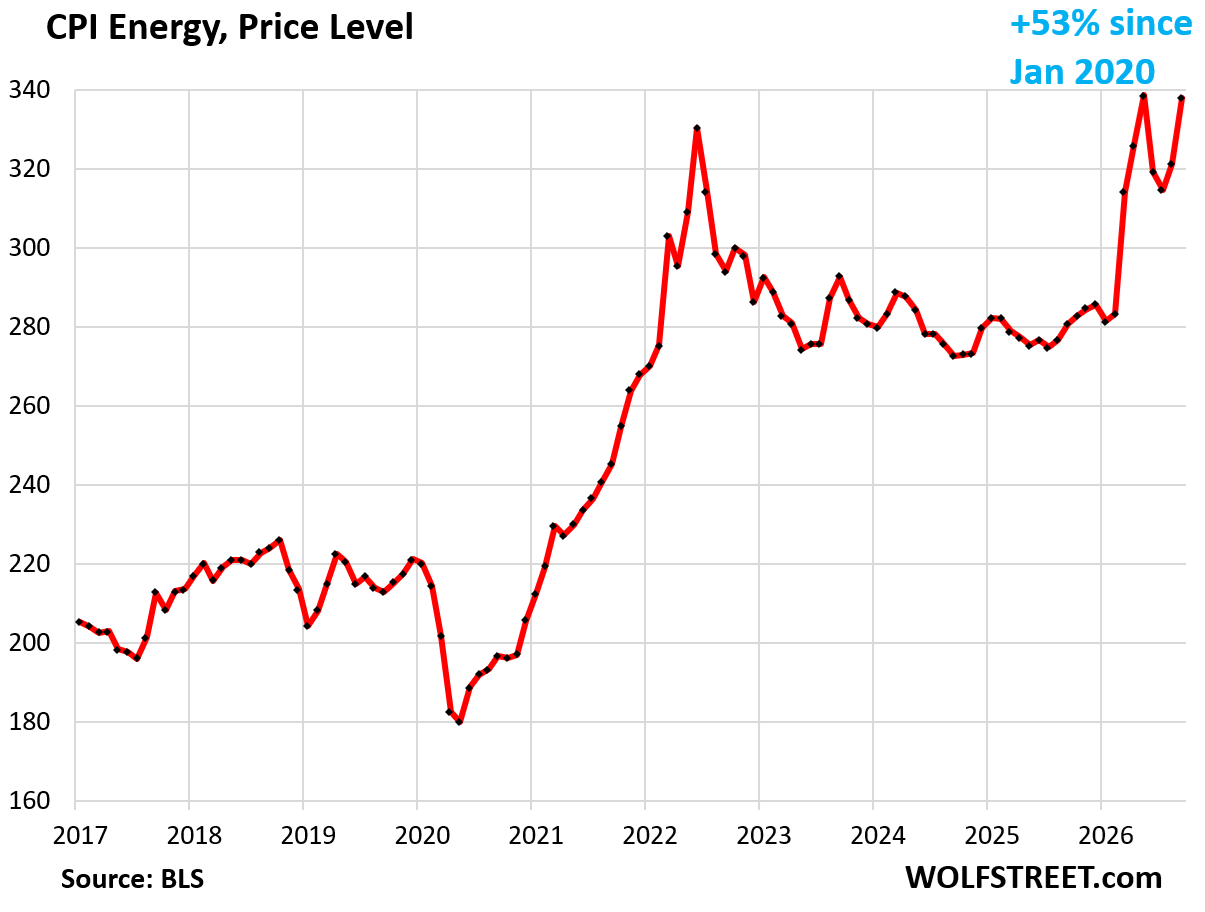
The energy CPI spiked by 5.2% month to month and by 20.4% year-over-year.
The crude-oil based fuels spiked. Gasoline (roughly half of the Energy CPI), spiked by 9.3% month-to-month and by 35% year-over-year.
Electricity rose by 0.2% month-to-month and by 4.4% year-over-year.
Utility (piped) natural gas eased by 0.3% month-to-month but year-over-year jumped by 5.0%.
Since the beginning of 2020, the Energy CPI has surged by 53%. The chart shows the price level, not the percentage change:
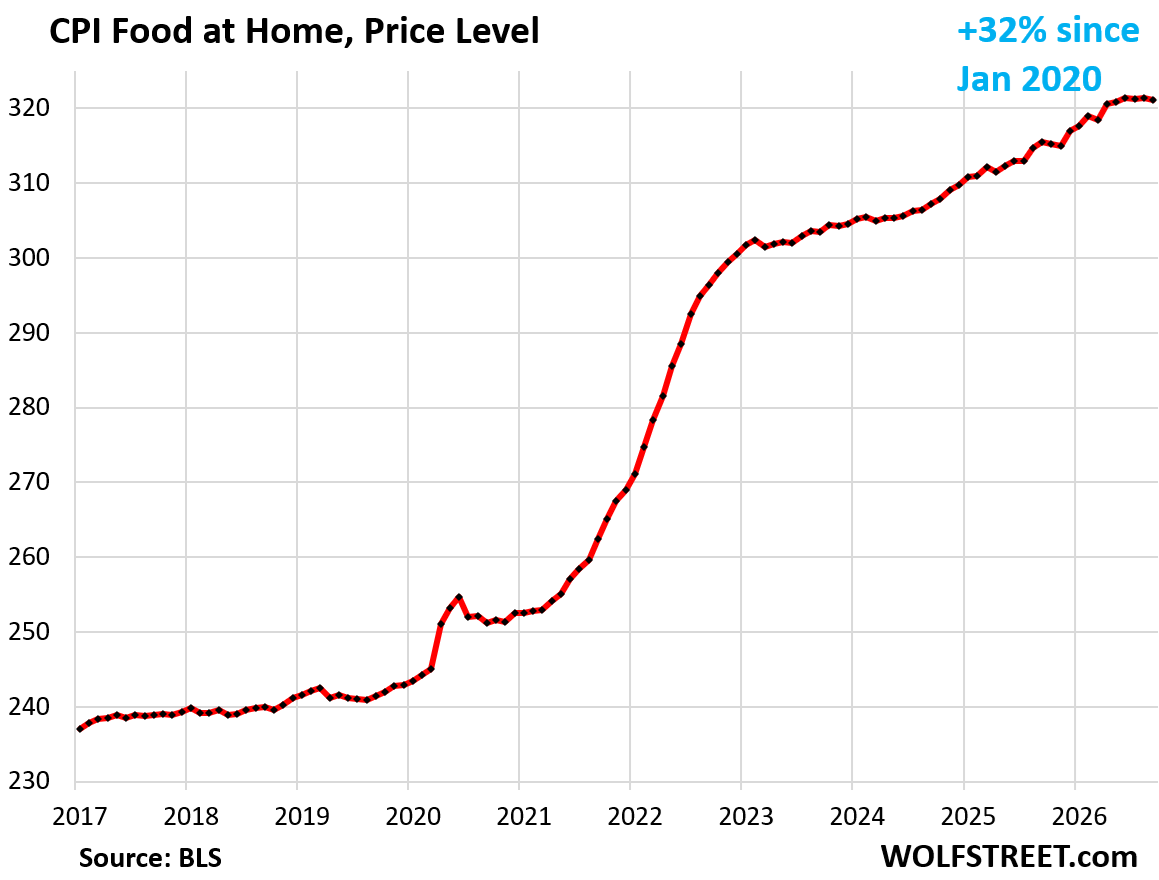
The CPI for food at home edged down month-to-month but rose by 1.8% year-over-year, with some prices falling and others rising.
On the decline side: Egg prices have collapsed from their ridiculous spike. The price coffee, after a ridiculous multiyear spike, has been coming down for a few months. The price of beef appears to have topped out, after a ridiculous multiyear spike, and has started to come down. Pork prices have edged down in recent months, as has dairy.
The prices of other foods have risen, including chicken, fresh fruits and vegetables, cereals, etc.
Food prices are volatile, jumping up and down. They had massively spiked during the pandemic, leading to mega profit margins for food retailers, and then hit a ceiling as shoppers refused to keep paying whatever and started shopping around once again, including online. And retailers that continued to raise their prices to fatten up their profit margins and boost their stock prices, lost sales and now started whining about consumers being tapped out (that’s you, Albertsons), when in fact, consumers bought somewhere else at a lower price, including online. Consumers are the only force that can even try to keep a lid on consumer price inflation. When they stop trying, prices spike.
Since the beginning of 2020, food prices have surged by 32%. This chart shows the price level, and not the percentage change:
In case you missed it: The US Economy “Is Running Hot,” Lots of Consumer Spending Growth, Lots of Inflation. The Bond Market Sees it Too
Enjoy reading WOLF STREET and want to support it? You can donate. I appreciate it immensely. Click on the mug to find out how:


Fake wars with Iran to drive up oil prices (profits for big oil) really work!
RB,
Fake war? All oil not big oil and prices relative to the price of oil in 1980 (40 USD a bbl) and Natural gas (3 USD/MMBTU ) in 1980 shows you are getting a bargain for your energy needs in 2026 after energy costs in the 1990s as low as 8 USD a bbl. Also 2020 brought about negative oil prices as storage costs rose dramatically with no place to store oil .
Oil and gas are not easy to find and produce like some other commodities as technology requires more and more capital to supply the limited resources.
In addition a great deal of the higher prices for gasoline and diesel are the result of more efficient use of these fuels that has led to massive closures of refineries across the USA over the last 5 decades.
These refinery margins are high at the moment and are not necessarily the results of the “fake war”. As Ukraine about fake wars which also has affected the world energy markets.
Remember when we were assured that prices would come down after lockdown?
Somehow they never did…and never will