
In another 39 bigger cities, condo prices fell by 8% to 14%. A massive hangover after a historic Condo Bubble.
By Wolf Richter for WOLF STREET.
Condos have, let’s say, some issues after the breath-taking price explosions from mid-2020 to mid-2022 of 50%, 60%, or even 70% in some cities. In the 10 years to the peak, prices had soared by 180% to 350% in these markets. And these bubbles have started to deflate. And the price drops have been spreading relentlessly and have been getting steeper.
In 30 bigger markets, prices of mid-tier condos through June have already dropped by 15% to 33% from their respective peaks. In 9 of them, prices have dropped by 21% to 33%. Most of their peaks occurred in the years between 2022 and 2024. These are starting to be substantial declines over a multiyear period. These 30 markets are depicted in the charts below.
In another 39 bigger cities prices, have dropped by 8% to 14%. They didn’t make the 15% cutoff to have their own chart. But they have their own table (see below the charts).
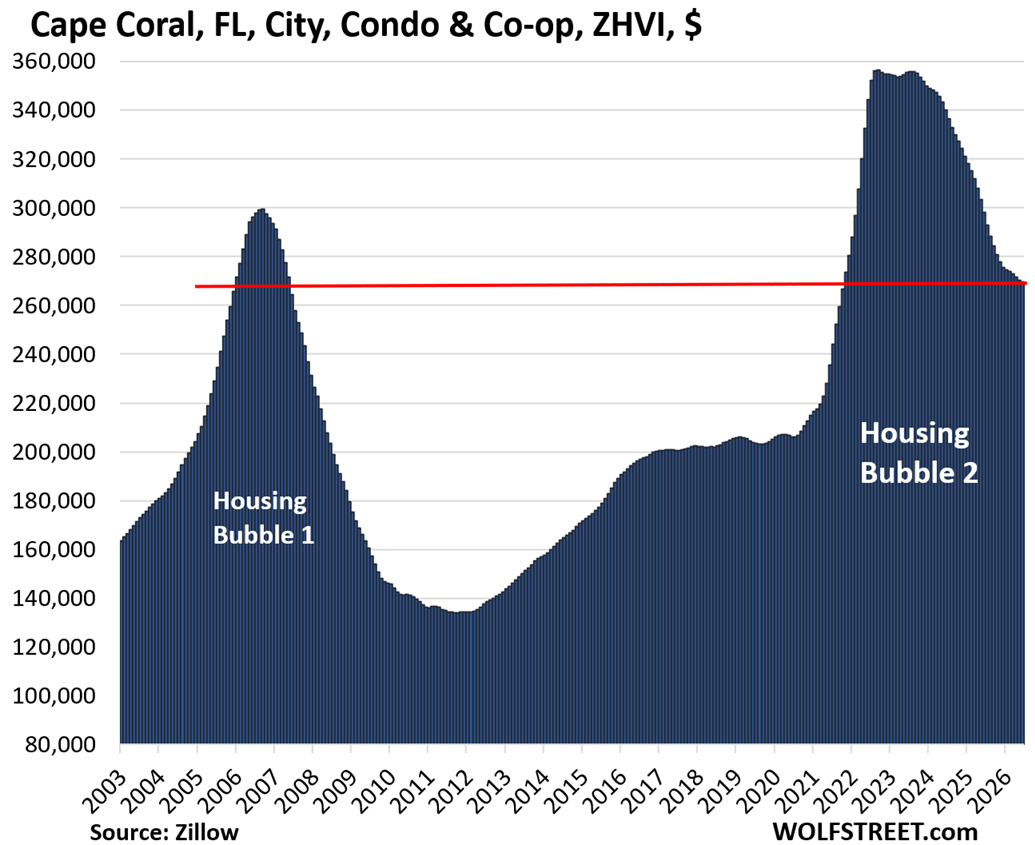
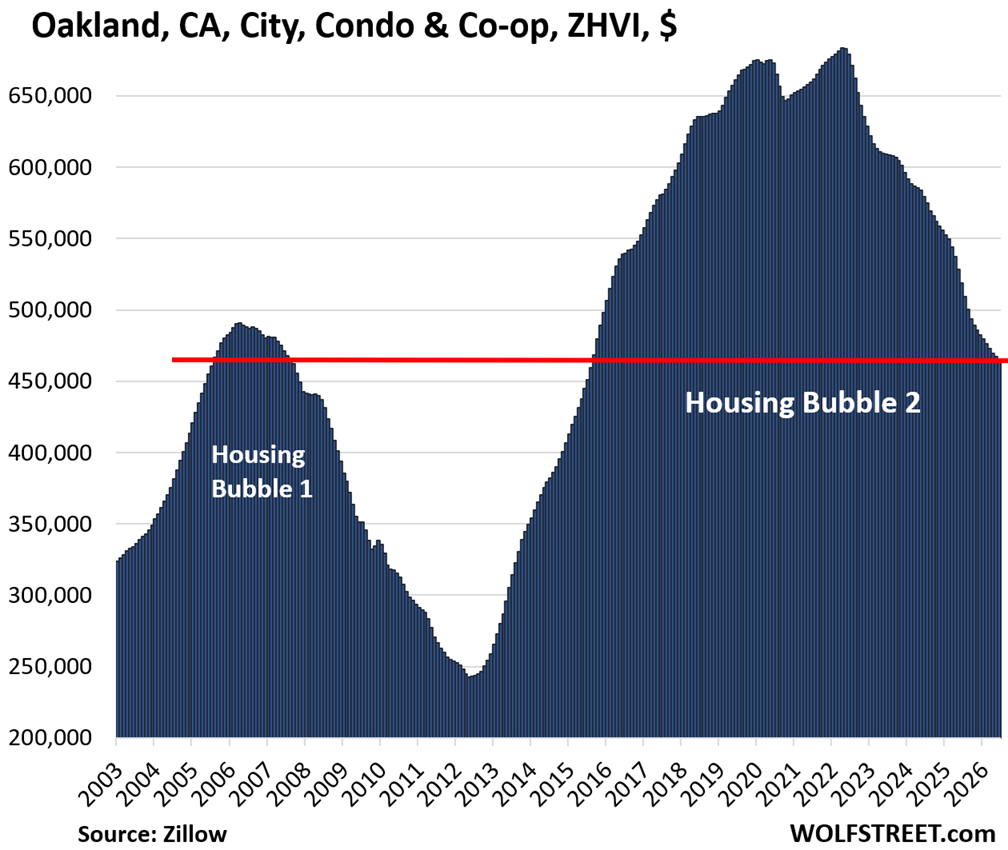
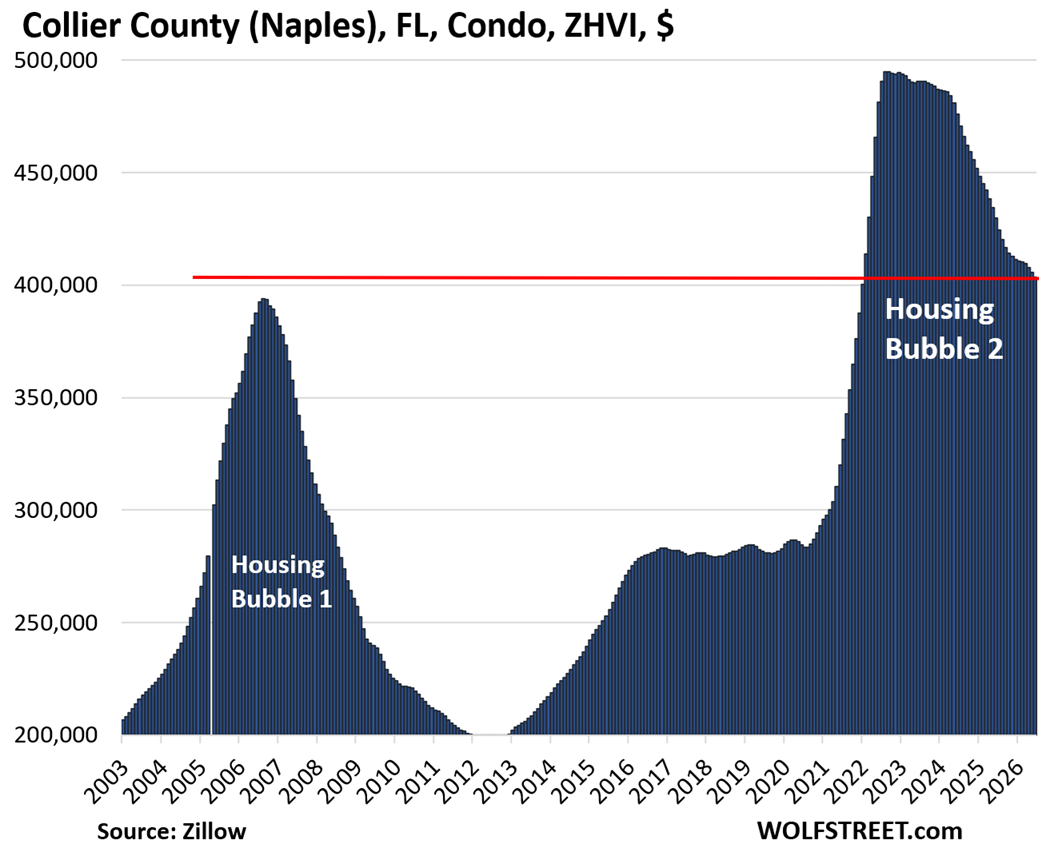
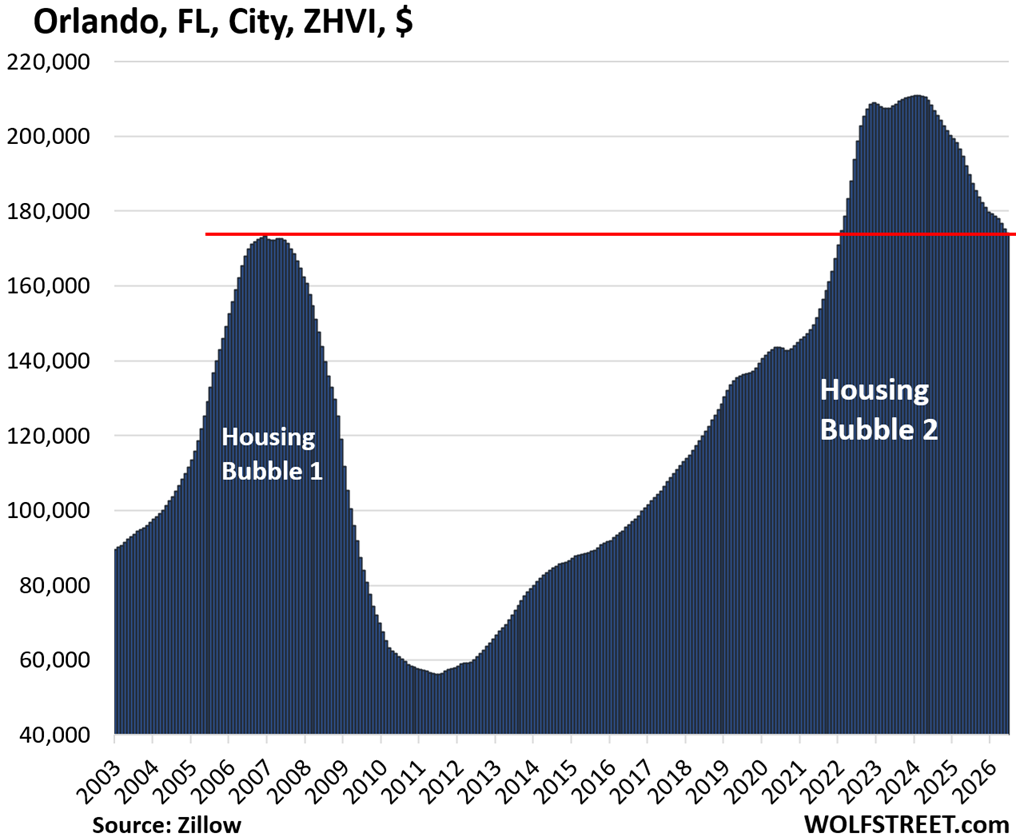
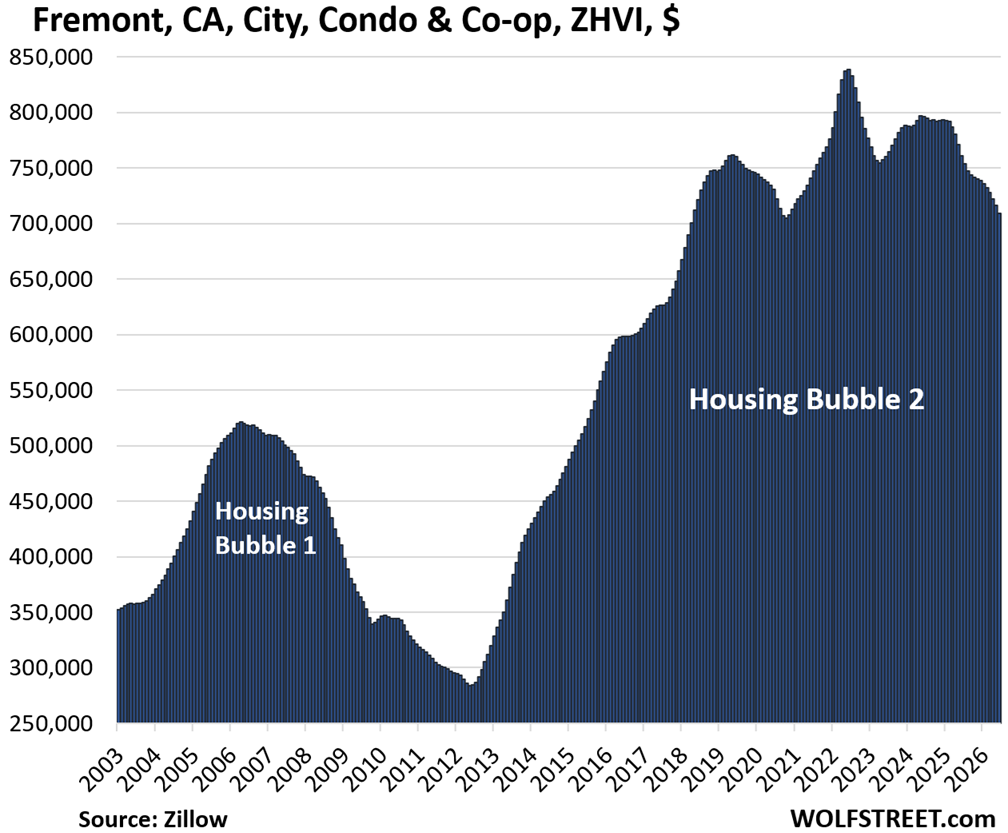
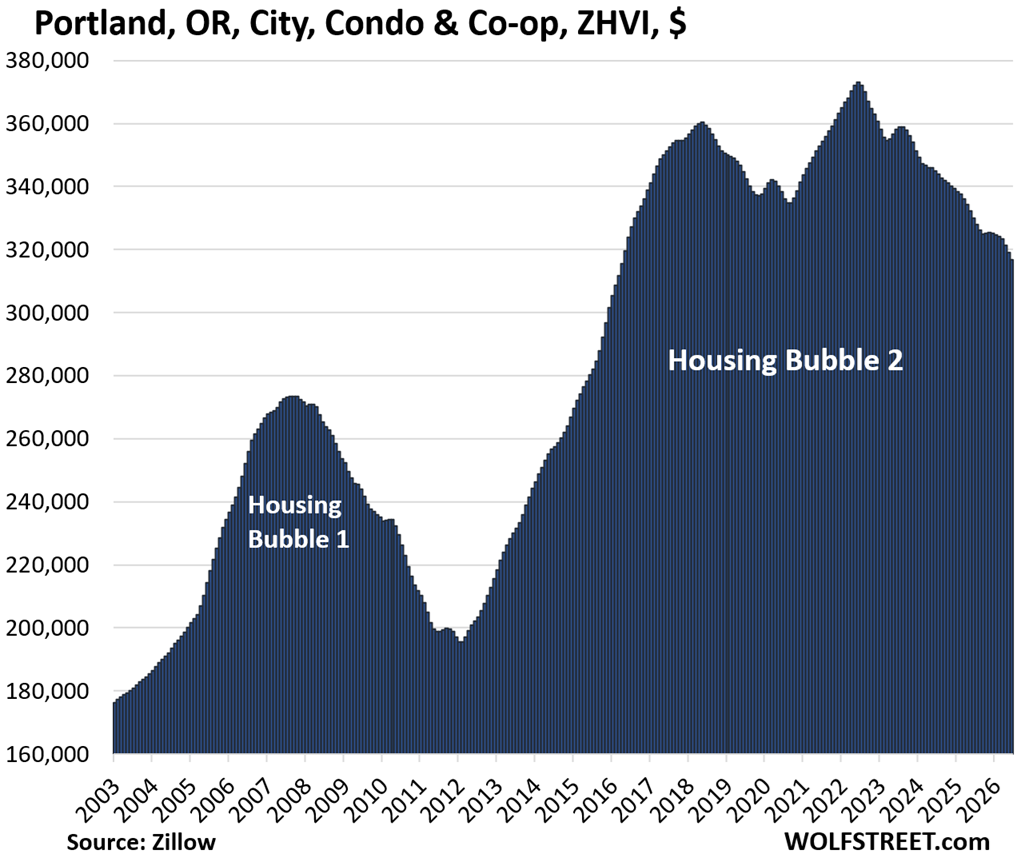
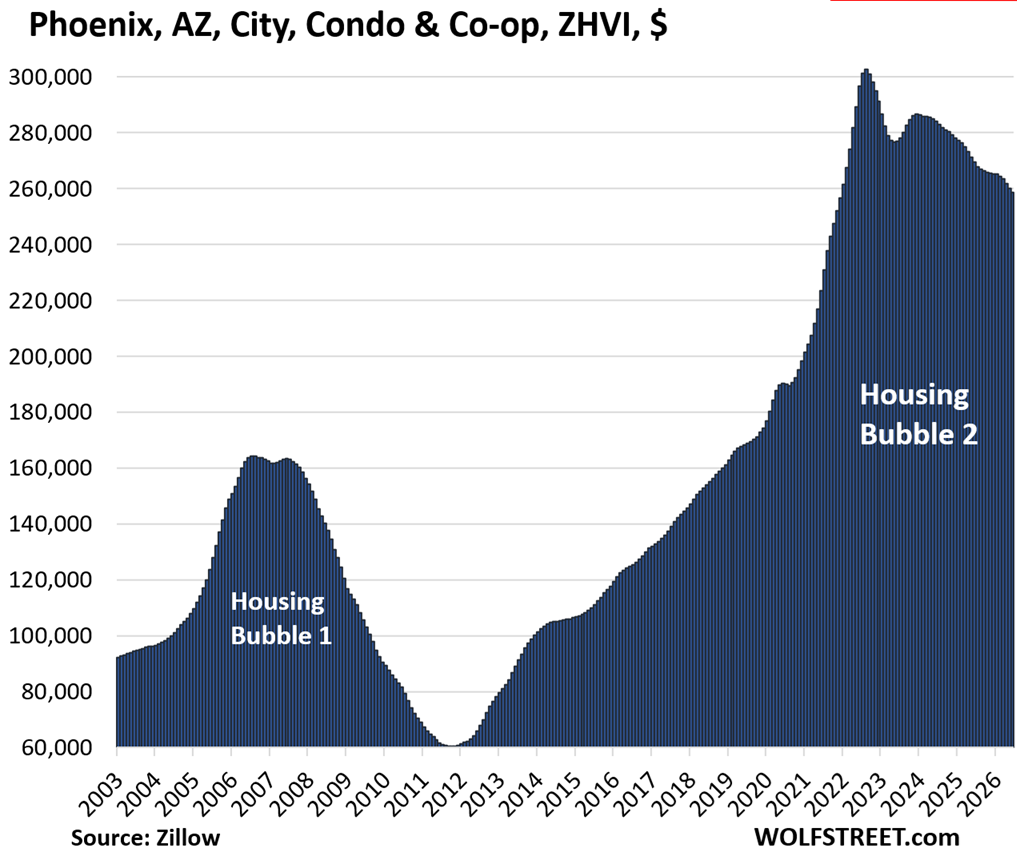
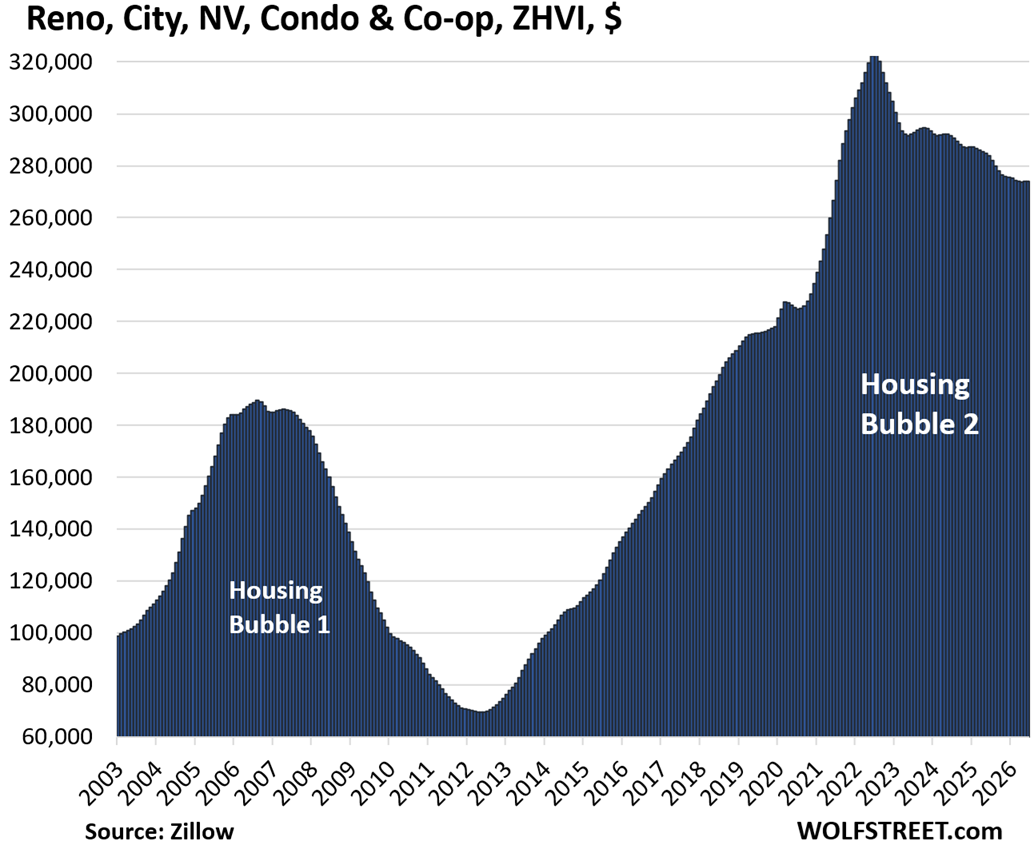
In several of these markets, condo prices have now dropped below their highs in 2006, below the peaks of Housing Bubble 1, and are back where they’d been 20 years ago. In a few other markets, prices have dropped close to their 2006 peaks. Those charts are marked with a red line.
There are also many smaller markets where condo prices have dropped just as much or more, but that are not included here because the markets are too small.
Most of the markets here are “cities.” But the list of 15% to 33% decliners also includes four counties where the cities – though household names – are too small to be included individually. And it includes one metropolitan statistical area, the Lakeland-Winter Haven MSA in Florida, for the same reason.
In some densely populated big cities, condos and co-ops make up a big part or the majority of home sales. In most other markets, condos are a relatively small portion of home sales.
Methodology and data: These prices here are seasonally adjusted three-month averages of “mid-tier” condos and co-ops from the Zillow Home Value Index (ZHVI), which is backward-looking index, based on millions of data points in Zillow’s “Database of All Homes,” including from public records (tax data), MLS, brokerages, local Realtor Associations, real-estate agents, and households across the US. It includes pricing data for off-market deals and for-sale-by-owner deals.
The Condo Bust by market in 30 charts.
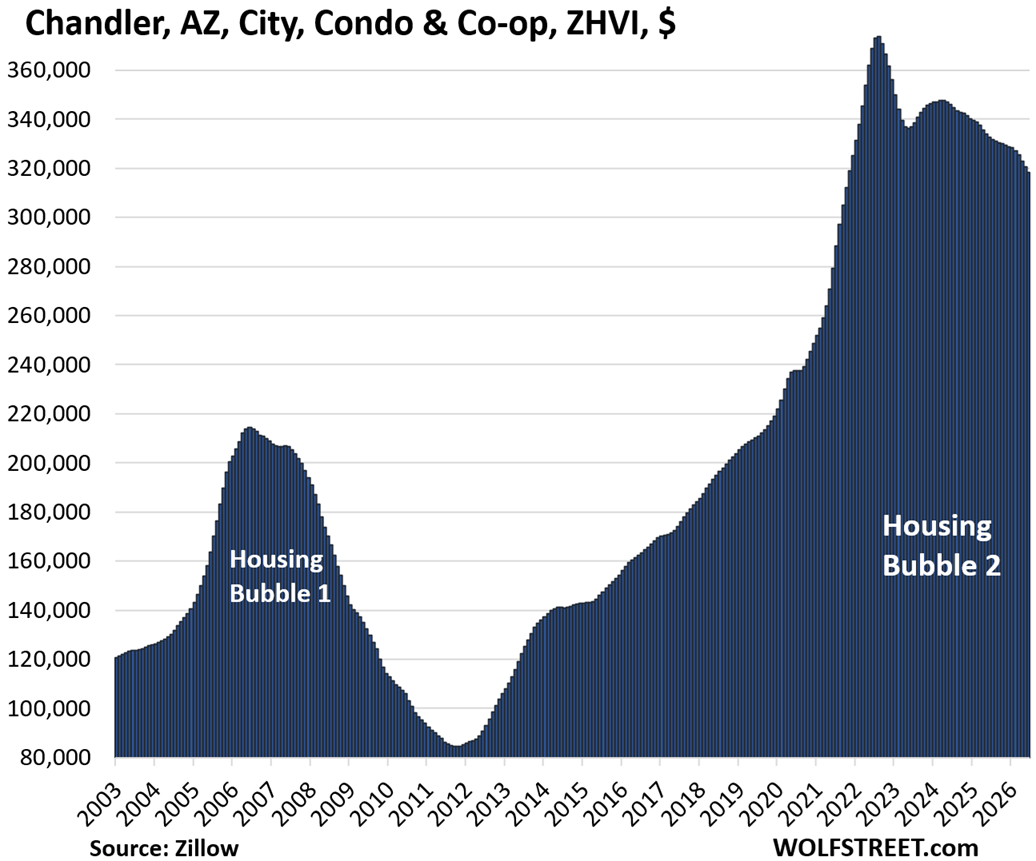
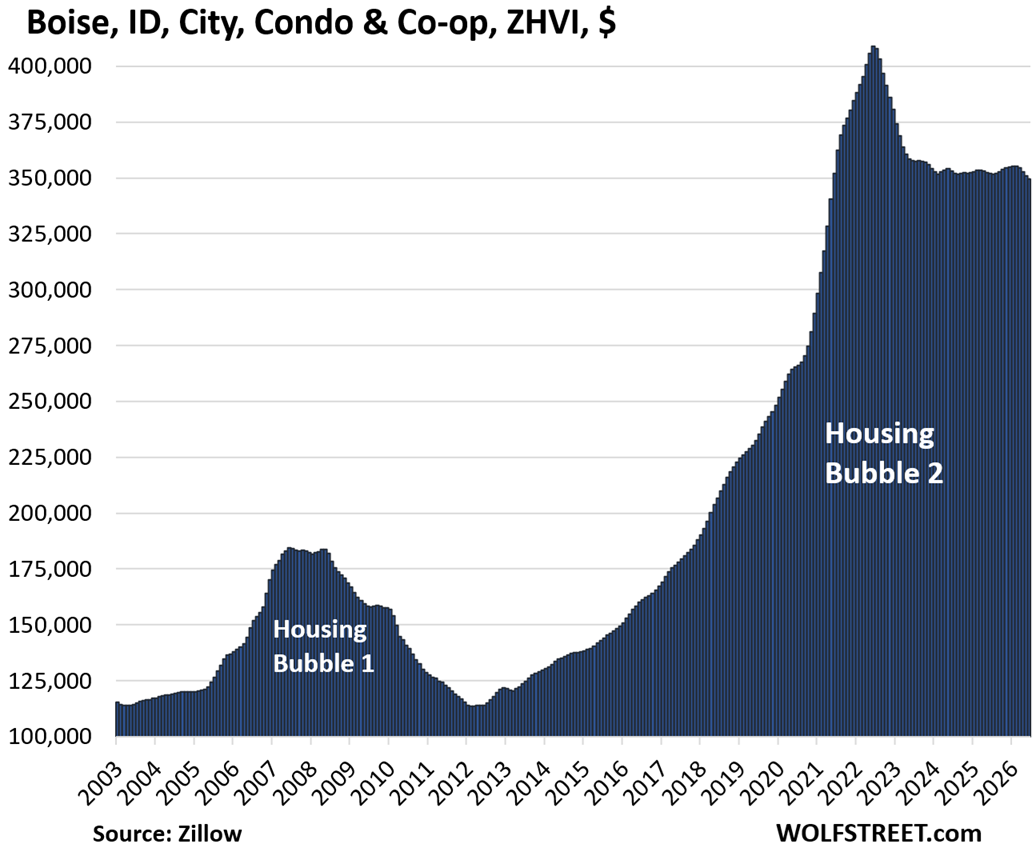
The tables for each market below show from left to right: price decline from the peak, change from prior month (MoM), change year-over-year (YoY), and remaining increase since January 2000.
| Cape Coral-Fort Myers, FL, MSA, Condo Prices | |||
| From July 2022 peak | MoM | YoY | Since 2000 |
| -33% | -0.4% | -12.1% | 128% |
Back to November 2005, that was 21 years ago. Two enormous speculative bubbles, two busts.
| Oakland, CA, City, Condo Home Prices | |||
| From May 2022 peak | MoM | YoY | Since 2000 |
| -32% | -0.4% | -10.3% | 138% |
Prices are back to where they’d fist been 21 years ago, in mid-2005. Prices are down a lot, but are still very high after the huge surge in the years before mid-2022.
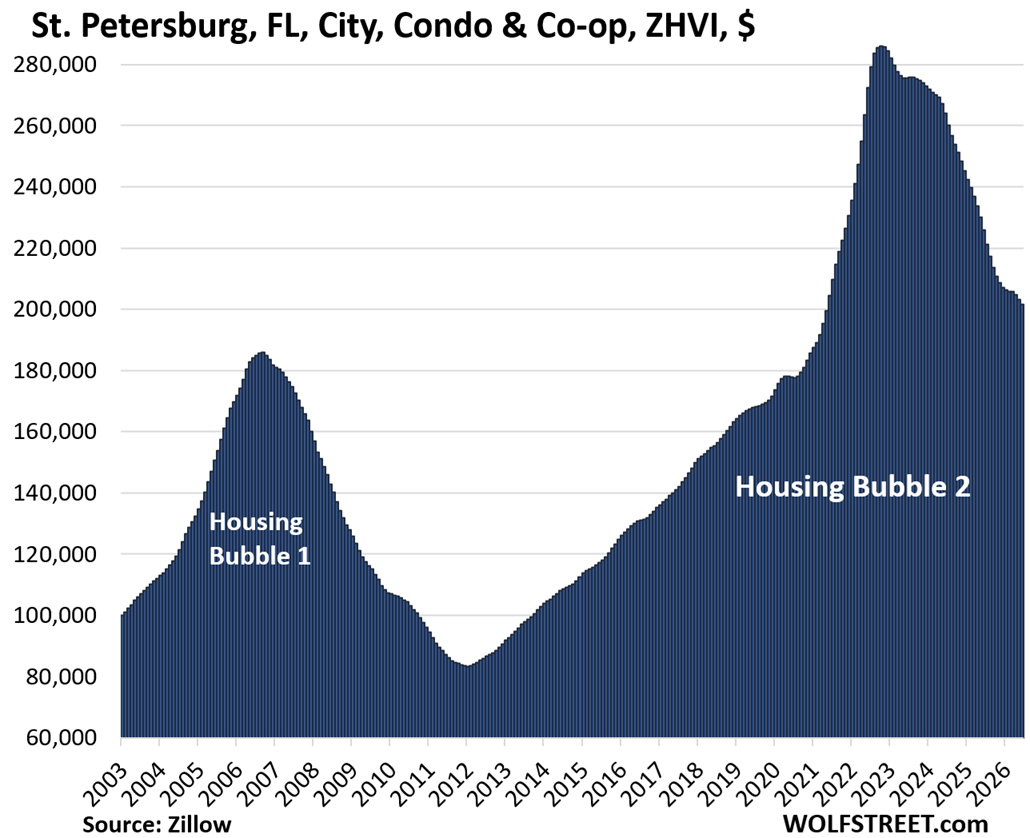
| St. Petersburg, Fl, City, Condo Prices | |||
| From Oct 2022 peak | MoM | YoY | Since 2000 |
| -29% | -0.7% | -10.7% | 177% |
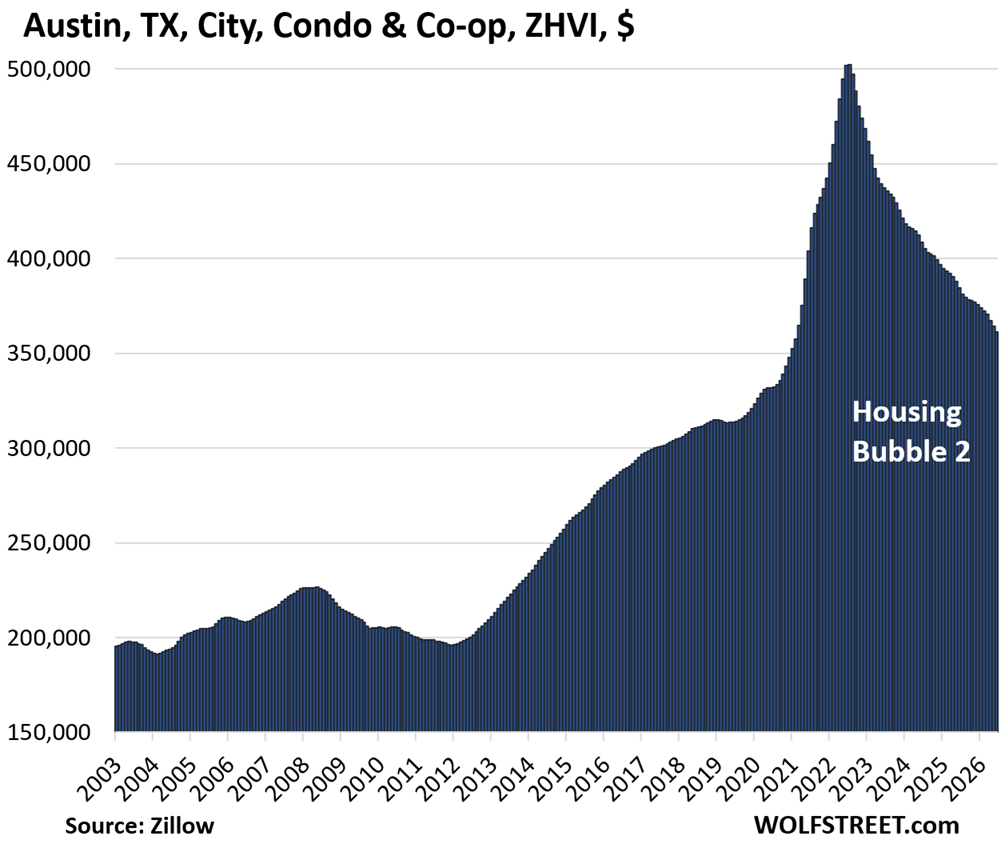
| Austin, TX, City, Condo Prices | |||
| From Jul 2022 peak | MoM | YoY | Since 2000 |
| -28% | -0.8% | -6.0% | 103% |
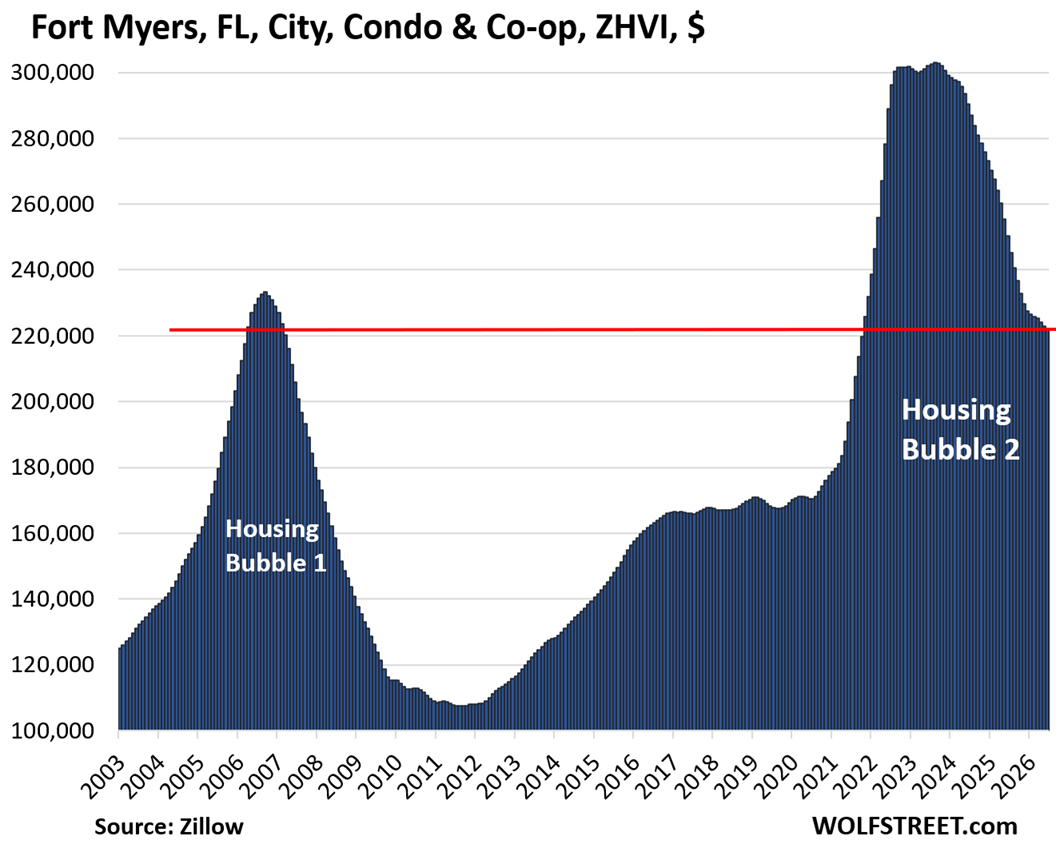
| Fort Myers, FL, City, Condo Prices | |||
| From July 2022 peak | MoM | YoY | Since 2000 |
| -27% | -0.4% | -11% | 119% |
Back to 2006.
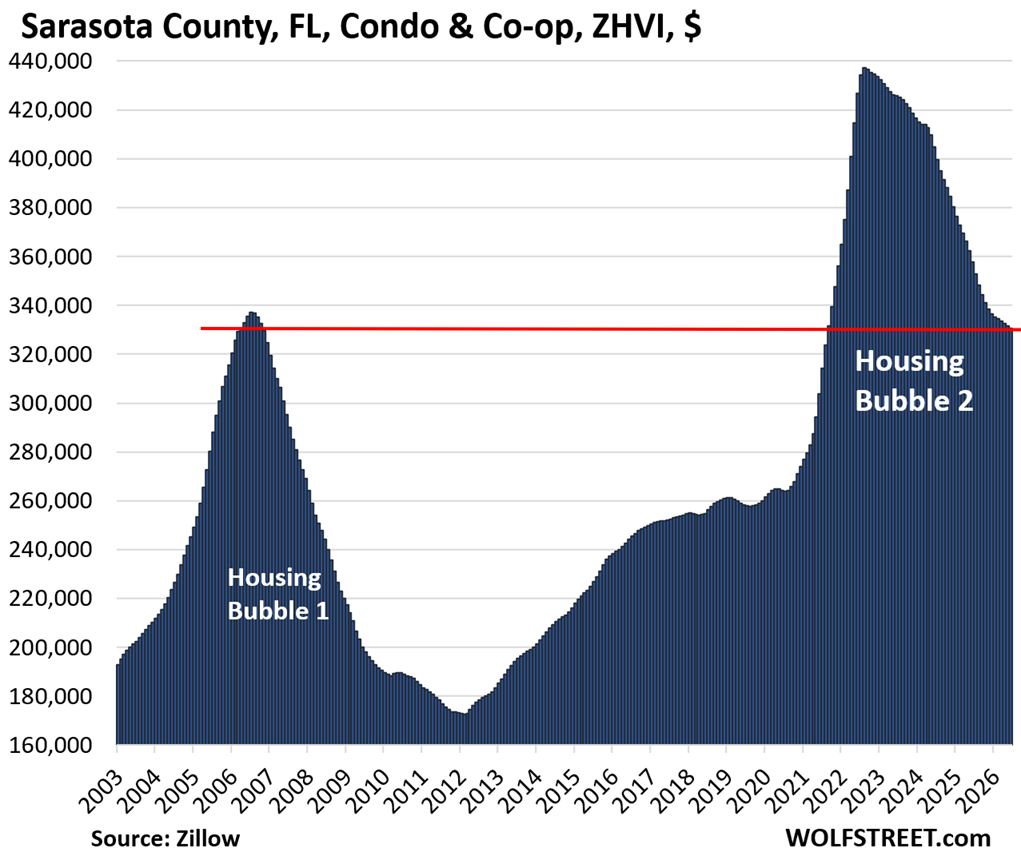
| Sarasota County, FL, Condo & Co-ops Prices | |||
| From Jun 2022 peak | MoM | YoY | Since 2000 |
| -24% | -0.2% | -7.6% | 129% |
Back to 2006.
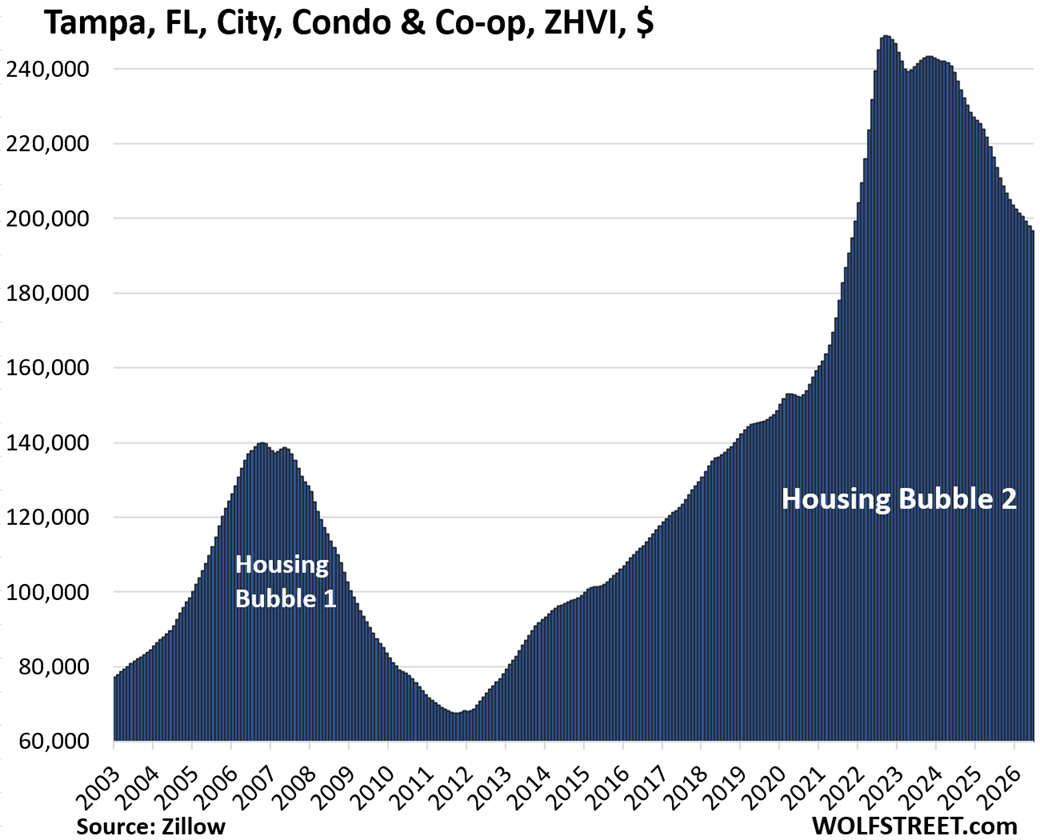
| Tampa, FL, City, Condo Prices | |||
| From Sep 2022 peak | MoM | YoY | Since 2000 |
| -21% | -0.6% | -9.1% | 245% |
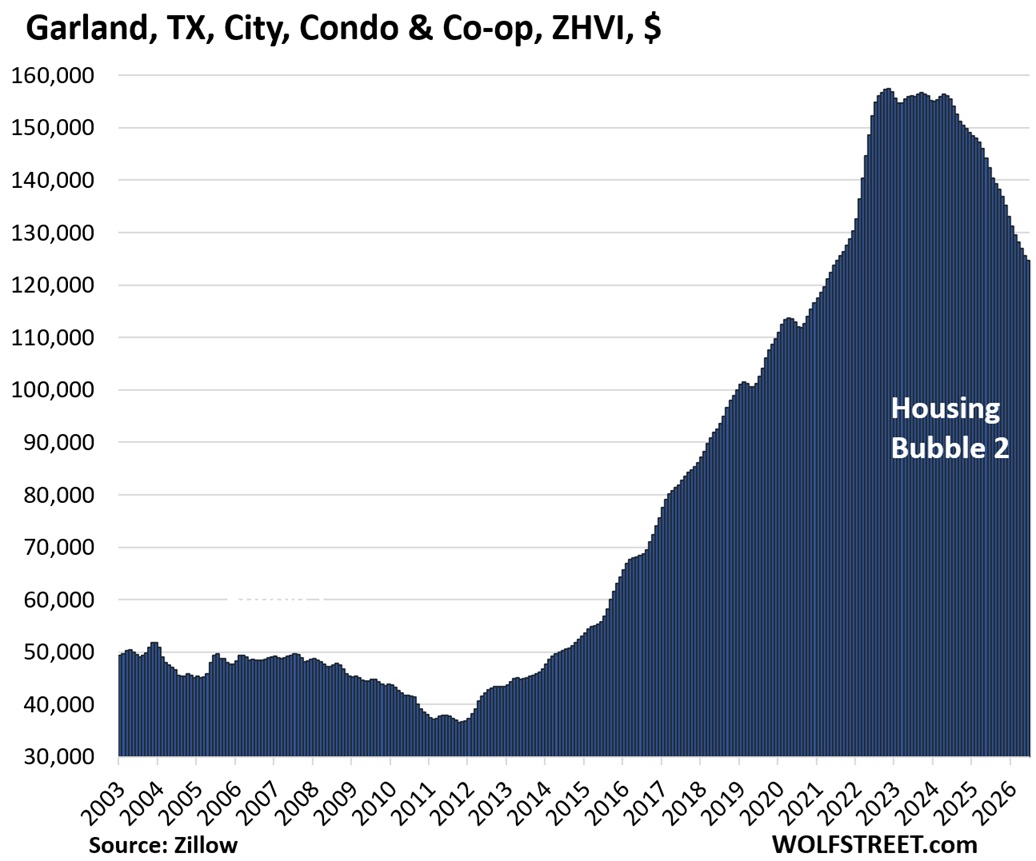
| Garland, TX, City, Condo Prices | |||
| From July 2022 peak | MoM | YoY | Since 2000 |
| -21% | -0.8% | -12.4% | 204% |
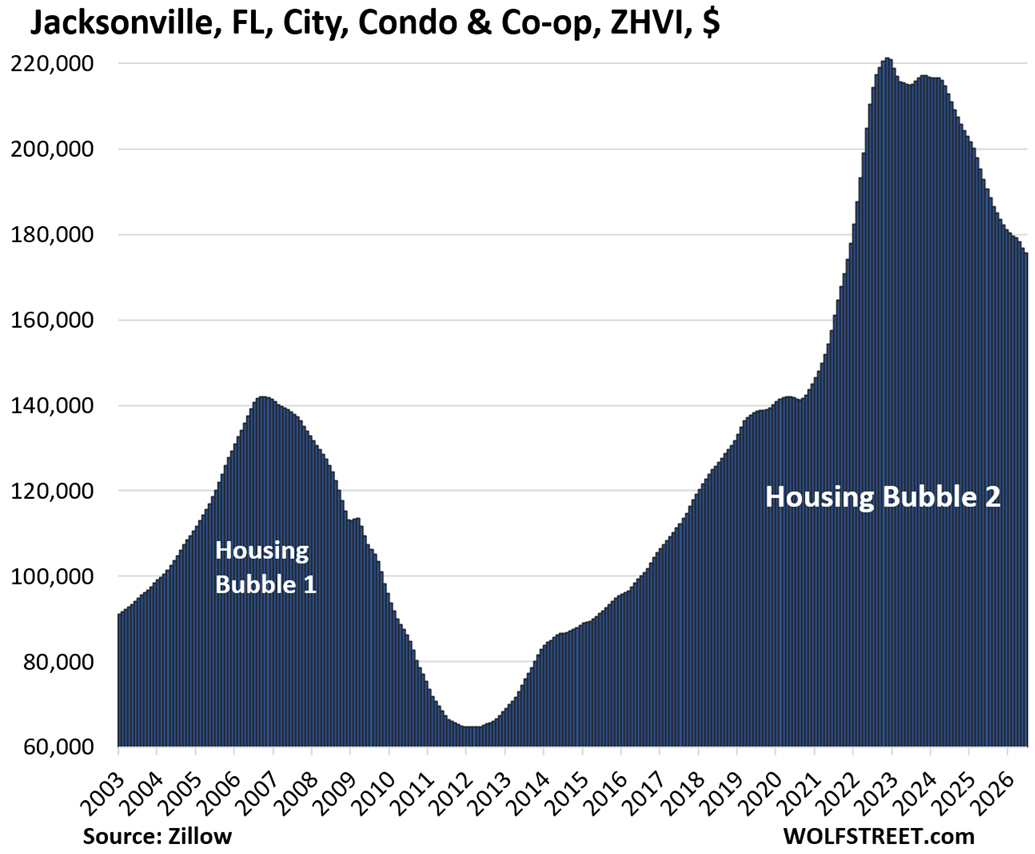
| Jacksonville, FL, City, Condo Prices | |||
| From Nov 2022 peak | MoM | YoY | Since 2000 |
| -21% | -0.7% | -7.9% | 140% |
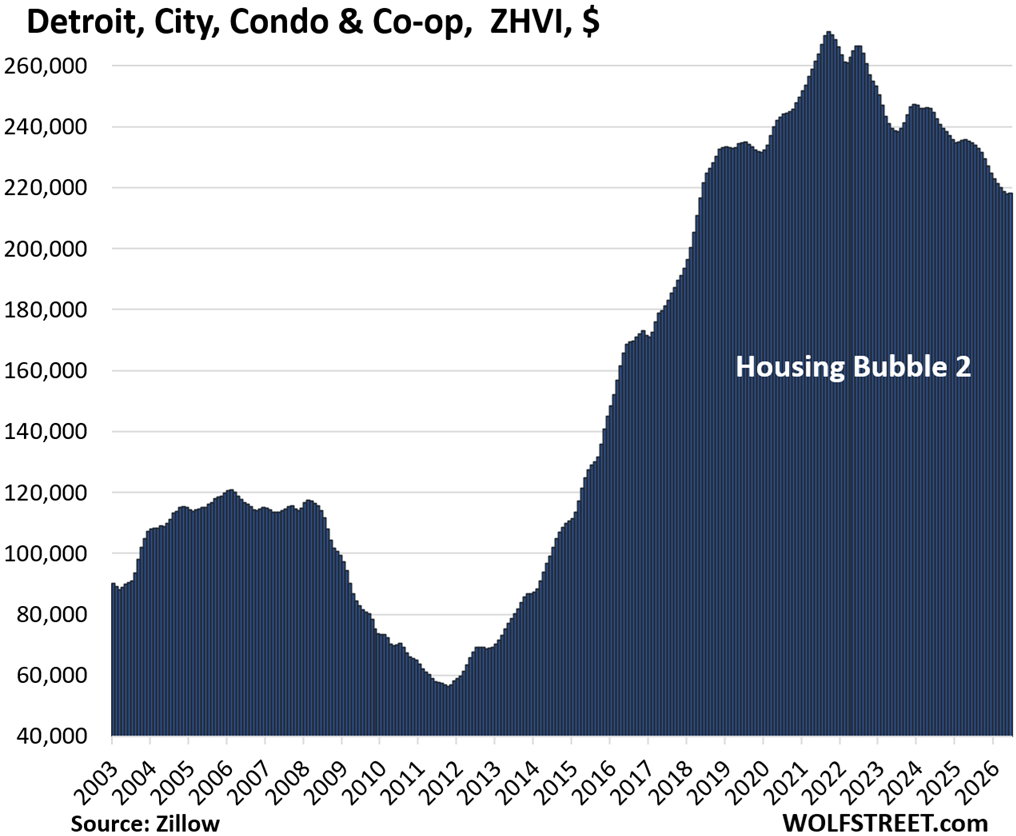
| Detroit, MI, City, Condo Prices | |||
| From Sep 2021 peak | MoM | YoY | Since 2000 |
| -19% | 0.2% | -7.0% | 244% |
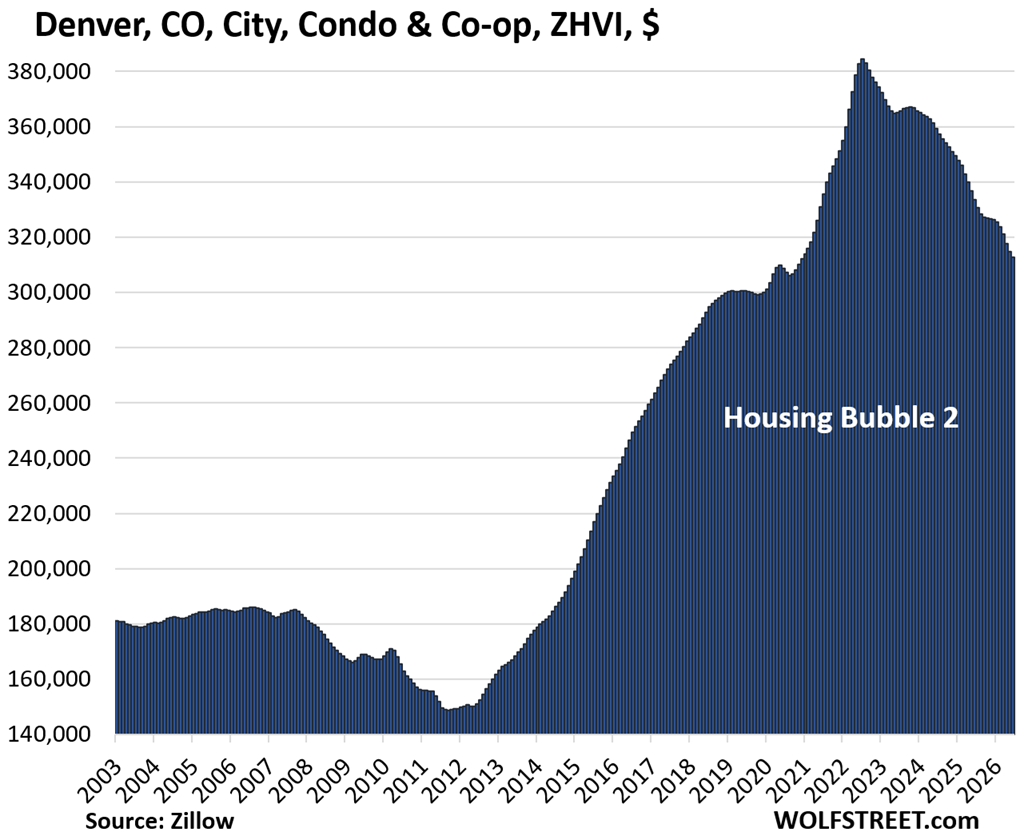
| Denver, CO, City, Condo Prices | |||
| From Jul 2022 peak | MoM | YoY | Since 2000 |
| -19% | -0.6% | -6.3% | 127% |
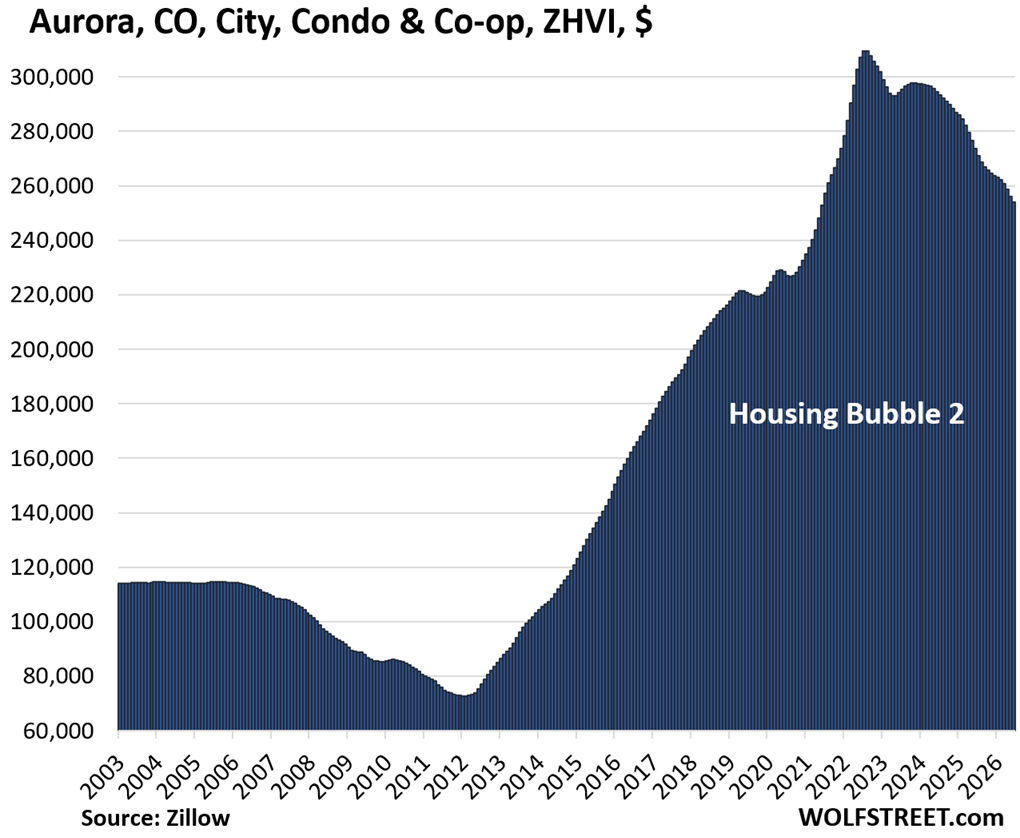
| Aurora, CO, City, Condo Prices | |||
| From Jul 2022 peak | MoM | YoY | Since 2000 |
| -18% | -0.9% | -7.2% | 190% |

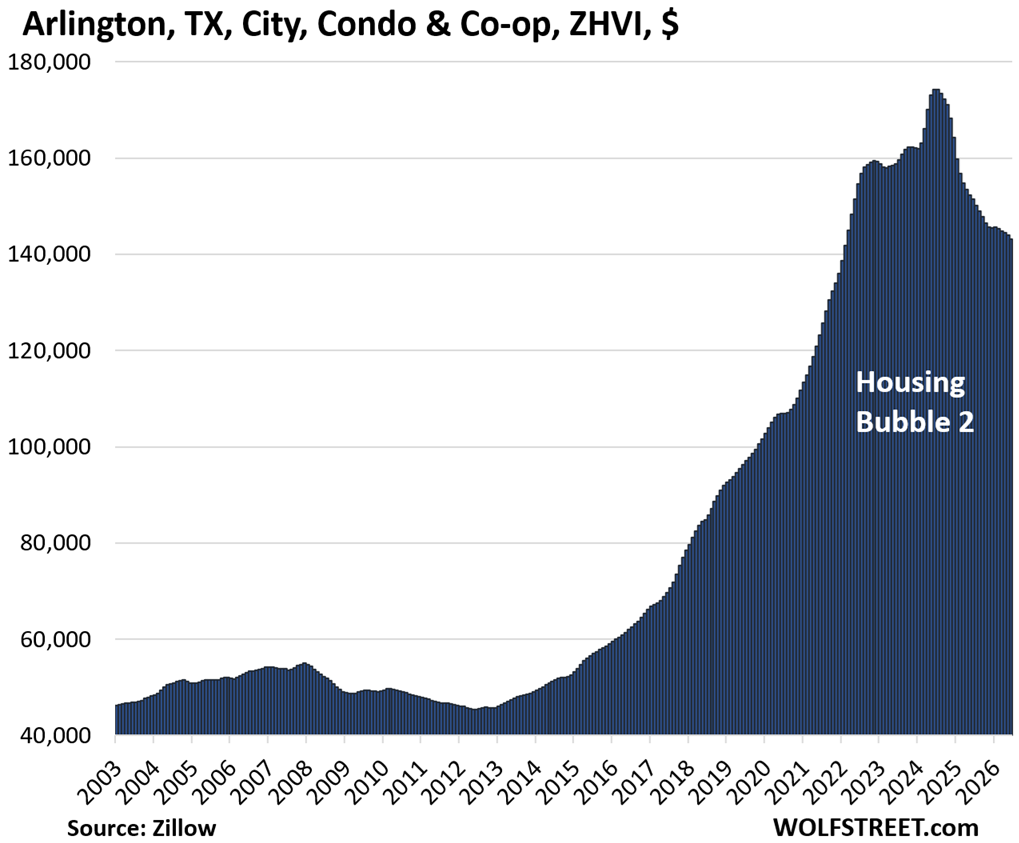
| Arlington, TX, City, Condo Prices | |||
| From Jun 2024 peak | MoM | YoY | Since 2000 |
| -18% | -0.6% | -5.4% | 225% |
| Collier County (Naples), FL, Condo & Co-ops Prices | |||
| From Jun 2022 peak | MoM | YoY | Since 2000 |
| -18% | -0.5% | -6.1% | 152% |
| Orlando, FL, City, Condo Prices | |||
| From Jan 2024 peak | MoM | YoY | Since 2000 |
| -17% | -0.7% | -8.3% | 146.7% |
Prices are back where they’d been at the peak of Housing Bubble 1 in the fall of 2006.
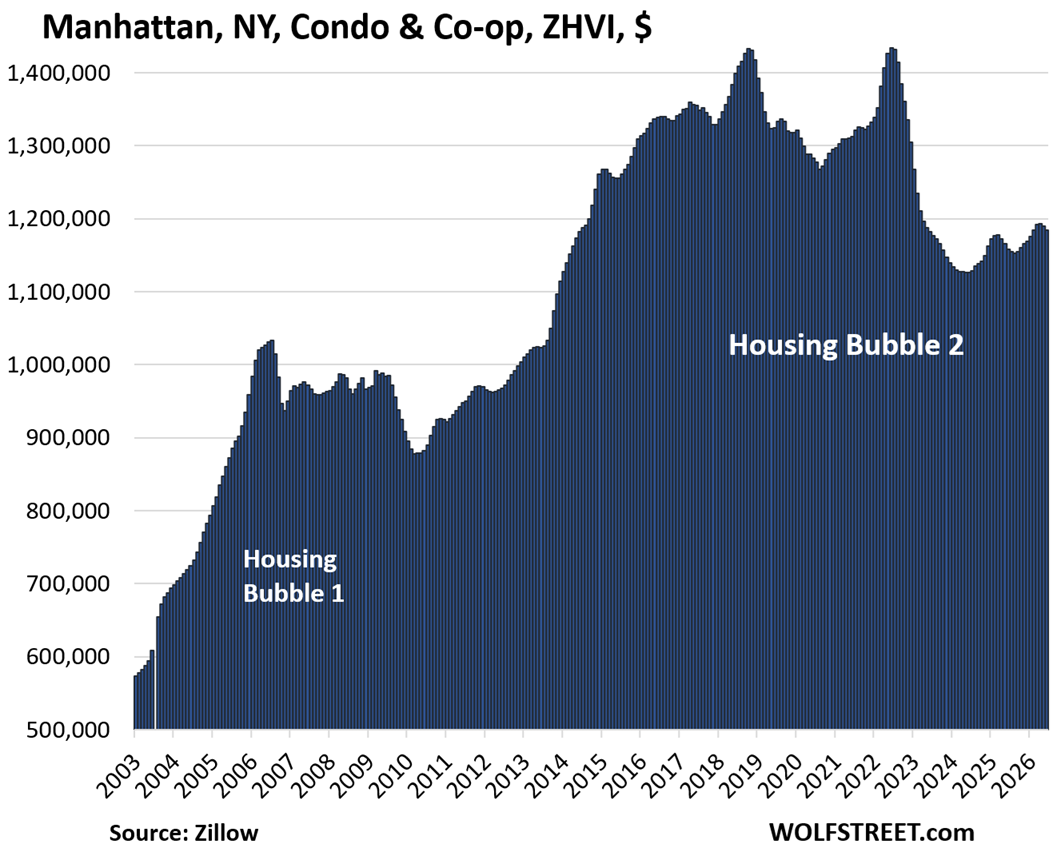
| Manhattan, NY, Condo & Co-Op Prices | |||
| From Jun 2022 peak | MoM | YoY | Since 2000 |
| -17% | -0.4% | 2.2% | 216% |
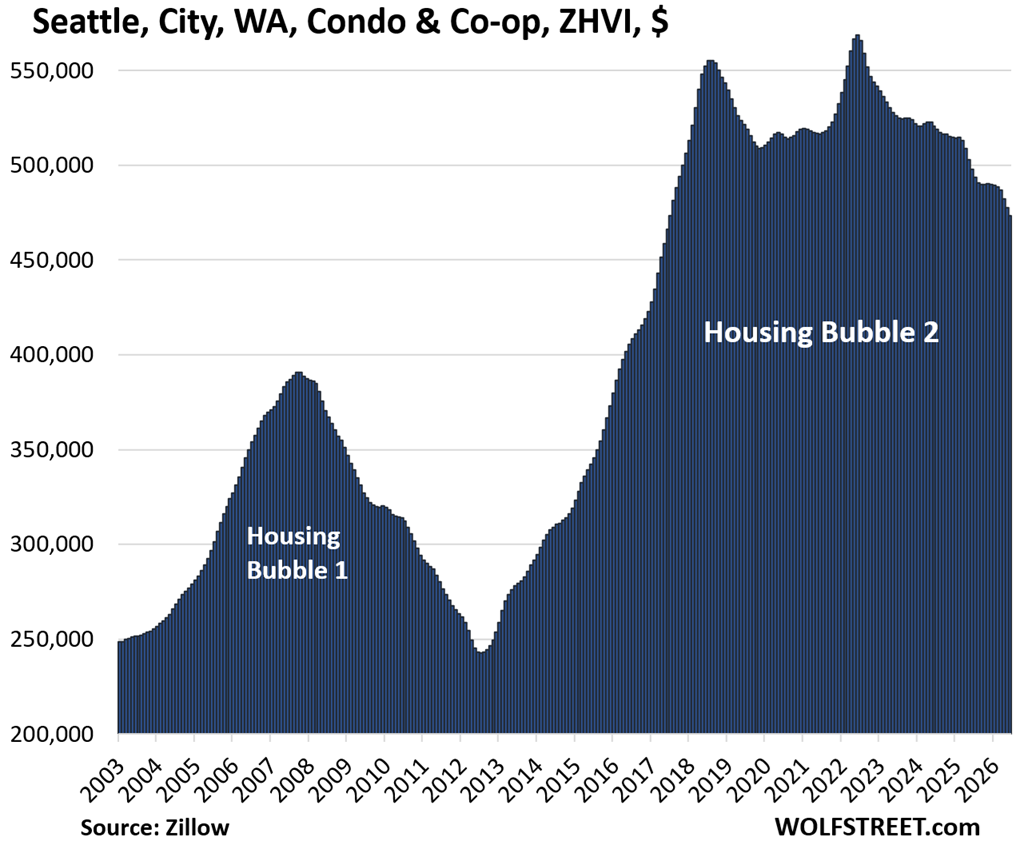
| Seattle, WA, City, Condo Prices | |||
| From Jun 2022 peak | MoM | YoY | Since 2000 |
| -17% | -0.9% | -4.9% | 128% |
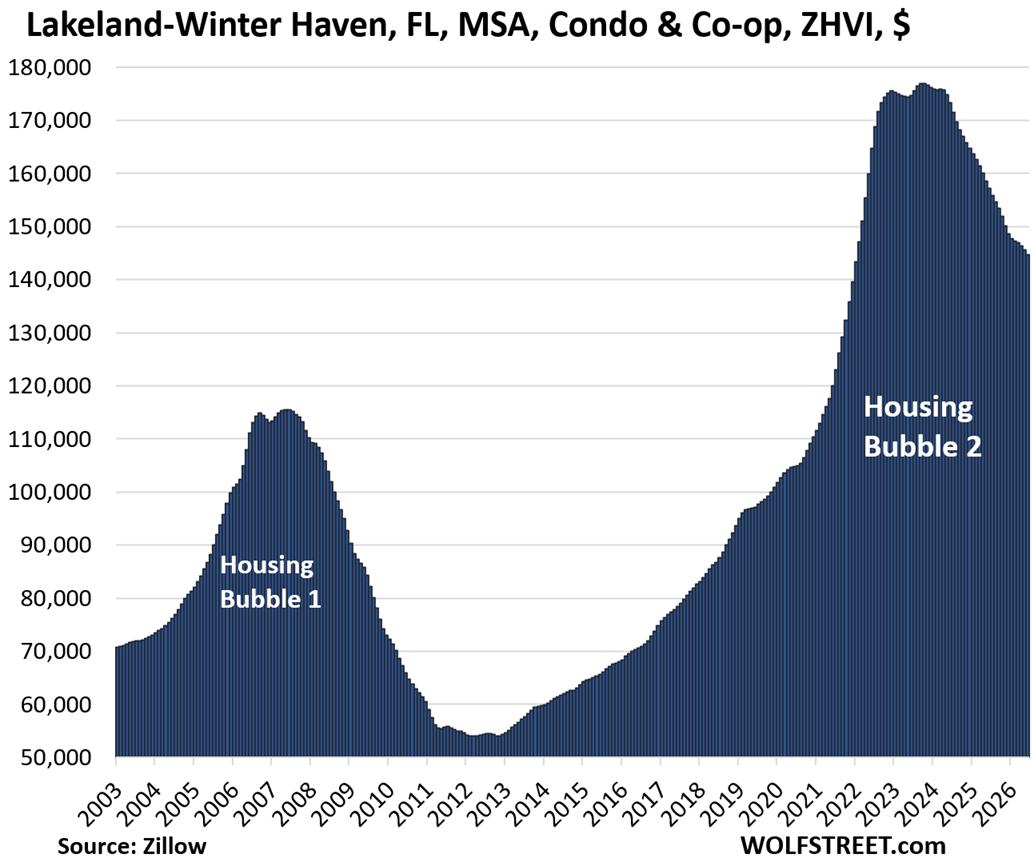
| Lakeland-Winter Haven, FL, MSA, Condo Prices | |||
| From July 2022 peak | MoM | YoY | Since 2000 |
| -17% | -0.5% | -7.9% | 122% |
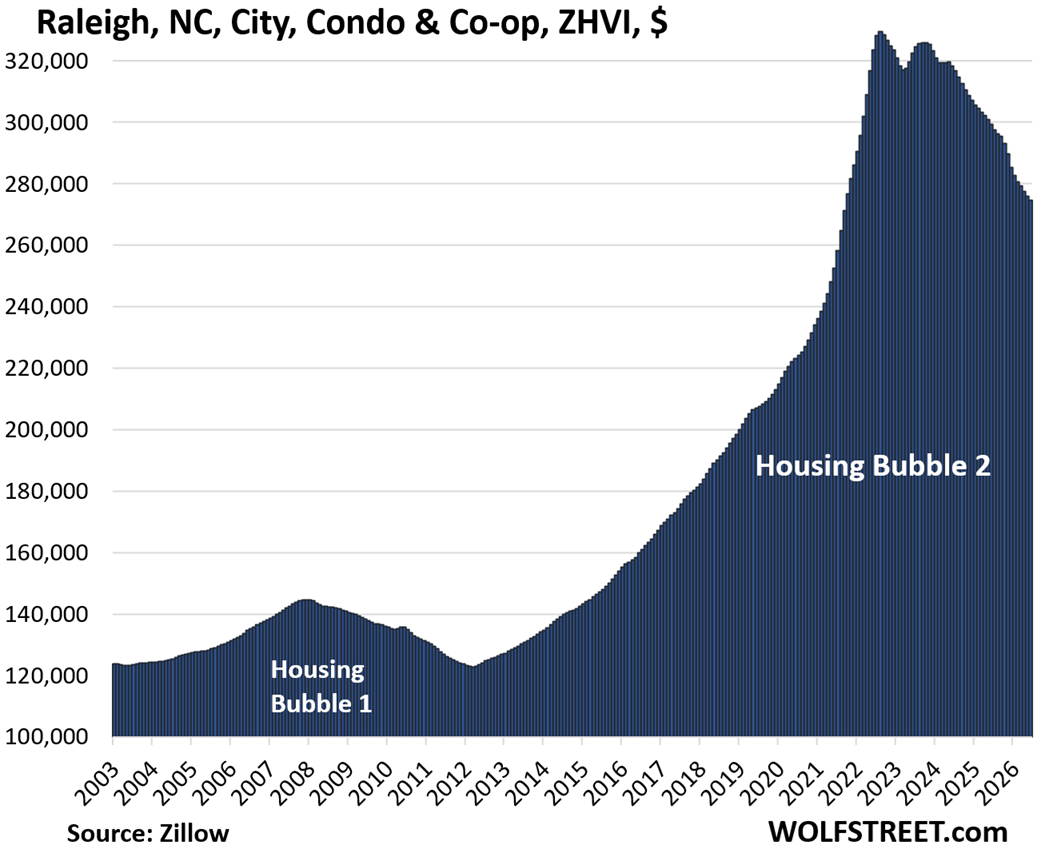
| Raleigh, NC, City, Condo Prices | |||
| From July 2022 peak | MoM | YoY | Since 2000 |
| -17% | -0.5% | -8.3% | 131.4% |
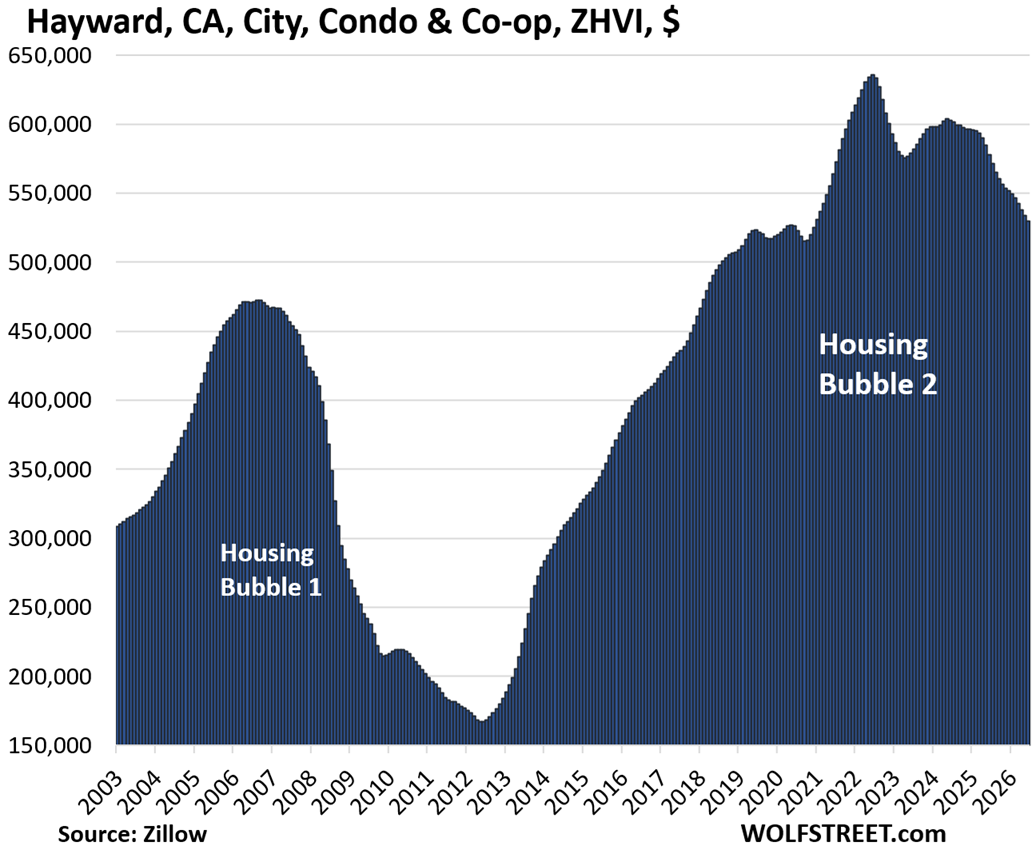
| Hayward, CA, City, Condo Prices | |||
| From July 2022 peak | MoM | YoY | Since 2000 |
| -17% | -0.7% | -8.4% | 174% |
Hayward, Oakland (see above, -32%), and Fremont (see below, -15%) are among a bunch of cities that make up the East Bay.
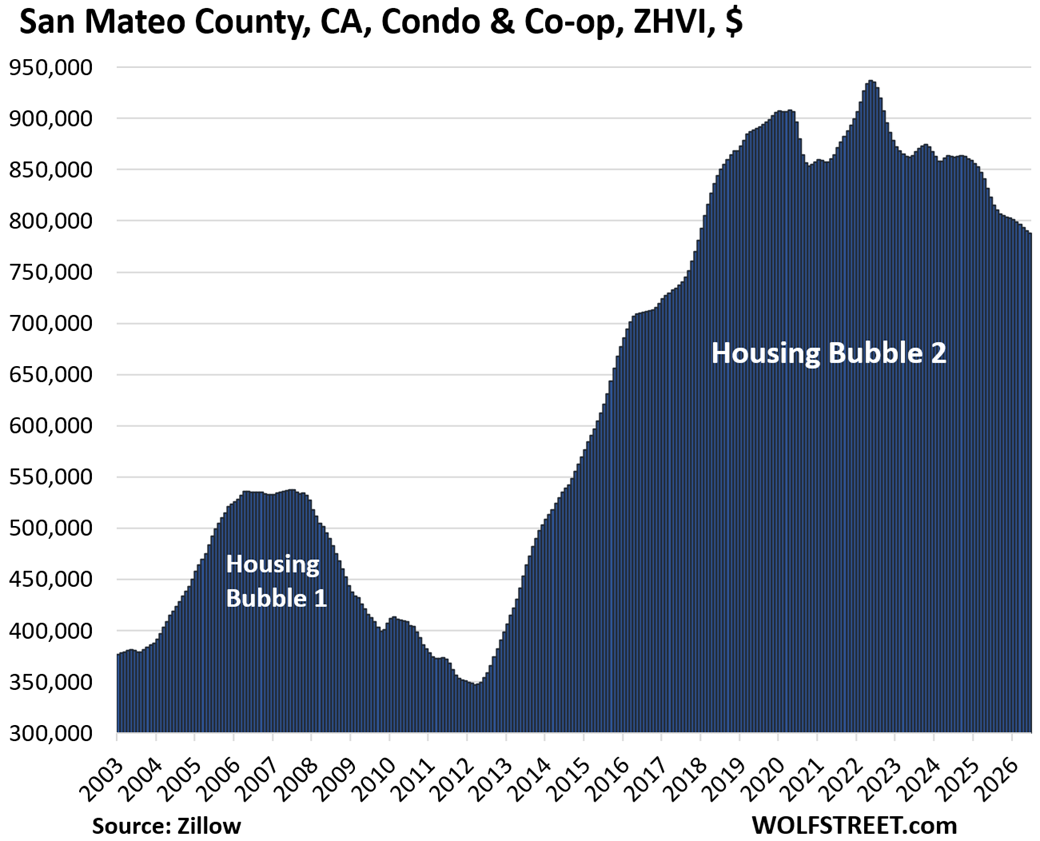
| San Mateo County, CA, Condo & Co-op Prices | |||
| From Jun 2022 peak | MoM | YoY | Since 2000 |
| -16% | -0.3% | -4.3% | 191% |
San Mateo County makes up northern Silicon Valley.
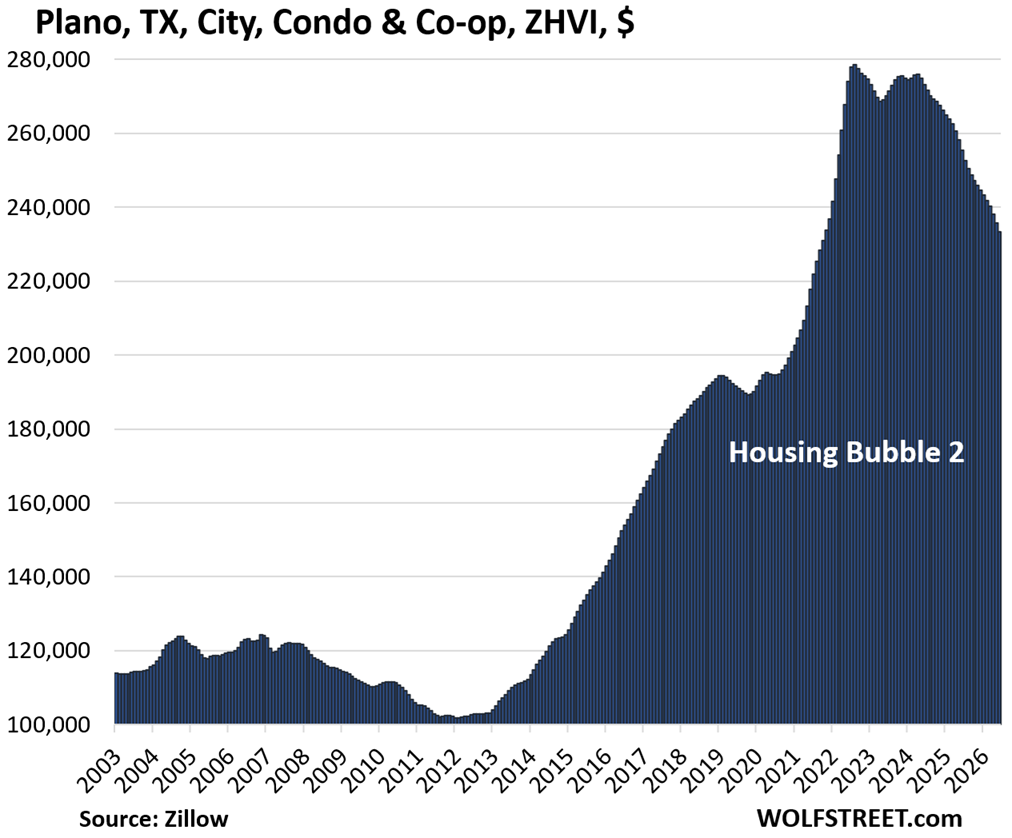
| Plano, TX, City, Condo Prices | |||
| From Aug 2023 peak | MoM | YoY | Since 2000 |
| -16% | -1.0% | -8.6% | 122% |
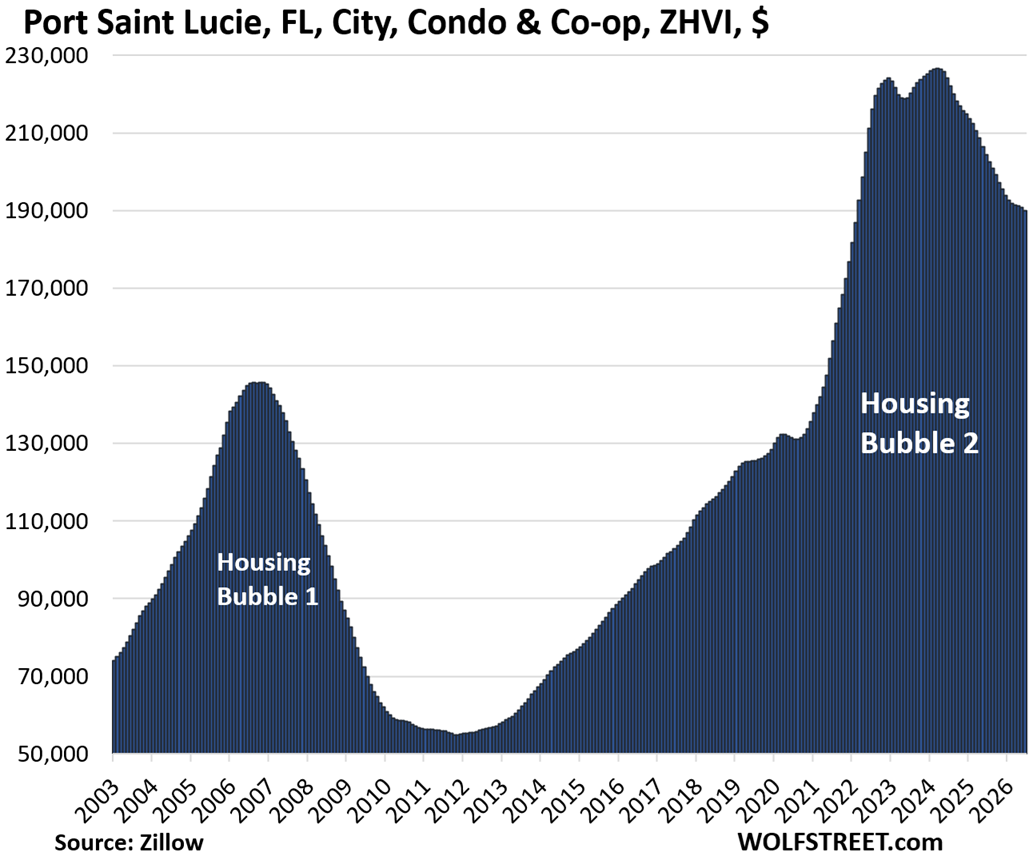
| Port Saint Lucie, FL, City, Condo Prices | |||
| From July 2022 peak | MoM | YoY | Since 2000 |
| -16% | -0.4% | -7.0% | 226.9% |
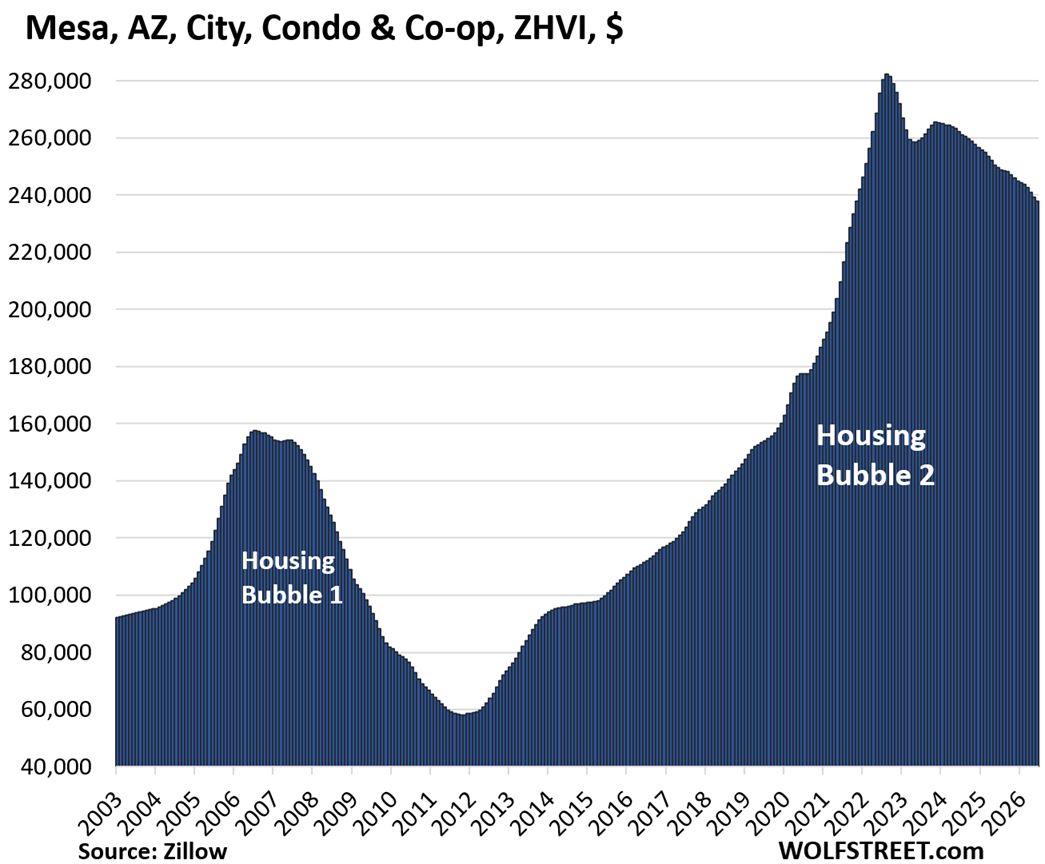
| Mesa, AZ, City, Condo Prices | |||
| From Aug 2022 peak | MoM | YoY | Since 2000 |
| -16% | -0.7% | -4.7% | 196% |
| Fremont, CA, City, Condo Prices | |||
| From May 2022 peak | MoM | YoY | Since 2000 |
| -15% | -1.0% | -6.8% | 195.1% |
| Portland, OR, City, Condo Prices | |||
| From Jun 2022 peak | MoM | YoY | Since 2000 |
| -15% | -0.7% | -4.0% | 104% |
| Phoenix, AZ, City, Condo Prices | |||
| From Aug 2022 peak | MoM | YoY | Since 2000 |
| -15% | -0.5% | -4.0% | 227% |
| Reno, NV, City, Condo Prices | |||
| From Jun 2022 peak | MoM | YoY | Since 2000 |
| -15% | 0.0% | -3.5% | 241% |
| Chandler, AZ, City, Condo Prices | |||
| From Aug 2022 peak | MoM | YoY | Since 2000 |
| -15% | -0.7% | -4.3% | 203.2% |
| Boise, ID, City, Condo Prices | |||
| From Jun 2022 peak | MoM | YoY | Since 2001 |
| -15% | -0.4% | -1% | 221% |
Where condo prices fell less than 15%.
In many cities, condo prices have dropped by less than 15% or less, and they didn’t make the 15% cutoff for the table above and for the charts here.
Here is a sample list of 39 bigger cities where prices have dropped by 8% to 14% from their respective peaks. Several of them are only one or two bad months away from joining the above list, including one of the biggest cities in the country, Houston. Dallas isn’t far behind.
| Mid-tier condo prices fell by 8% to 14% | |||
| Market | Since peak | Year of peak | |
| 1 | Houston, TX | -14% | 2024 |
| 2 | Queens, NY | -14% | 2022 |
| 3 | San Antonio, TX | -14% | 2024 |
| 4 | Tempe, AZ | -14% | 2022 |
| 5 | Glendale, AZ | -14% | 2022 |
| 6 | Huntsville, AL | -14% | 2022 |
| 7 | Dallas, TX | -14% | 2023 |
| 8 | Scottsdale, AZ | -14% | 2022 |
| 9 | Irving, TX | -13% | 2023 |
| 10 | Sacramento, CA | -13% | 2022 |
| 11 | Colorado Springs, CO | -13% | 2022 |
| 12 | Stockton, CA | -13% | 2022 |
| 13 | Corpus Christi, TX | -13% | 2023 |
| 14 | Fort Lauderdale, FL | -12% | 2022 |
| 15 | Modesto, CA | -12% | 2022 |
| 16 | Henderson, NV | -12% | 2022 |
| 17 | Las Vegas, NV | -12% | 2022 |
| 18 | Spokane, WA | -11% | 2022 |
| 19 | Nashville, TN | -10% | 2022 |
| 20 | Atlanta, GA | -10% | 2023 |
| 21 | Washington, DC | -10% | 2022 |
| 22 | Elk Grove, CA | -10% | 2022 |
| 23 | New Orleans | -10% | 2022 |
| 24 | Salt Lake City, UT | -9% | 2022 |
| 25 | San Francisco, CA | -9% | 2022 |
| 26 | Memphis, TN | -9% | 2024 |
| 27 | Fort Worth, TX | -9% | 2024 |
| 28 | San Diego, CA | -9% | 2023 |
| 29 | Los Angeles, CA | -8% | 2022 |
| 30 | Minneapolis, MN | -8% | 2021 |
| 31 | San Jose, CA | -8% | 2022 |
| 32 | Miami, FL | -8% | 2023 |
| 33 | Marietta GA | -8% | 2024 |
| 34 | Lubbock, TX | -8% | 2022 |
| 35 | Oklahoma City, OK | -8% | 2023 |
| 36 | Tucson, AZ | -8% | 2023 |
| 37 | Wilmington, NC | -8% | 2022 |
| 38 | St. Louis, MO | -8% | 2023 |
| 39 | Long Beach, CA | -8% | 2023 |
A reminder of the special issues condos face.
Condos play several roles, depending on the owner:
Some people buy condos as a home to live in an urban center or along the shore, to enjoy the big views, nice amenities, or central location. They value the worry-free living, such as not having to mess with maintenance, repairs, and yardwork; or having staff at a desk by the front door. Some value not having to climb stairs, etc.
Others buy condos as rental properties as a way to get into the multifamily rental business, or they try their hand at short-term vacation rentals. Or they buy them as vacation homes. Others, especially nonresident foreign investors, buy condos to park some cash in the US and watch the price spiral higher from a distance. It’s these investors and speculators that make condos particularly speculative and prices subject to huge bubbles and busts.
Some of the special issues:
- Over the long term, land appreciates, most buildings depreciate to zero and are eventually torn down. The land that big condo buildings sit on can be very valuable, but each condo owner only owns a tiny slice of it. The rest of their investment is in the building. A single-family house may sit on less valuable land, but the homeowner gets 100% of any appreciation of the land.
- Prices that exploded over the past few years ended up being way too high, once the mania settled down.
- Hefty special assessments – or the fear of them – for long-neglected major repairs dog some older condo buildings.
- Big increases in HOA fees at many properties, partly driven by spiking insurance costs in natural disaster zones, add substantially to the monthly costs of condos.
- If a condo building is on Fannie Mae’s Blacklist, financing a unit in that building gets very difficult, and sales may be limited to cash buyers who’ll exact their pound of flesh.
- The Free Money has ended, and mortgage rates are roughly back to a normal range. Buyers of single-family homes face the same issue.
- Foreign-based owners who’ve had it with the US and want to sell. And there are fewer foreign-based buyers.
- Investors in condos as rental properties are facing stiff competition from a wave of newly completed higher-end apartment buildings that developers are trying to find tenants for.
And in case you missed it: Pending Home Sales Plunge to Near-Record Low in the Data, Hit Low in the West. Since then, Mortgage Rates Rose Further
Enjoy reading WOLF STREET and want to support it? You can donate. I appreciate it immensely. Click on the mug to find out how:


One reason for the big drop in the Florida condo prices is probably the 2025 change in Florida condo law, in response to the Surfside condo collapse in 2021, requiring more structural inspections and higher funding of condo financial reserves. These changes are causing higher assessments in Florida condos, and presumably reducing sale prices.
I think the whole enchilada is one grain of sand away from the one grain that causes a catastrophic failure of the economic structure where we buy shit because we have money, eg capitalism versus
we buy shit because we have money, socilaism
That’s from the levels where the most fearless debt donkeys bought properties, which is to say — they did not drop much at all.
Prices seem to be up at least in nominal terms where I live. As far the decreases in the charts above…the prices still seem kind of high, even with the declines. Waiting might help, though interest rates could go up, which of course is fine if you are paying cash. A recession would drive prices down. I think there is a chance that waiting will be counterproductive as well. Where I live prices are up of the closing sales I have been monitoring.
Staten Island? That would be about right. Every market is different:
IN my place, prices are going down although very slowly. Waiting and renting to buy a typical house in my hood, will save you approx $5k/month, not considering falling equity .
The math favors renting.
i would love too know what Wolf’s interpretation of Jamie Dimon’s exclamation that he would not buy long term Treasuries because he doesn’t understand the up side,
What the hell does that mean
My response is what it has been for a while: yields are still too low to risk buying long-dated Treasury securities — except for maybe TIPS; they have a different risk profile. But Dimon wasn’t talking about TIPS, he was talking about the nominal 30-year bond.
My fear isn’t a temporary drop in market value since I intend to hold bonds to maturity, when I get paid face value. My fear is that the yield will not adequately compensate me for inflation (which eats up the purchasing power of the face value) and for the other risks I’m facing with a 30-year bond.
I remember thinking back in 2022 that this insanity couldn’t continue. I wasn’t very popular at parties. It’s nice to be vindicated.
Trouble is, you’ll be even more unpopular now…
Why Wolf, live in Chicago and prices are going up. What’s going on here?
Condos in the City of Chicago (in the huge metro area). So yeah, they’re going up but they’re still barely above where they had been in 2006.
Ok, but what is not dropping are the property taxes, property insurance and condo maintenance fees……………
Good luck all.
Well if values go down, property taxes will as well. If not, consider yourself lucky in your unit selection as it’s defying the trend.
The UAD 3.6 appraisal mandate is, from what I have been reading, going to make the condo appraisal process much more detailed and could cause a lot of older condo developments to lose even more value if they are not compliant with the newer and stricter financial and maintenance requirements. If they don’t appraise, they don’t sell.
It starts in November of this year if I remember correctly. Might be a good idea to sell now.
Hi Doug P. Where did you learn about UAD 3.6? Did you land on it accidentally like I did (by reading your post) or deliberately ?
Lots of changes to the real estate financing market are coming in November, haven’t looked into it too thoroughly but it seemed largely focused on condo/multifamily but with some stuff also affecting sfh. Mostly to do with fannie/freddie gov’t loans if I remember correctly.
Didn’t strike me as all that important for me or my market so I skimmed it. Probably missing a lot of details.
I first heard about it from a real estate broker friend that had heard it from an appraiser on a sale of his. I looked into it at the time and nobody had even heard about it. I mentioned it to several agent friends and they were concerned regarding how it applies to condos especially due the many older developments that need a lot of work which might not meet Fannie and Freddie approval.
In October of this year, California Fair Plan fire insurance premiums are scheduled to jump by about 30%, on average. Another hidden gem.
This sure looks like a major repricing, done in slow motion. Sure doesn’t look like a housing or supply crisis to me so long as you’re ok in a condo. All the complaints from first time buyers about lack of affordability…take a look at condos! Yeah, I know, HOA fees, taxes, etc.
Alot of those graphs aren’t back to 2020… yet. So there’s room to go before they become affordable. A lot of the problem is the HOA. Who wants to pay $650 a month forever (plus it will keep going up with inflation)?
Also with all the new build apartments you can rent a really nice apartment for cheaper and not worry about special assessments
“A lot of the problem is the HOA. Who wants to pay $650 a month forever (plus it will keep going up with inflation)?”
Over the long run, condo maintenance fees per unit should be lower than equivalent maintenance fees per housing unit. Replacing a roof over 10 floors of condo units is cheaper per unit than over a single home. Replacing 500 windows in a complex is cheaper per window than 10 in a single home due to volume discounts. A lot will depend on layout of the condo and whether the homeowner is honestly accounting for costs of maintenance, including the value of time if going DIY.
Now we know where people want to live…
🤣 that’s one way of looking at it
It’s interesting that several of these charts suggest that condos are fair valued relative to 2003 (+100% in price, approximately matching CPI).
Well, CPI +85% since 2003, but comment still applies. By the end of the year, more cities will likely be close to fair valued since 2003.
You couldn’t force me to buy a condo, or any attached product or HOA BS. $1 is too much.
I used to dislike HOAs until I saw what some people will do when left to their own devices.
I live in a suburban neighborhood. As an example, I have no interest in living next to someone who has a 2 car driveway but has 9 “project cars” that he’s constantly tinkering with, and taking up all of the street spaces with the excess.
Many residential neighborhoods also have HOAs with their associated charters of do’s/dues and don’ts.
Market pricing for townhomes might also be interesting.
Yes, and some municipalities have rules like that even where there are no HOAs.
My point is that the HOAs and their rules exist for the bottom 10-15% that can’t conform their behavior to society’s expectations unless forced to.
Don’t worry, municipalities are starting to equip gov’t vehicles with Flock-type cameras with AI capabilities that will monitor for code violations and will flag with video/picture evidence when you have a lawn that is 1″ too tall or a “no step on snek” flag on your front door. The local government will be able to enforce HOA rules soon, no need for Agatha the 85 year old busy body.
I don’t like HOA generally but for cookie cutter neighbor of sfr, this is necessary to keep the appearance of homes sane.
If you have big chunk of land in acres, then HOA is not needed.
For condos, townhomes and cookie cutter subdivision sfrs, HOA is a necessary evil
I have seen neighborhood without HOA and I just can’t withstand it.
I happen to like the diversity of exteriors in the non-HOA neighborhoods I’ve lived in. Plus, we have fewer instances of people mistaking their neighbor’s house for their own.
“If you have big chunk of land in acres, then HOA is not needed.”
Yes, then all you have to deal with is the local zoning board. Which everyone agrees is completely reasonable and rational and so much better than an HOA.
Don’t ask how I know this.
Non-HOA neighborhoods for 23 years now. Thanks, I’m good.
The beauty of America –everyone gets to choose what suits them.
TS,where I rent and want to live houses are far apart,project car guy would be my new friend,and…..,as a friend would help him get the rigs built up!
Of course,with a lot of acreage we(including me) have a lot of folks who shoot on a regular basis,tis safe due to space/good backdrops etc. but many would hate it,me…..,I love it!
I agree with you that if people have tons of land, I don’t really care what they do. But if someone has a normal 3 bedroom house on 1/6th of an acre in the suburbs, I don’t want him taking up every street spot meant for guests with his project cars, and I don’t want him parking rusted RVs or boats in the front yard either.
Just 9 cars ? I saw one modest home with a giant driveway with like 20 cars. That shit appears on google maps. Make sure to check the terrain view.
A good friend owns a condo management company here in Ontario Canada. They manage over 47 condo.
His advice “Never buy a condo.”
It isn’t just the strata fees (HOA), it is the make up the strata councils themselves making financial decisions that affect you. Other owners, some who know absolutely nothing but are strident members ‘voted in’, can push things through. A relative owned a patio home with a dysfunctional strata council. They voted to replace all the roofs, at $50K per. !00% too much at the very least. The arguments and fighting went on for months. They eventually got new roofs, but at a fraction of what was first agreed to. It was a very painful process. And think if the windows need replacing or if there are moisture issues in someone else’s unit? Sometimes a condo has linked developments, sister buildings. Yours might be the older well built sound one, but the new one might leak and needs a refit. That is what happened to my friend. It cost him $50K. And that was 15 years ago.
Don’t like it? You get to attend numerous meetings, fight about stuff, and phone lawyers. No thanks.
Danno,
Canada, esp. Toronto and Vancouver, has a gigantic condo problem as they overbuilt with these tiny condos no one wants to buy and whose prices have collapsed, and pre-construction buyers (retail speculators) – how developers fund the construction costs – got totally hosed, and they cannot sell those units, and developers cannot sell those units without going bankrupt.
So the idea would have been to let this shake out, to let these developers go bankrupt and pre-construction speculators lose all their money, which will create a lower cost basis for those condos that then could be sold or rented out.
But no! Can’t let those developers and retail speculators get hosed. To address the issue in Vancouver, the BC government, along with the federal government, stepped in with a fund to buy these condos and rent them at low rents – this is designed as a bailout of real-estate developers, on the old rule: privatize profits, socialize losses.
It’s not quite that bad in the US yet.
I read a long article in Macleans (Canadian) magazine on this condo runup; they basically preyed on speculators, of which one is born every minute.
My favorite takeaway: there was a glitzy ad for the very type of condos cited in the article in the same issue of the magazine!
Lots of Chinese and other East Asian migrants to these regions of Canada in those years, who projected their home mindset.
Not so different from Americans I meet who buy rambling old estate houses in European villages and don’t realize it’s a lot more difficult to DIY restore 200 year old stone custom construction than knocking down sheet rock walls with a sledgehammer in a 50s ranch.
Insanity
Yup. it was a doofus move. Sure, there are other considerations because they are picking them up at a discount…..supposedly for low income housing. But here is where that justification also tanks. Working folks just doing their best have to suck it up and pay market value for what they rent. But if you qualify for low income, you get another subsidy and the same place cheaper. I’m not sure what the answer is but Govt should stay out of it.
In the YVR condo building surge, many folks doing FOMO put down hefty deposits to secure their unit. I have read many accounts of projects stalled, not finished, but those who put down a pre-build deposit did not get a refund.
I live in the cantankerous boonies for a reason. :-) Although, outsiders are now coming in and putting lipstick on crapshacks and listing them for prices that will never sell. There is even one developer developing 5 acre estates. (property only).
I would love to be able to compare the change in the monthly payment to changes in taxes and HoA fees. I am guessing that adding those in to the monthly payment would tell the true story.
I served on an HOA board in Fremont, CA before I sold my townhouse. I am torn between buying another one. If the HOA is reasonably managed, no amenities (clubhouse, pool, gym, etc) and has cash reserves, they can be a great alternative to buying a single family home. But, amenities and service inflation continue to drive HOA dues higher. I would have to see another 15-20% drop in condo prices to buy in Fremont again to offset property taxes and HOA dues. Oakland is off-limits because most HOA dues are in excess of $1000 a month because of poor management and no reserves to fix up older properties not to mention insurance. No sense in buying a sinking ship.
The idea of a condo seems attractive in many ways. But in practice it’s one of those deals where the buyer is facing a significant disparity of information that the seller has (at least in theory).
Who knows what the condition of the building is. Who knows what the dynamics of the HOA are.
The rule in the US increasingly seems to be: the larger the group of people you bind yourself to, the greater the risk you face in having made a horrible mistake.
In the top three articles, two have 3 – three in their title. Are you showing your affiliations?
Just wondering….
Yes, I’m secretly affiliated with the numbers 30 and 33. But don’t tell anyone.
LOL
“homeowner gets 100% of any appreciation of the land.”
But the land value is still a fairly small fraction of the overall SFH price (particularly on the .10 acre CrackerJack Boxes that have become the favorite of “developers” since the dawn of ZIRP).
It might be helpful to post some rough raw land/finished lot figures from metros around the country. I know that is harder info to get.
A measure of just how abundant raw land is in the US (taken as a continental whole), there are plenty of states where a raw acre is perhaps $5-$10k on average.
For a full acre.
Granted that is a statewide average – obviously metro proximity and major road access make a serious difference.
But raw land ain’t like 50% of $400k, for the .1 acre house that became the post ZIRPs norm/median.
In the land-starved coastal outliers, the land might be 15-20% of the home price.
But that is a pretty good reason for the US to look beyond the land-starved coastal outliers.