
Unabated fears of inflation and worries about the onslaught of new debt keep pushing up long-term yields.
By Wolf Richter for WOLF STREET.
The yield of 30-year Treasury Inflation Protected Securities (TIPS) rose to 2.91% on Thursday and closed at 2.87% on Friday, the highest since 30-year TIPS were reintroduced in February 2010, up from -0.6% at the end of 2021.
This TIPS yield is paid in addition to the CPI-based inflation protection that TIPS holders receive and that is added to the principal and is paid when the TIPS mature. So the principal of the TIPS grows over time with CPI. The coupon interest rate (the percentage is fixed for the term of the TIPS) is applied to the entire principal, including the inflation protection. As the principal grows over time with CPI, the interest payments increase, though the interest rate remains fixed.
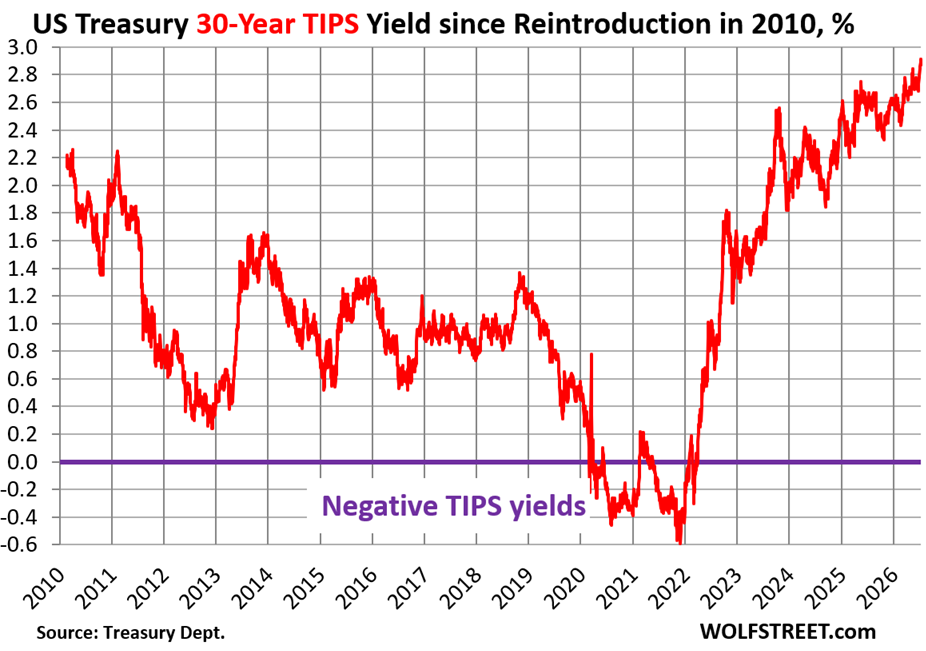
The Fed’s lead-footed pandemic QE, which included purchasing a large portion of the TIPS in the relatively small TIPS market, pushed the 30-year TIPS yield to -0.6% by the end of 2021. When the Fed began tapering QE at the end of 2021 and then ended QE in early 2022, and then began QT in the second half of 2022, the 30-year TIPS yield took off.
TIPS are not very liquid because there are not that many outstanding compared to other Treasury notes and bonds. There are currently only $2.16 trillion in total TIPS of all maturities outstanding, 6.8% of total marketable Treasury securities ($31.8 trillion). The Fed completely dominated the TIPS market during QE and still holds $380 billion, or 17.6% of all TIPS outstanding, including the amount of inflation protection.
If CPI inflation averages 2.15% per year, which is what the Fed would like us to “expect,” today’s TIPS buyers would get a combined yield of about 5.06% (30-year TIPS yield of 2.91% plus CPI inflation protection of on average 2.15%).
And that long-term average of 2.15% CPI inflation is about what the bond market “expects,” as indicated by the regular 30-year Treasury yield, which is currently 5.06%, compared to the TIPS yield of 2.91%. So if inflation actually averages 2.15%, the TIPS and the regular bonds of the same maturity would produce the same return.
But if CPI inflation averages 3.5%, todays TIPS buyers would get a combined yield of 6.41%. If CPI inflation averages 1%, TIPS buyers would get a combined yield of 3.91%. In both scenarios, today’s buyers of regular 30-year Treasury bonds would still get 5.06%.
Long-term bonds are not for the faint of heart 💔
The regular 30-year Treasury yield closed at 5.06% on Friday, about where it had been a week earlier, despite the outlier CPI report on Tuesday. This yield is at the very high end of the range since its reintroduction in 2006.
In March 2020, as the 40-year bond bull market was flipping into a bear market, the 30-year Treasury yield had plunged to 1.0%, and briefly a hair below. And that was the bottom in yields.
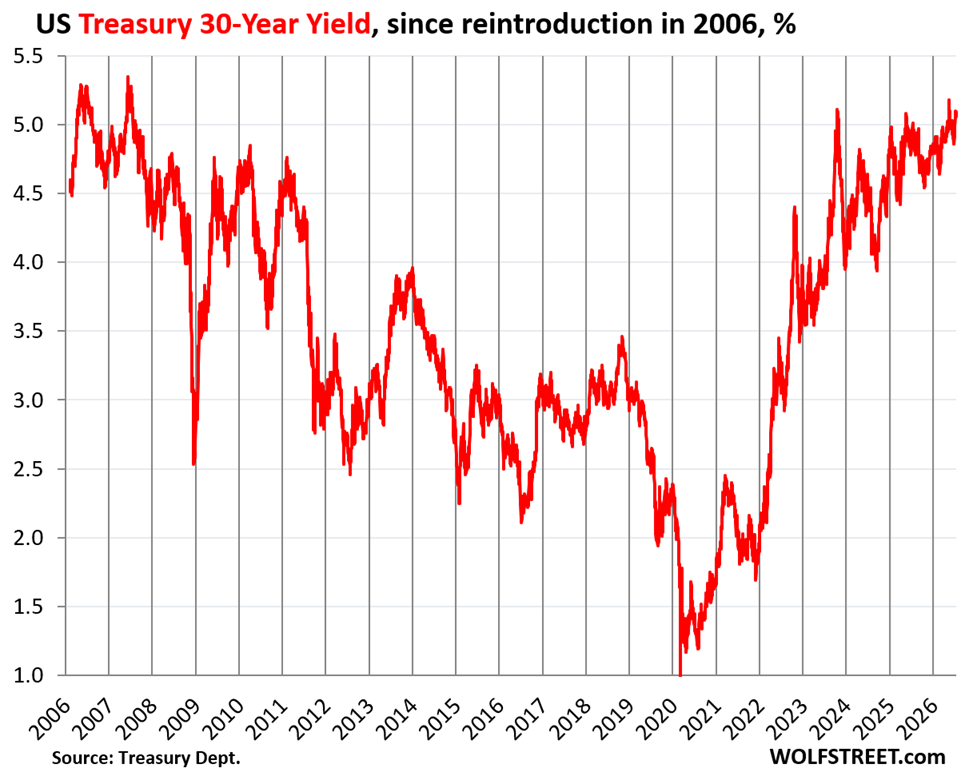
When yields rise, bond prices fall, and for Treasury bond buyers at the time, these years since 2020 have turned into a bloodbath that caused the 2023 collapse of several regional banks that had believed what the Fed had said in 2020 and 2021 in its “forward guidance” that interest rates would remain near zero for a long time, and that QE would continue indefinitely. And these banks, including SVB, loaded up on very long-term Treasury bonds and MBS. And when the Fed changed its mind belatedly as inflation was raging toward 9%, and yields began to soar, the market value of the securities plunged and blew up the banks. And then the Fed and the government stepped in to clean up their own mess to avoid contagion to the rest of the banking system.
For example, the 30-year Treasury bond that sold at the Treasury auction in August 2020 (CUSIP 912810SP4) at a yield of 1.406% today trades at around 48 cents on the dollar. In other words, investors who bought at the auction from the government at the time and sold today would take a capital loss of about 52%.
But for buyers today, it looks different. Buyers in the secondary market today might pay about $480 for $1,000 face value of that bond issued in August 2020. And then every year until August 2050, they receive coupon interest payments of 1.406% of face value ($14.06 per year). And at maturity, they receive face value of $1,000. So in August 2050, they’ll realize a $520 capital gain in addition to the interest they collected over the 24 years ($337.44). This works out to a “yield to maturity” of 5.24%, as per online yield-to-maturity calculator. If a buyer ends up paying $500 for this bond today, the yield to maturity drops to 5.01%. But whoever bought it at auction in August 2020 from the government got hosed.

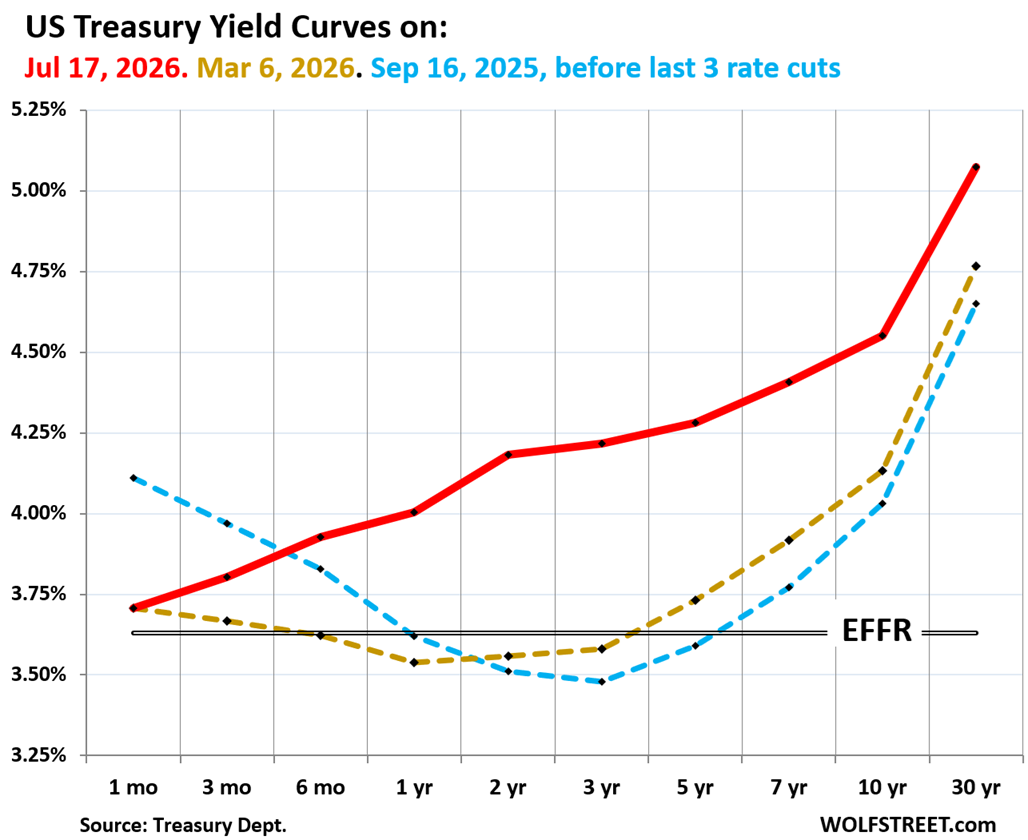
Treasury Yield Curve: bond market prepped for rate hike.
The chart below shows the yield curve of Treasury yields across the maturity spectrum, from 1 month to 30 years, on three key dates in 2025 and 2026:
- Red line: Friday, July 18, 2026.
- Gold dotted line: March 6, 2026.
- Blue dotted line: September 16, 2025, just before the Fed’s first rate cut in 2025.
As the gold line shows, the three rate cuts last fall pushed down the short-end of the yield curve. And on March 6, the market expected no rate hike at all, but a small chance of a rate cut, as the gold line at the 1-year to 3-year yields dipped below the Effective Federal Funds Rate (EFFR), which the Fed targets with its policy rates.
What the red line shows is that on Friday, the 1-month yield was still held down by the Fed’s current policy rates (3.50%-3.75%). But further out, the 6-month yield is now 30 basis points above the EFFR, indicating that the bond market expects a rate hike over the next few months, and then another rate hike next year, indicated by the 2-year yield. At the longer end of the yield curve, increased inflation fears have substantially pushed up yields.
Enjoy reading WOLF STREET and want to support it? You can donate. I appreciate it immensely. Click on the mug to find out how:


Natural Gas prices still negative in the Permian basin due to lack of pipeline and processing capacity. Been about 18 months since Trump took office and allowed the LNg permits and infrastructure projects for NG processing to ramp up.
Demand for NG (power and lng both) is rising steadily.
This increase in energy production and exports should help with the trade deficit and improve economic activity . Inflationary pressure from this as well .
Rates appear to be steady or rising .
Long end of the curve does look interesting at 5 percent plus
Remarkable and curious that we export energy (LNG) when we are attempting to be energy independent , as well as the fact the strategic petroleum reserves are severely depleted.
The releases from the SPR as well as the increased production get exported but mostly after refining. So exports of these value-added products, such as diesel, gasoline, jet fuel, etc. are soaring right now, from already very high levels.
I hope that after Just asking read your response that he/she reflected on the fact that with the energy business and so many others that there is so much to learn before passing judgement.
until prices cause lower consumption
devaluation fiat $dollar(inflation) will continue unabated
throw in uncontrollable grifters in CONSgress spending
and you get trifecta until it isn’t
like idea WARSH is going to RAISE RATES but grifters won’t stop
and heaven forbid dimwits get control
The 30Y graph nowadays is starting to look a lot like Dec 2007. And we all know what happened next. Just the right combination of sparks like a Nov election surprise that creates seismic political turmoil for Trump, private credit finally having its come to Jesus moment & continued backlash against data center that fundamentally calls into question all this capex spending.
China has a very large data center footprint and is expanding faster than any other country.
The Chinese planned scaling is staggering—roughly doubling capacity in 5 years.
Data centers could become very strategic.
I read about six months ago that the US has over 4K data centers, while China is 400+. Be that as it may, I agree that they are expanding very fast. But they do have that huge DC power transmission line running from the Gobi Desert east to the population centers. And they are working on the only Thorium-based SMR.
What exactly are these center producing of real value? They are consuming tremendous amounts of energy and resources. Shouldn’t we care about the return on that investment? In a truly free market I think all those resources/raw materials and energy would find much more productive applications.
Seems to me that humanity is eating it’s seed corn. Moreover, what’s the useful lifetime of the average processor? Aren’t all these things obsolete after six months? Humanity cannot escape the laws of thermodynamics and it takes a substantial amount of energy to maintain a decent standard of living…
Hedge accordingly.
So, with house prices in the US decreasing or staying the same, saving (risk free) in short term treasuries for a down payment is a good idea for the younger generation living rent free with their parents or lower rent with their friends.
Oh, and let’s not forget that when the next real tightening in credit happens, that might be just enough to tip CRE into panic mode by shutting down a lot of extend & pretend loans.
The financial system is pretty much the apex of the pyramid structure of power. It wields more power and has more influence domestically and internationally than the military (not to downplay the power of the military, but to draw attention that it is exceeded by the financial system). After all these years of being so blatant as to clearly demonstrate to the public (at least whatever part of the public that has the attention span greater than a gnat) that the rules of the game can be and will be modified when necessary to preserve the current system and the power that it wields, why would it suddenly allow the market to dictate the terms to it instead of continue to dictate the terms to the market?
If a builder of a house of cards has no technical limitation on available cards with which to build and is completely satisfied to engage in building with cards in the first place, what would realistically be the scenario where the builder sits back and watches it collapse instead of just buttressing the edifice with more cards pulled from an endless supply even if it eventually requires absurd techniques such as using brick-like stacks of cards being deposited anywhere there may be a slight benefit and delay a collapse? Would a commercial real estate collapse ever happen unless the system itself has some great benefit to gain from it collapsing? I don’t believe it will or it would have already. It will be papered over, even if it means erosion of wealth of the plebeians, because by their very grouping and position, they don’t have significant power and are not important enough to cause the course of action to deviate.
Inflation.
Bull-situation. Bull market your way into obfuscation. Until the bull is juiced up to be so wild that it rams it’s head into the very wall (-street) of the building itself and even the military can’t save’em.
At that point, the chessboard has been flipped but the mid-level suckers who thought they were making smart moves are still so caught up in the game and still focusing on their next genius financial move that they can’t fathom that it was all a temporary illusion that gave them a false sense of self worth. They will already be inducted into the new game before they have come to terms and comprehended that the last one is over.
At that point, the new game is Russian Roulette but the first couple of rounds are likely to be played simply out of a need for the familiarity of constantly engaging in a game and getting played. BOOM! Look at that genius over there, he clearly showed us what he’s made of. The writing is on the wall. Next player, you’re up! Show us how smart you are. Put your genius on display!
Looking at a one year chart of the US dollar against the ten year bond it appears there is correlation. Perhaps the recent strong offshore purchases in bonds is simply a way to hedge offshore profits value?
nobody should even bring up the idea, but is it an indicator of the end if the gov. start issuing callable treasury bonds due to high interest rate environment? (naturally buyer would then demand even higher yields)
The government used to issue callable Treasury bonds, including during the 1970s and early 1980s, when the 30-year yield soared to over 14% amid huge inflation. When interest rates fell later in the 1980s and 1990s, these bonds turned into a goldmine for the original buyers with the guts to buy them at the time. But the government called these bonds, depriving these investors of their earnings. This created a huge stink, upon which the Treasury Department stopped issuing callable bonds.
But government agencies issue callable bonds all the time, such as the GSE’s MBS or the FHLB’s securities. And they get called routinely.
Many years ago at work someone told me that at one time our pension fund had all the money in those bonds but the government made them divest and diversify. Now I figure they were called.
30Y guaranteed real yield of 2.9% is pretty good! I’d consider it if I was close to retirement
entering retirement in TN…2.9 YTM. I have 50k of this bond and get about $100 / mo (inflation protected) to supplement my SS for decades to come,
07/14/2026
Buy
912810UH9 UST INFL IDX 2.375%02/55INFL INDEX DUE 02/15/55 10,000 $89.8398 -$9,612.63
My I bond in 18 years has gone from $5000 to $10000. According to AI :
Measure
Approximate Annual Rate
18-Year Effect
Savings return
3.93%
Money doubled (100% gain)
U.S. inflation (CPI)
2.5%
Prices rose about 55–56%
So Wolf, do you reject some of the narrative out there that the most recent CPI report was “good news” and means rate hikes are off the table ?
If the war in Iran continues and even expands to a limited ground operation (reports that current bombing is focused on isolating costal regions in Iran in preparation for some sort of limited lodgement on the ground). Costs will escalate rapidly and maybe that fabled oil crisis will actually materialize.
Do you see this as enough to let Warsh off the hook for rate increases.
None of the talking heads at the Fed that have spoken since the CPI report consider it trend-changing. They all said kind of: thank you, nice break, but inflation is too high, and this one report doesn’t change the trend. And I agree with that, as do lots of people.
And the US is awash in oil, the largest producer in the world, and a huge exporter of value-added products, primarily diesel, gasoline, pet coke, jet fuel, propane, ethane, butane, and natural gasoline (used for blending with gasoline for octane ratings, etc.). This is a massive export business, and those exports have spiked since the beginning of the war. We’re getting the initial numbers on that – it’s remarkable how the US oil & gas business profits from the war. Obviously, with crazed speculation and profiteering (look at the crack spread!) driving up prices at the pump in the US, the US consumer also pays for the oil company profits.
When the oligarchs can no longer hide their criminality, they take the people to war. That’s where we are. Wars are very destructive. Sure, building weapons generates lots of CPI for the arms dealers, their corporate owners and their political puppets. For the average Joe and Jane, not so much. They will be squeezed on all fronts until they are homeless. People really need to pick up a history book. None of what is happening is a real surprise.
Hedge accordingly.
Nothing on the outside to make tips seem awesome except perhaps when the fed won’t tame inflation.
Then tips look nice.
Dear Wolf, can you please expand a little on “Long-term bonds are not for the faint of heart” — the section only talks about nominal UST Bonds, but what about TIPS, are 30-year TIPS also “not for the faint of heart”?
All long-term bonds lose market value when rates rise. The loss on the principal of the TIPS is the same as with nominal bonds. But TIPS get inflation protection added to the principal, and when there is a lot of inflation, holders get a lot of inflation protection added to the principal. So if you have one of those TIPS in your brokerage account, it may show that it’s at 52%, but that’s very confusing due to the added principal, and the amount you’d get by selling it would be quite a bit higher. In that respect, TIPS are somewhat less risky than equivalent nominal bonds. But with my limited brain, I’m not able to nail down this calculation per individual bond, as I did with the 30-year nominal 2050 bond.
Thanks for the reply. One followup: “The loss on the principal of the TIPS is the same as with nominal bonds” — such loss is clearly understood for nominal bonds (inflation devalues the nominal coupon income), but why is it the same for TIPS? What is the rationale?
Stan, you are asking the right question. However, Wolf’s first line is both your question : “All long-term bonds lose market value when rates rise.” and “MARKET VALUE” is your answer.
You got too hung up on the effect that TIPS will protect you against inflation and BONDs won’t just by the name. The real mechanism of losing money is the “Interest Rate/Duration Risk”
The 5%, 30-Year long bond you buy today will give you back the principle + expected interest at 30 years. But any time before that, its value fluctuate with today’s interest rate. For example suppose there’s some calamity at year 29 where the 1-year interest rate is 17%, and you try to unload your bond that year, you’ll be surprised you are not just losing the final years interest. Any buyer of your 1-year duration left bond would bid for a 17% yield to maturity and not 5%. If you really need the cash, you’ll have give them 12% of your principle, plus the expected 5% interest the new owner will still receive, or the buyer can buy any new 1 year bond or CD at 17%, it’s no difference to them.
This is how SVB collapsed.
Bond yields are sending a new signal about Fed rate hikes
SCBD
I note those calling for the FED to cut rates have temporarily refrained from posting here of late….
I understand the conventional wisdom that low interest rates create a business friendly climate for Job Creators. However, they also appears to create a business friendly climate for Job Destroyers (private equity, mergers and acquisitions, etc).
And of course, they cause asset price runups around the world (the common factor around the world in home price runups has been low interest rates – if you can afford 3K a month, a 3 percent mortgage allows for a bigger purchase price than a 6 percent mortgage).
So low interest rates are not an unalloyed good.
What do we think the odds actually are of a rate hike at the July meeting? Then tend to pre-warn the markets so are they talking about this all for July or September?
Looking at the bond market, I’d say the odds are small for a hike at the July meeting.
I’d say the Fed is just fine with CPI at 4.2%
I think they also fine with it at 8%.
They just don’t know how to say that to the world.
End the Fed.
One of the least important things the Federal Reserve does is to set overnight interest rates on any of the 5 rates it controls.
Also they are going to be ok with interest rates at 0-1% because that’s what big business wants.
They want to jet engine the economy and deal with consequences later. Those who fall by the wayside in the process, it’s good riddance. To them.
Very strange strategies flying around. They are not based in any historical precedent or agreed upon sound fundamentals. It’s like high schoolers running the economy.
Nevermind people have 30 more years experience, doctorates, Nobel prizes, makes no matter.
Strap on baby 🚀
1. It’s a mild injustice that TIPS pay better than “I” bonds & the 10 yr pays better than the “EE” Bond.
2. TIPS, (which I own only out of curiosity) has this weird tax classification that my other bonds don’t have. I think its called “OID” or something like that. At tax time it frustrates me every year. For that reason, I don’t buy more.
For the record, I’m poor, dumb & no one important.
But Economics is my hobby. So I do enjoy this web site.
The taxes on tips has to be minute.
It’s the safety that are their most attractive quality.
Musk’s SpaceX has lost $1 trillion in market value since its post-IPO peak
U.S.’s average gasoline price is back above $4 a gallon
Inflation is broadening out, says Goldman Sachs economist
Maybe he’ll wait for Sept or Oct so he can freak out the stock market right before midterms? Or let it keep escalating so that people go into midterms angry about inflation? There’s nothing voters hate more than inflation.
Trump was supposed to fix that right? Make America great and affordable again for the lower and middle class?
Glad someone is getting prepped for rate hikes. Just not sure how the buyers of those 5.16% 20yr bonds will feel about being underwater almost instantly. But the “prices will be better next month if I wait” mentality can get dangerous once it spreads. Guess that’s why the controllers of economic conditions love a little inflation.
Those are issues if you’re a leveraged bond trader, trying to profit from short-term moves.
But if you bought the bonds to hold them to maturity (hoping you will live another 20 years) and collect the 5.16% interest along the way, then market value is irrelevant to you. What you worry about is if 5.16% is enough to compensate you for the average inflation over the next 20 years PLUS compensate you for locking up your money for 20 years. So if average inflation over the next 20 years is 2%, then that’s a good deal, no matter what market value fluctuations you might encounter. If average inflation is 5%, then that’s a terrible deal, and you got hosed.