
And 28 were down from their peaks in prior years, led by Austin -27% and Oakland -25%.
By Wolf Richter for WOLF STREET.
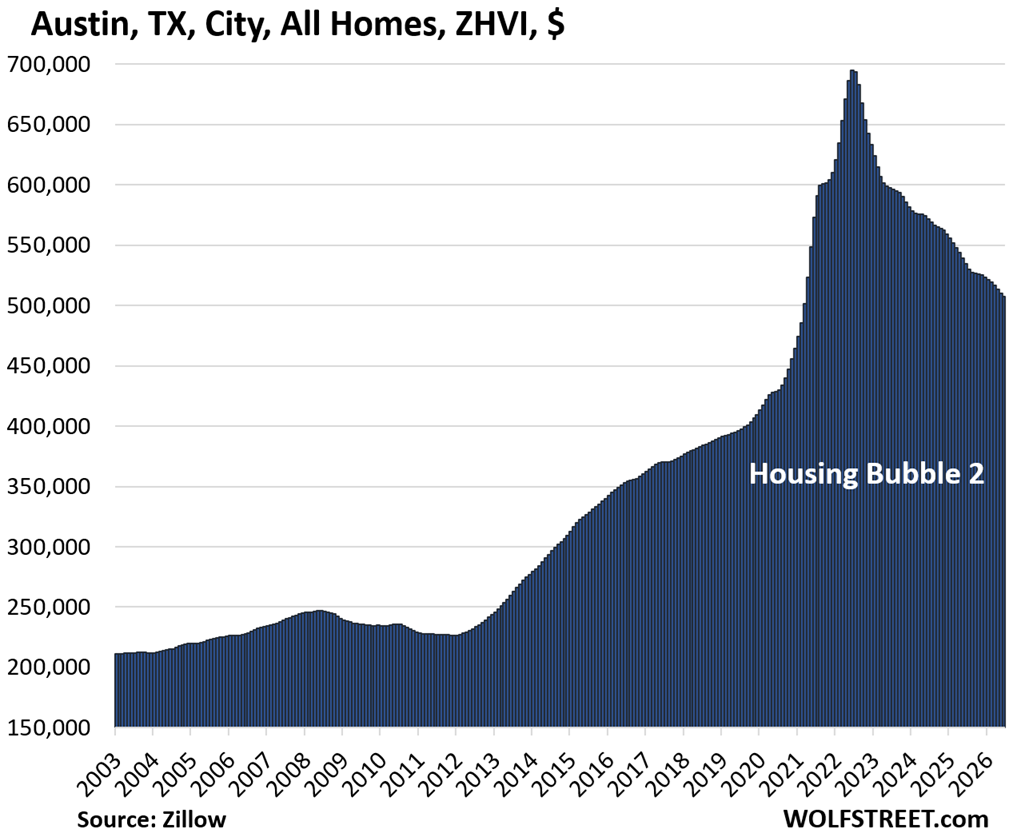
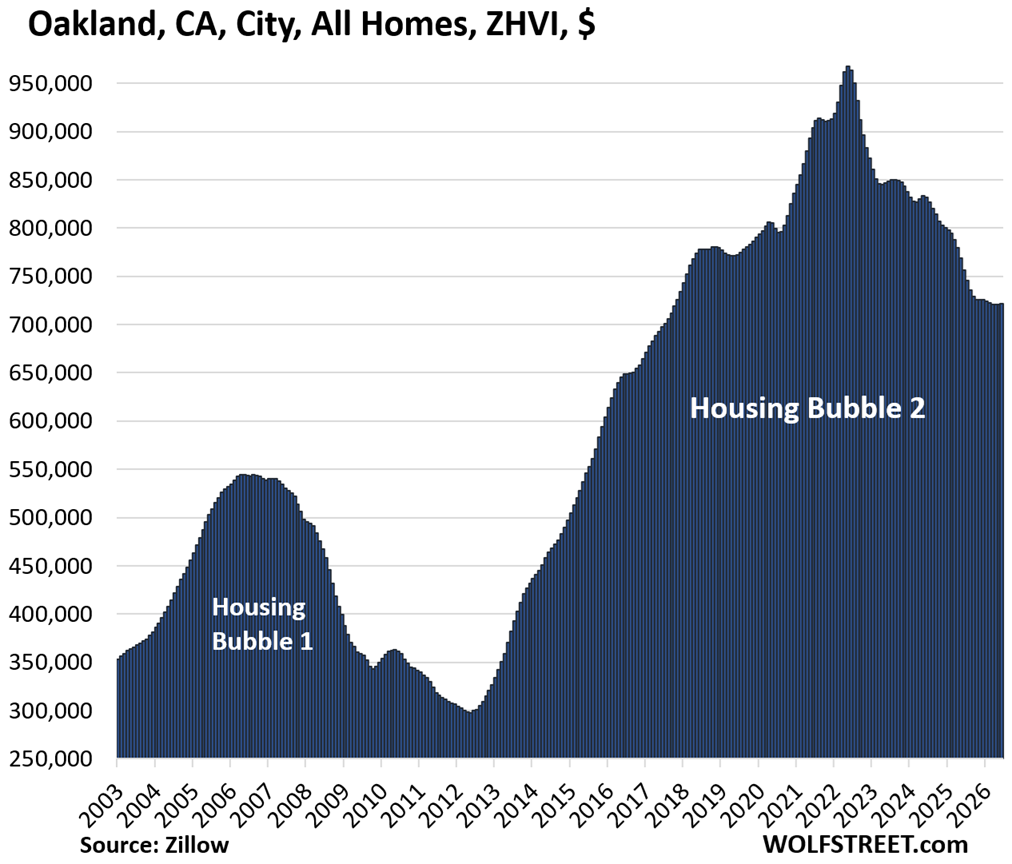
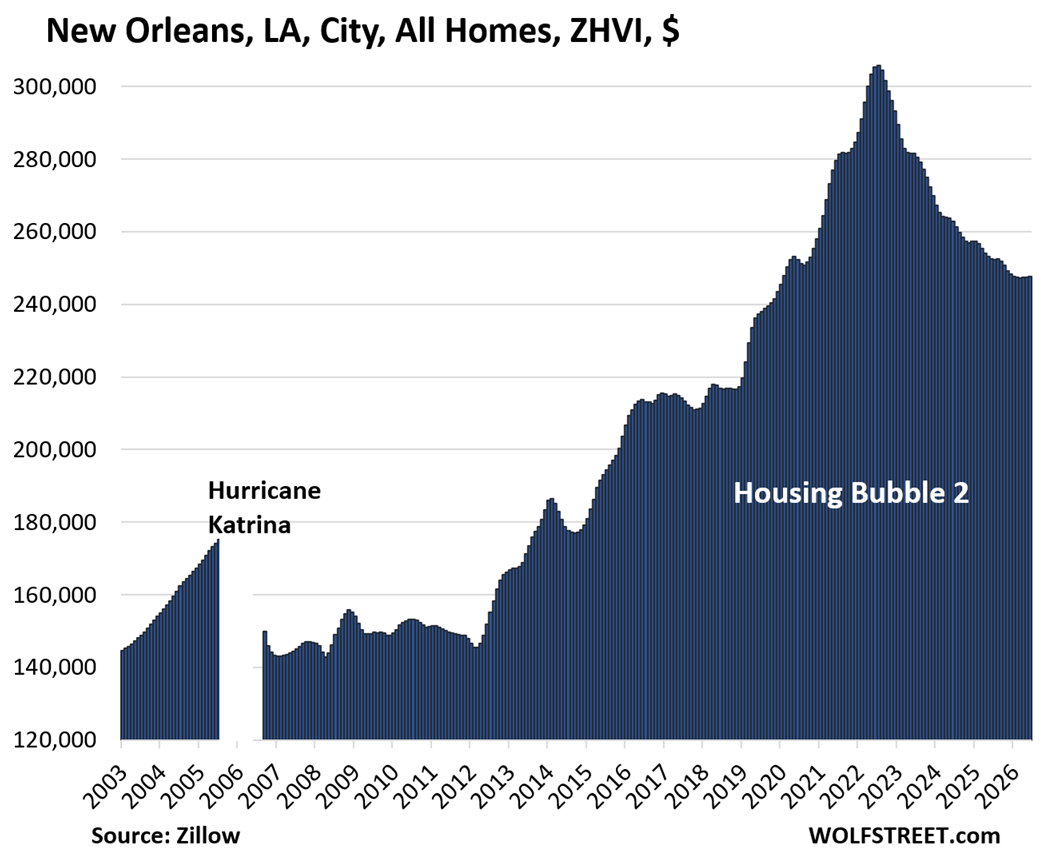
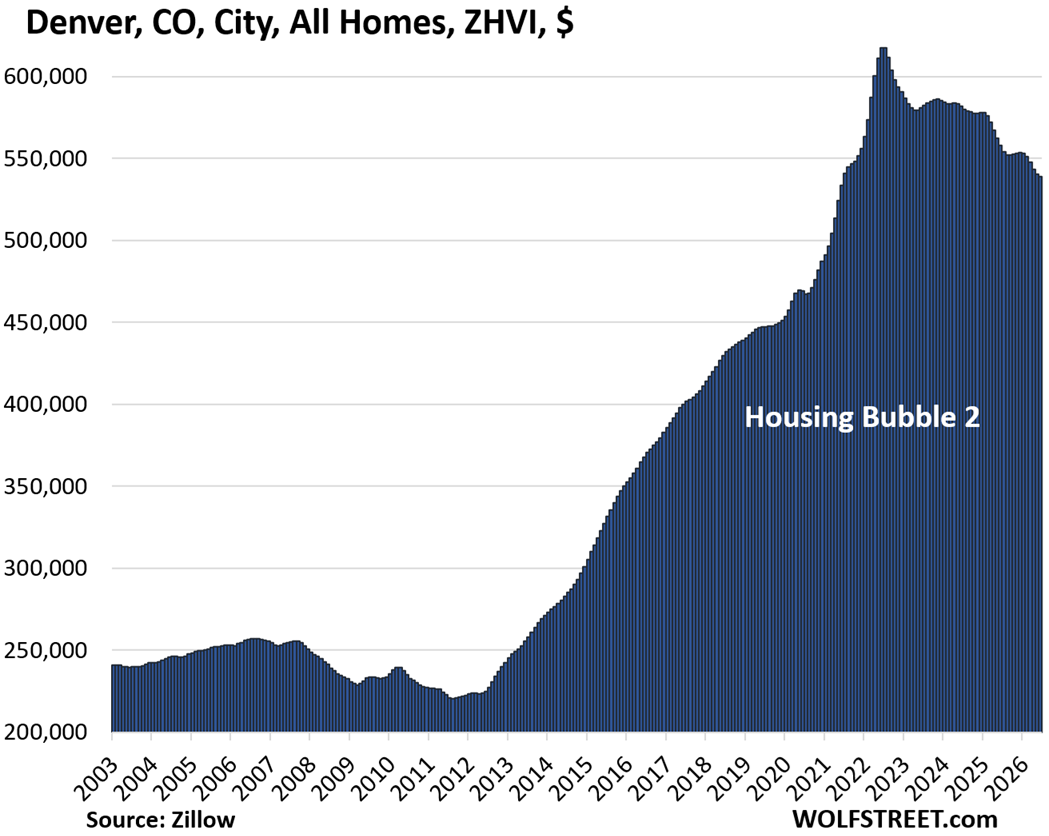
Prices of mid-tier homes in June were down from their respective peaks in prior years in 28 of the 33 big and expensive cities we follow here, led by Austin (-27%), Oakland (-25%), New Orleans (-19%), Washington D.C. (-13%), Denver (-13%), Phoenix (-11%), Fort Worth (-10%), and Portland (-10%). All of the prices are seasonally adjusted.
Here’s is Austin. The charts and data for each of the 33 cities are further down.
In 17 of those 33 cities, the peaks were in 2022; in 9, the peaks were in 2024; and in 2 cities, the peaks were in early 2025 (Boston in April 2025 and San Jose in January 2025).
Year-over-year price declines occurred in 25 of the 33 cities, topped off by Austin (-5.0%), Oakland (-4.6%), Denver (-3.4%), Nashville (-3,3%), and Las Vegas (-3.1%).
Year-over-year price gains occurred in the remaining 8 cities, topped off by New York City (+3.8%), Chicago (+3.9%), and San Francisco (+9.5%).
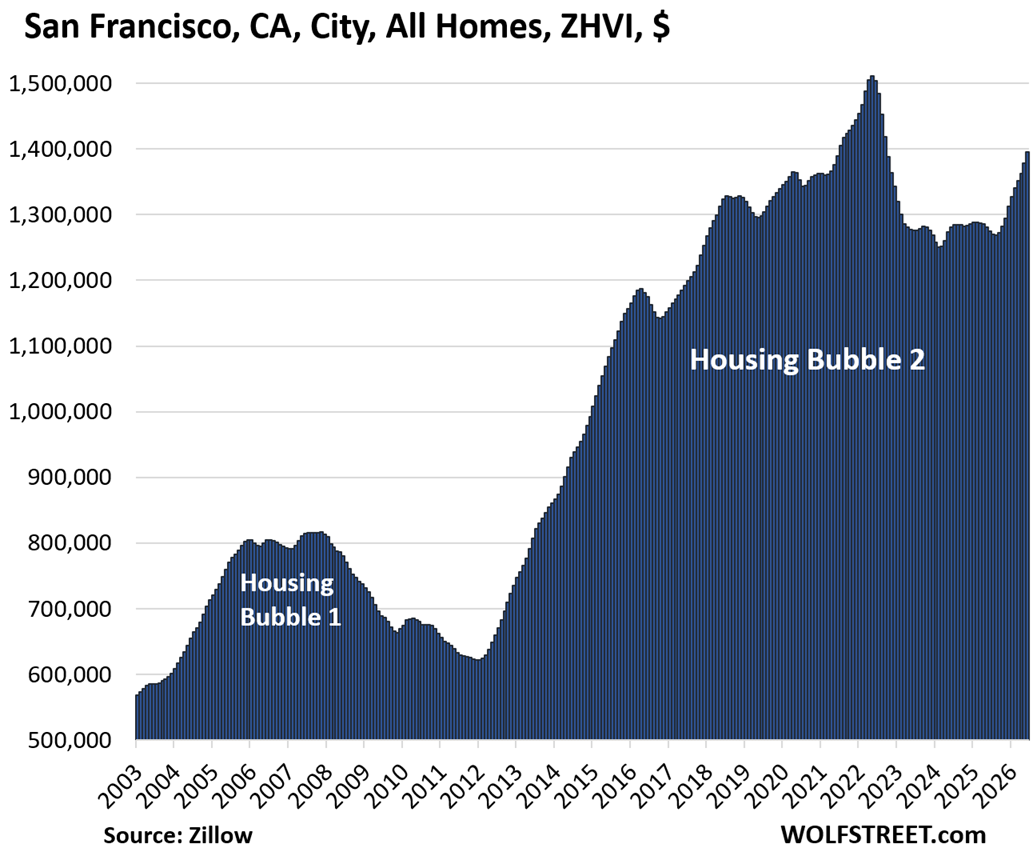
San Francisco used to be near the top of the price decliners. But AI mania got a hold of the luxury housing market as super-highly paid people started chasing down expensive homes, triggering a “mansion shortage,” as it has been called locally, that last fall began trickling down into mid-tier home prices, and those mid-tier prices began to spike. Despite the spike, mid-tier home prices in June were still 8% below the all-time high of 2022. If AI mania lasts long enough, mid-tier prices could set a new high in the not-too-distant future for the first time since 2022.
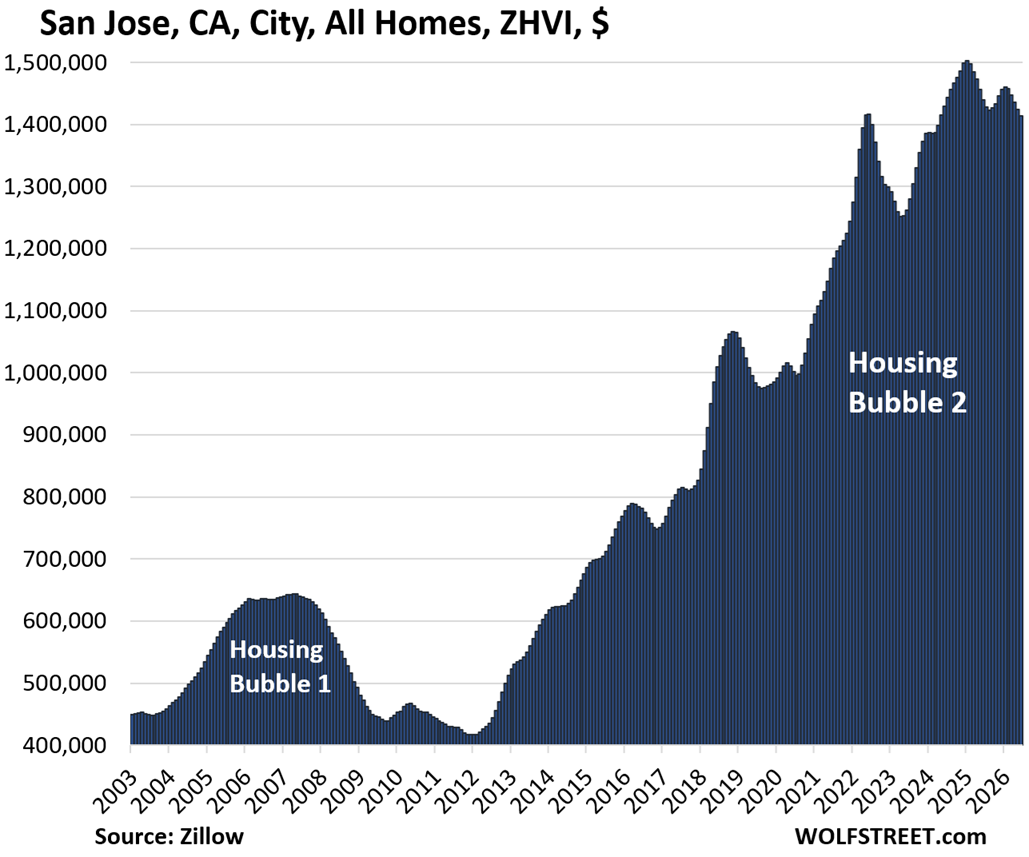
By contrast, in San Jose, where mid-tier homes were even more expensive ($1.41 million) than in San Francisco ($1.39 million), prices continued to drop: -0.7% in June from May, -1.8% year-over-year, and -6% from the peak in January 2025.
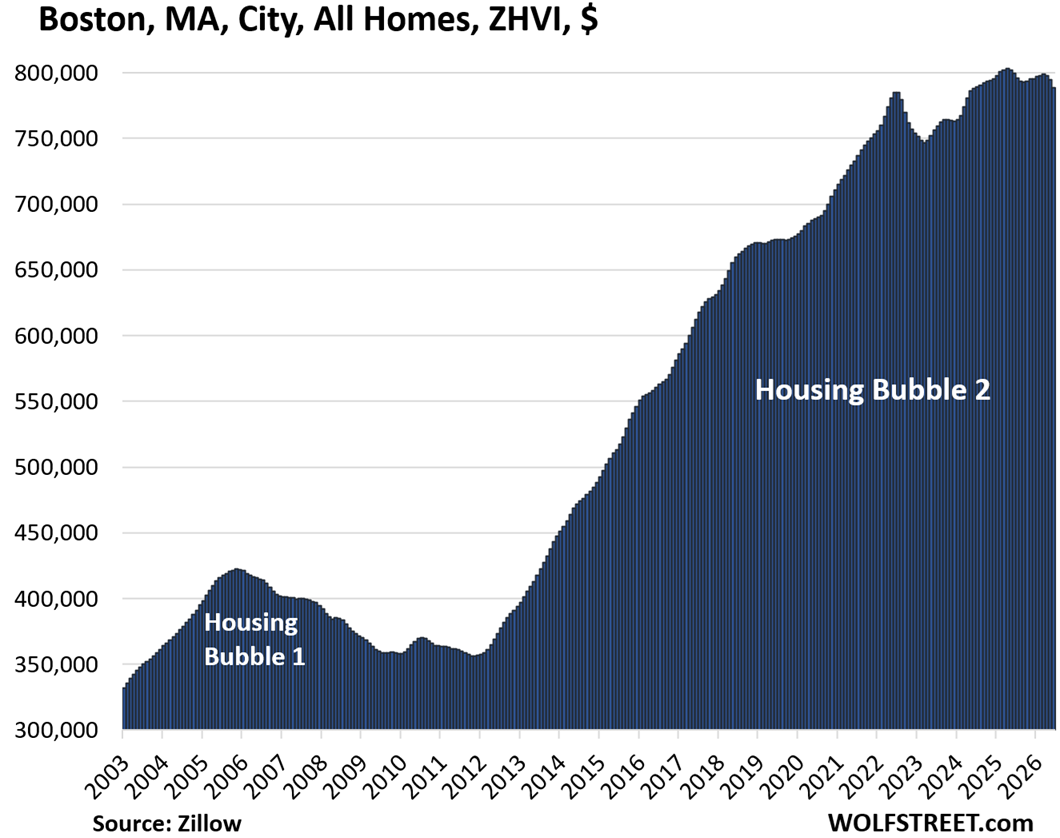
Boston recently joined the list of cities with price drops from highs in prior years. Mid-tier home prices fell by 0.7% in June from May, by 1.3% year-over-year, and by 1.8% from the high in April 2025.
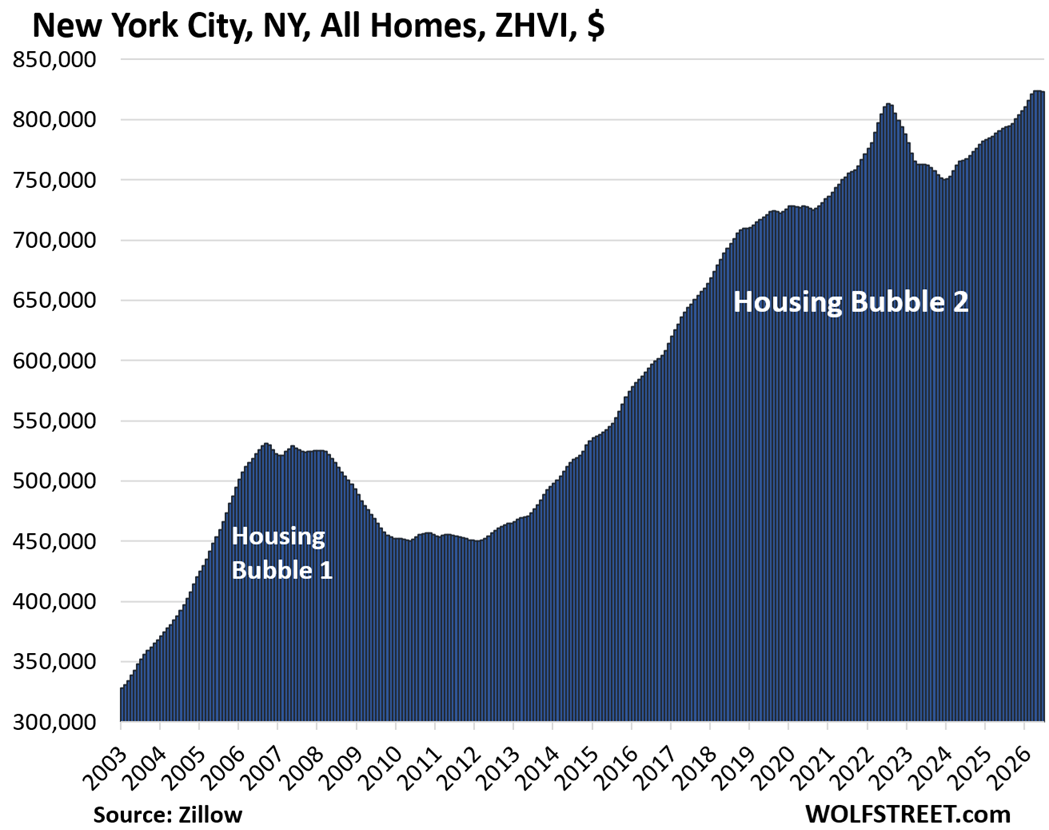
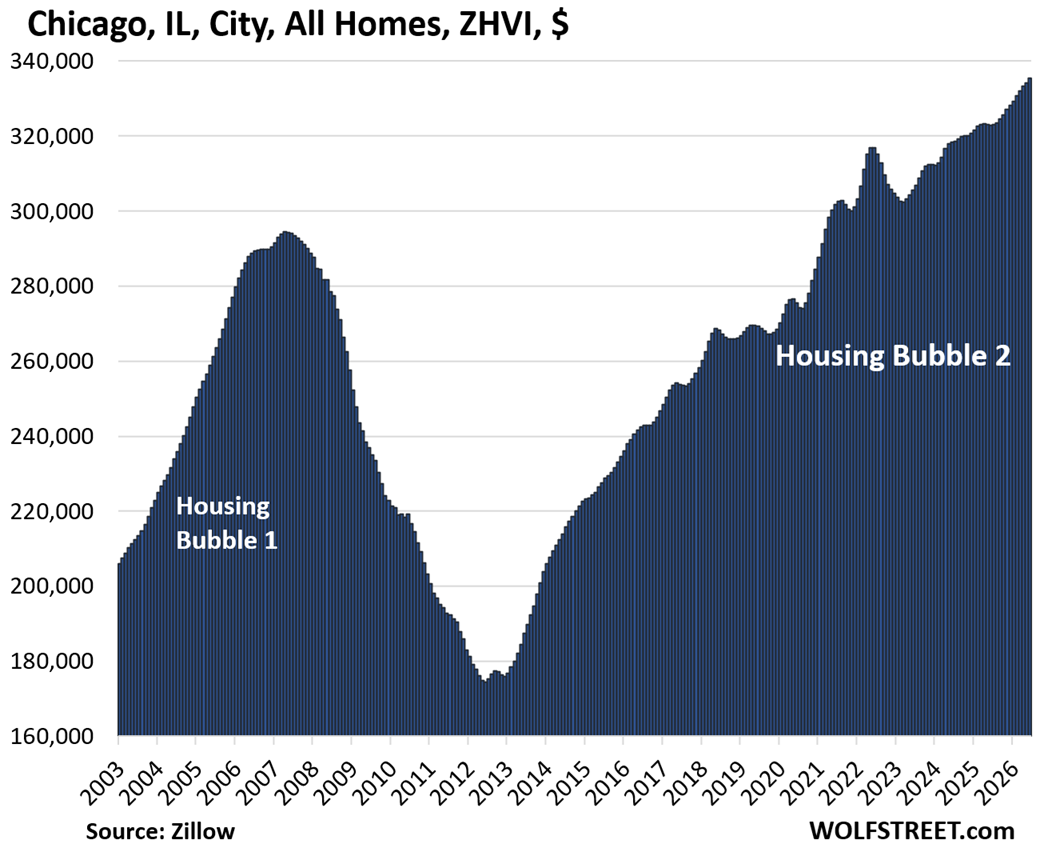
Only two of our 33 big and expensive cities set a new high in June: Chicago (+0.4% in June, +3.9% year-over-year); and New York City, which had been carving out new highs month after month… well, it didn’t actually set a new high in June, prices dipped for the first time, but close enough (-0.1% in June, +3.8% year-over-year).
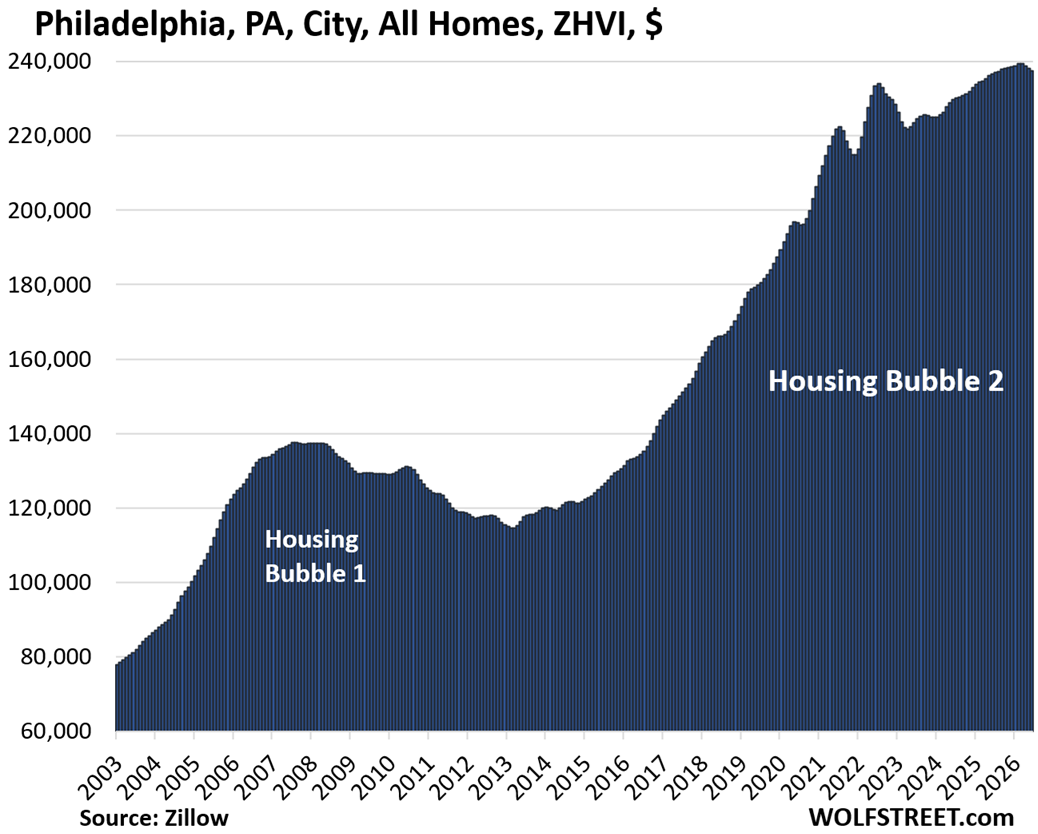
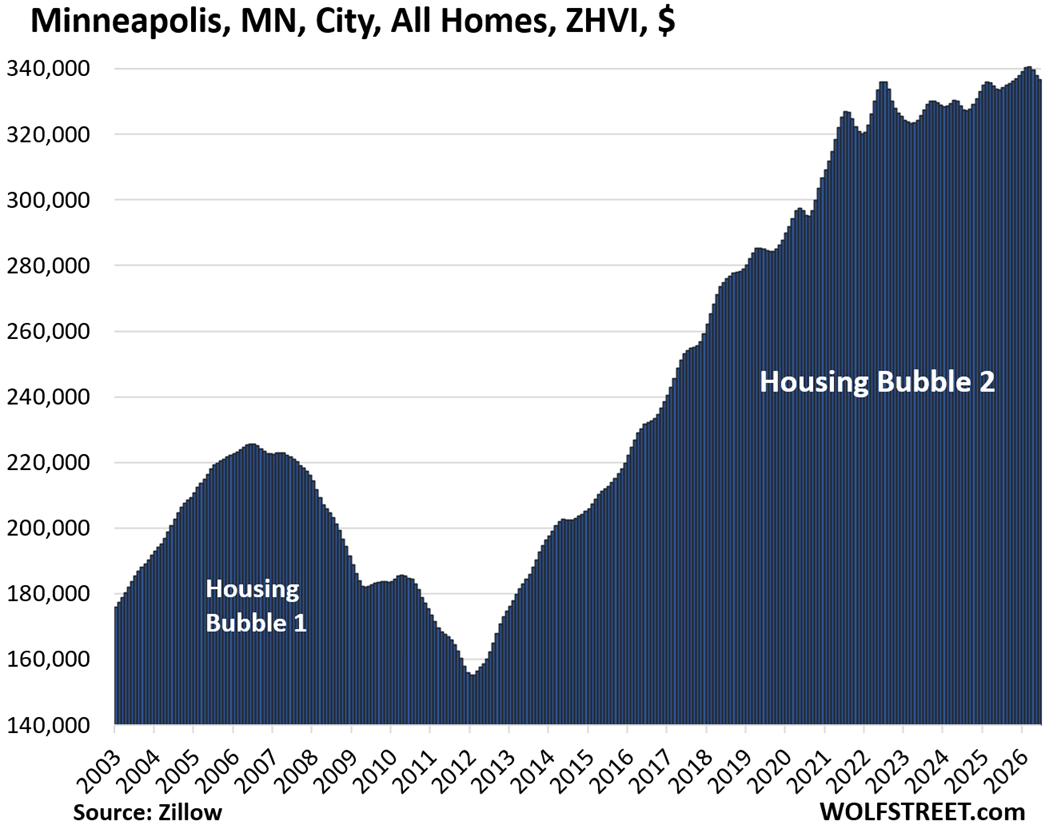
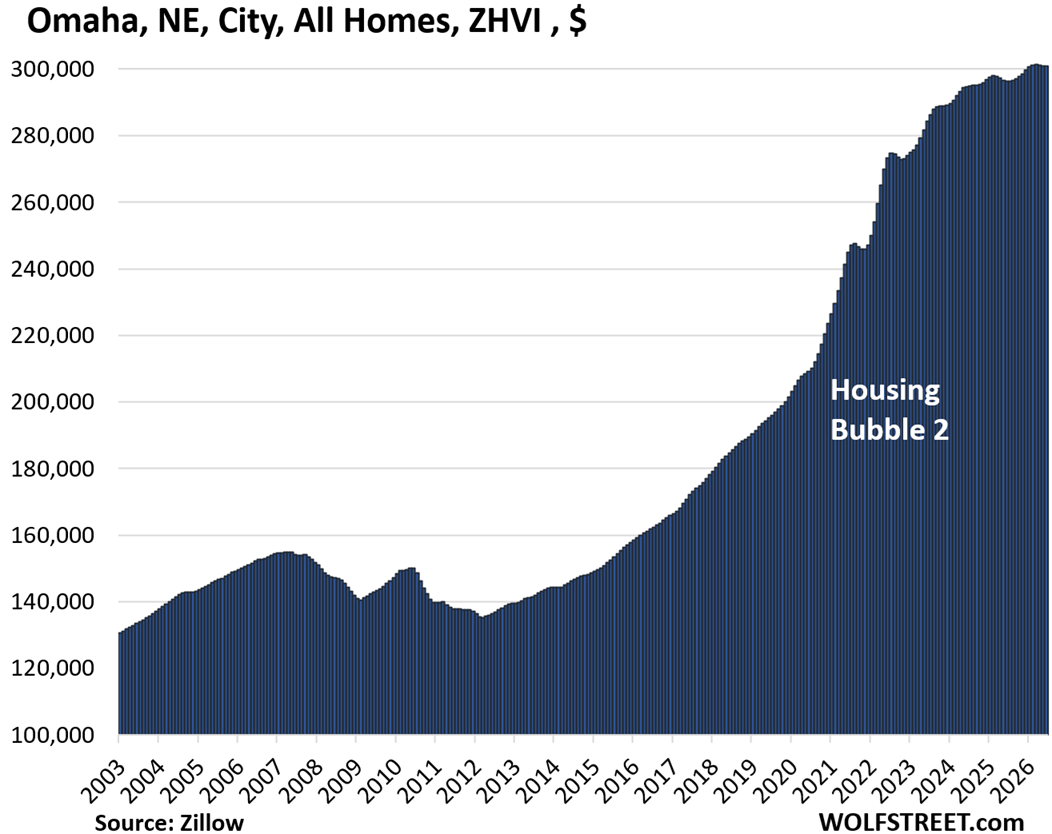
Another 3 of the 33 cities had also been carving out new highs month after month, but stopped in March and then backed down over the past three months with the first month-to-month price declines in a while: Philadelphia (-0.2% in June, +0.4% year-over-year); Omaha (-0.02% in June, +1.5% year-over-year); and Minneapolis (-0.4% in June, +0.9% year-over-year).
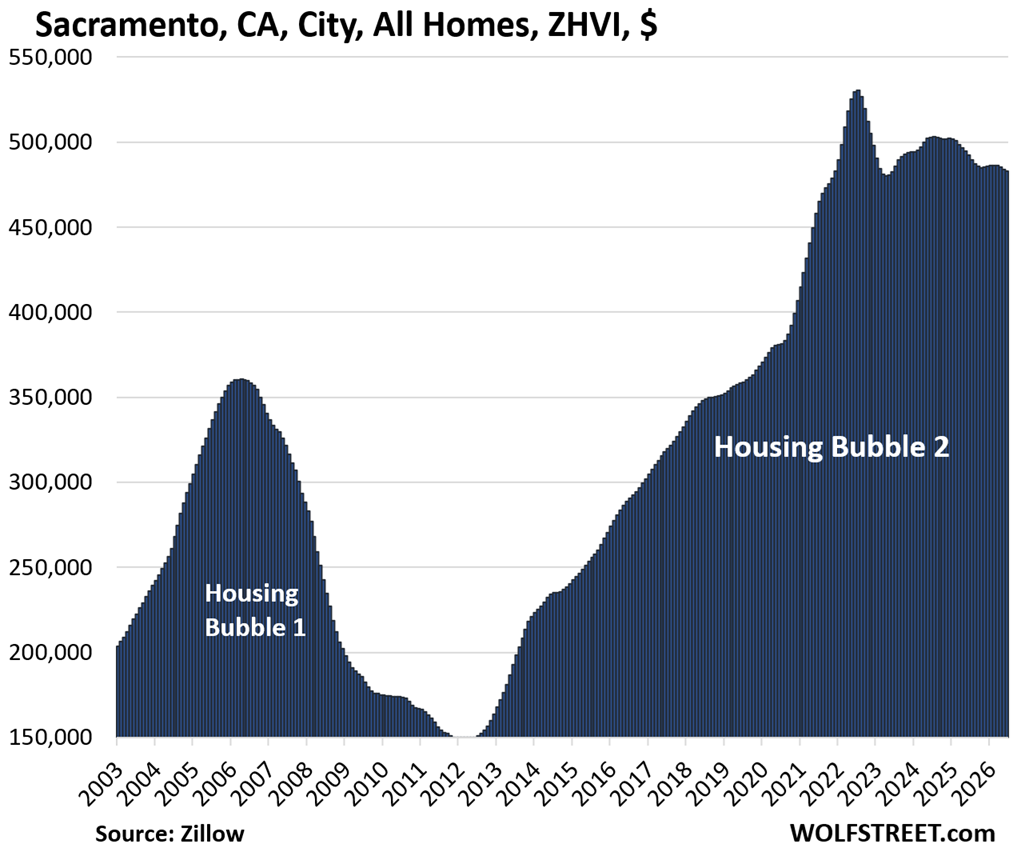
In the two years between mid-2020 and mid-2022, all of these 33 cities had seen enormous price spikes, including Austin +62%, Phoenix +60%, Fort Worth +50%, Raleigh +49%, and Sacramento +39%.
This massive home-price inflation over those two years, which came on top of the already outsized price increases in the prior years, was caused by the Fed’s reckless free-money policies, which included trillions of dollars of purchases of Treasury securities and mortgage-backed securities (MBS), which produced the below-3% mortgage rates, even as inflation was raging at the time toward 9%, which led to off-the-chart FOMO buying behavior at the time.
The price index here is the seasonally adjusted three-month-average mid-tier Zillow Home Value Index (ZHVI) for single-family homes, condos, and co-ops. Mid-tier means the middle-third by price in each market. The ZHVI is a backward-looking measure based on millions of data points in Zillow’s “Database of All Homes,” including transaction data from public records (tax data), MLS, brokerages, local Realtor Associations, real-estate agents, and households across the US. It includes pricing data for off-market deals and for-sale-by-owner deals.
To qualify for the list, the city must be one of the largest by population and be among the expensive cities where the ZHVI for all mid-tier homes must have been at least $300,000 at some point.
Some large cities don’t qualify for this list because the ZHVI for mid-tier homes never reached $300,000, despite the surge in recent years, such as the cities of Houston, Philadelphia, Memphis, Oklahoma City, Tulsa, Kansas City, Cincinnati, Pittsburgh, and many others. In those cities, you can buy at least five homes for the price of one in San Jose. Not every city in America is an expensive housing market!
But Houston and Philadelphia are included anyway because they’re the fourth-largest and sixth-largest cities in the US.
Home prices in 33 big and expensive cities in America.
In the little tables, MoM = month over month; YoY = year-over-year. The column furthest to the right shows the percentage increase “since 2000.” All seasonally adjusted.
| Austin, TX, City, All Homes, Prices | |||
| From Jun 2022 peak | MoM | YoY | Since 2000 |
| -27% | -0.5% | -5.0% | 151% |
Lowest since March 2021.
| Oakland, City, CA, All Homes, Prices | |||
| From May 2022 peak | MoM | YoY | Since 2000 |
| -25% | 0.2% | -4.6% | 247% |
Back to October 2017.
| New Orleans, LA, City, All Homes, Prices | |||
| From Jun 2022 peak | MoM | YoY | Since 2007 |
| -19% | 0.1% | -2.0% | 106% |
Back to February 2020.
| Denver, CO, City, All Homes, Prices | |||
| From Jun 2022 peak | MoM | YoY | Since 2000 |
| -13% | -0.3% | -3.4% | 195% |
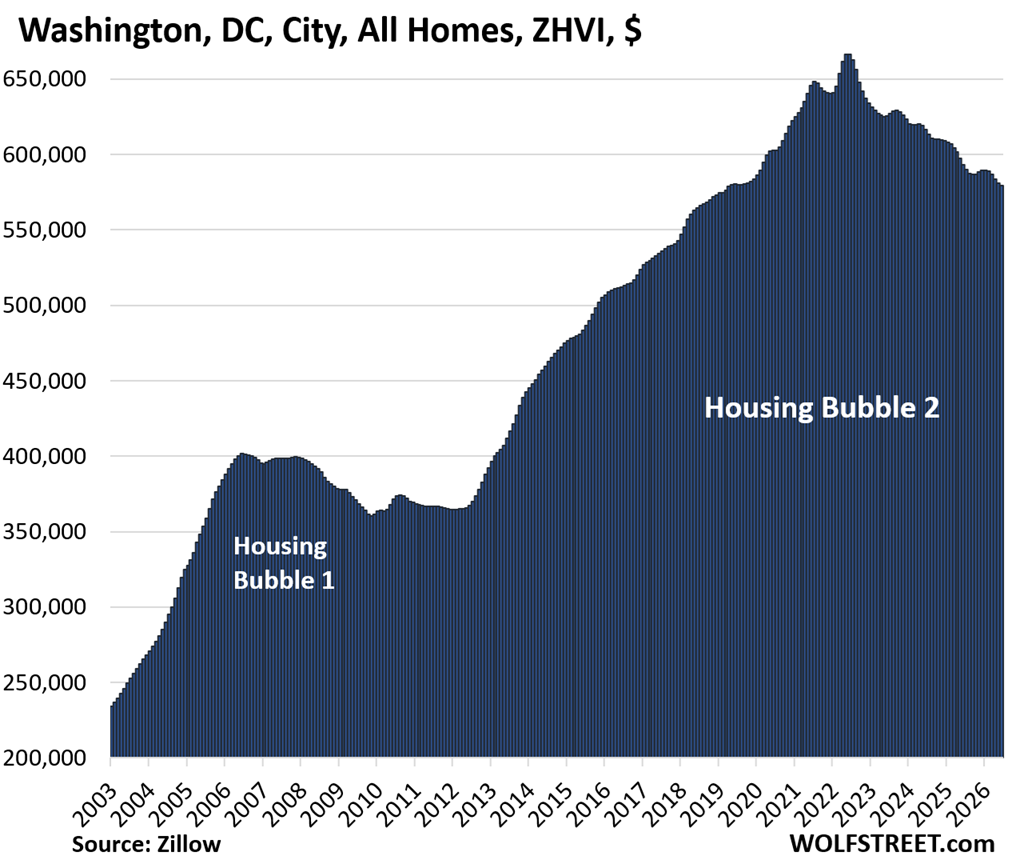
| Washington D.C., All Homes, Prices | |||
| From Jun 2022 peak | MoM | YoY | Since 2000 |
| -13% | -0.3% | -2.3% | 253% |
Lowest since October 2019.
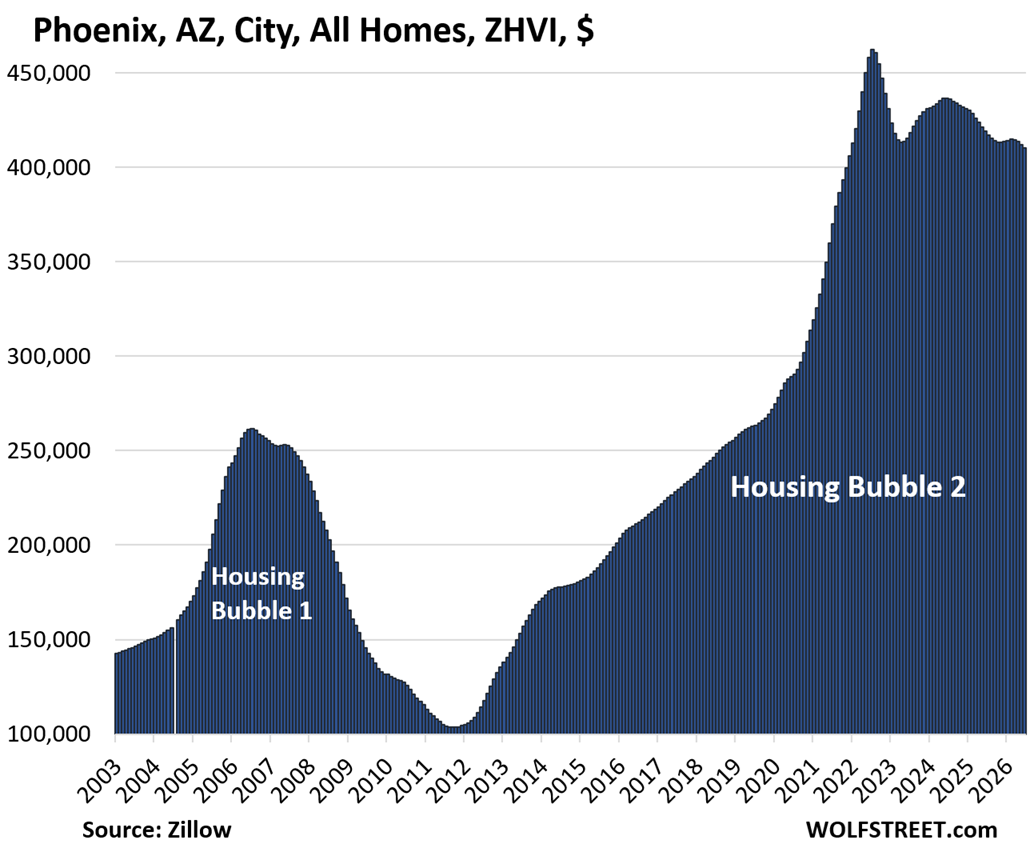
| Phoenix, AZ, City, All Homes, Prices | |||
| From Jul 2022 peak | MoM | YoY | Since 2000 |
| -11% | -0.4% | -2.1% | 246% |
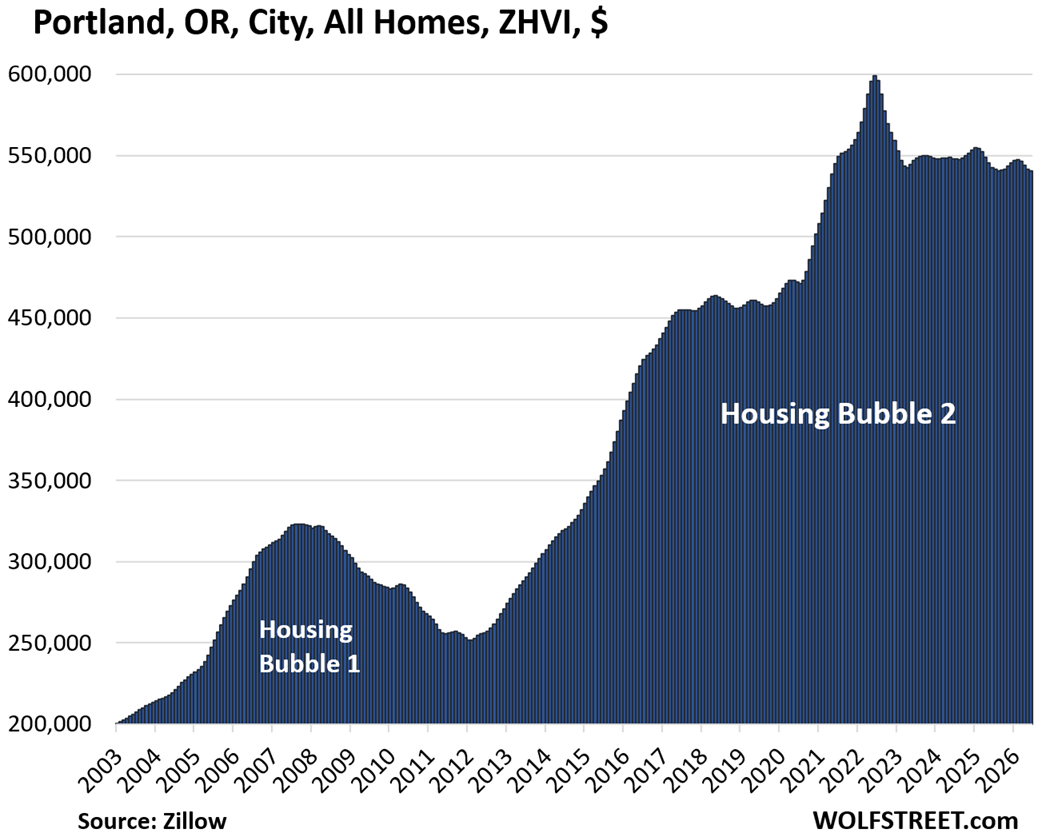
| Portland, OR, City, All Homes, Prices | |||
| From May 2022 peak | MoM | YoY | Since 2000 |
| -10% | -0.2% | -0.4% | 214% |
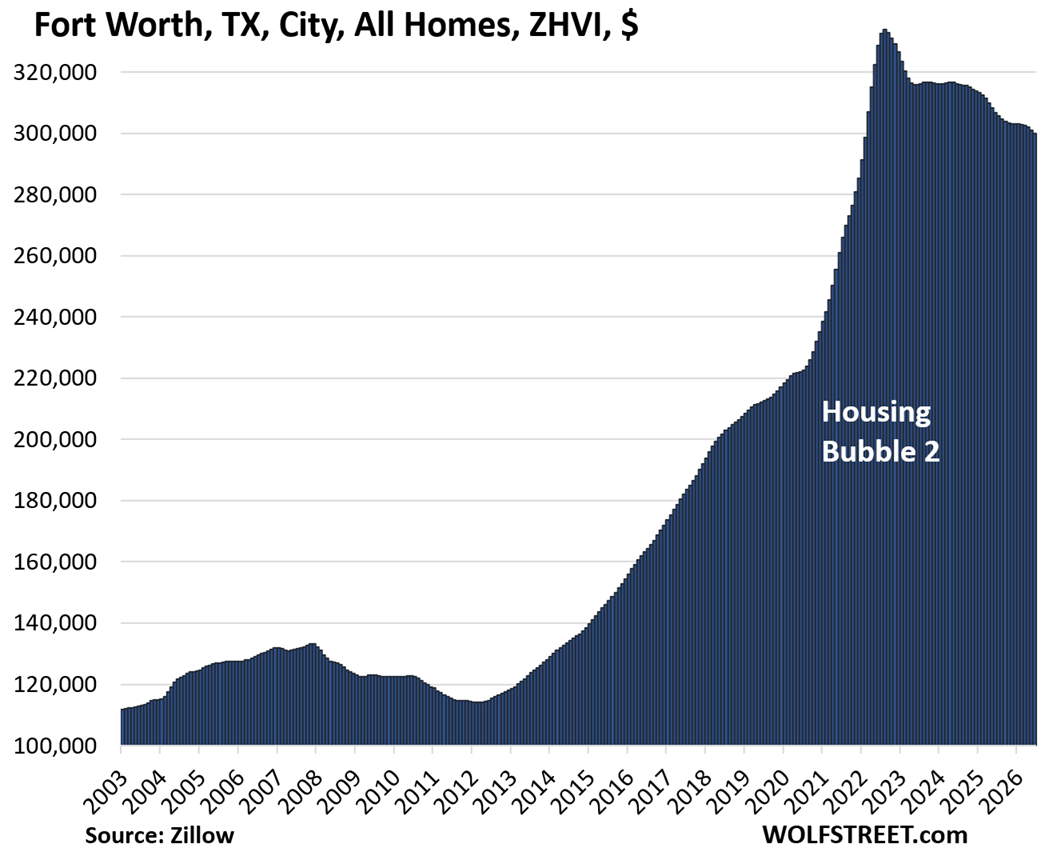
| Fort Worth, TX, City, All Homes, Prices | |||
| From Aug 2022 peak | MoM | YoY | Since 2000 |
| -10% | -0.3% | -2.2% | 186% |
| Sacramento, CA, City, All Homes, Prices | |||
| From July 2022 peak | MoM | YoY | Since 2000 |
| -9% | -0.2% | -1.9% | 283% |
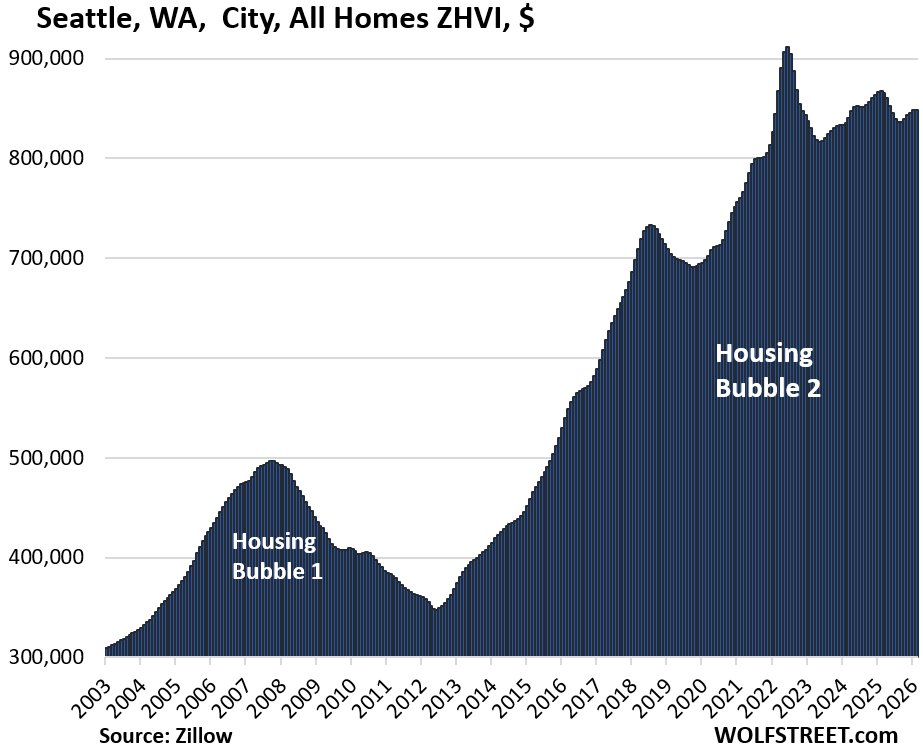
| Seattle, WA, City, All Homes, Prices | |||
| From May 2022 peak | MoM | YoY | Since 2000 |
| -9% | -0.6% | -2.2% | 222% |

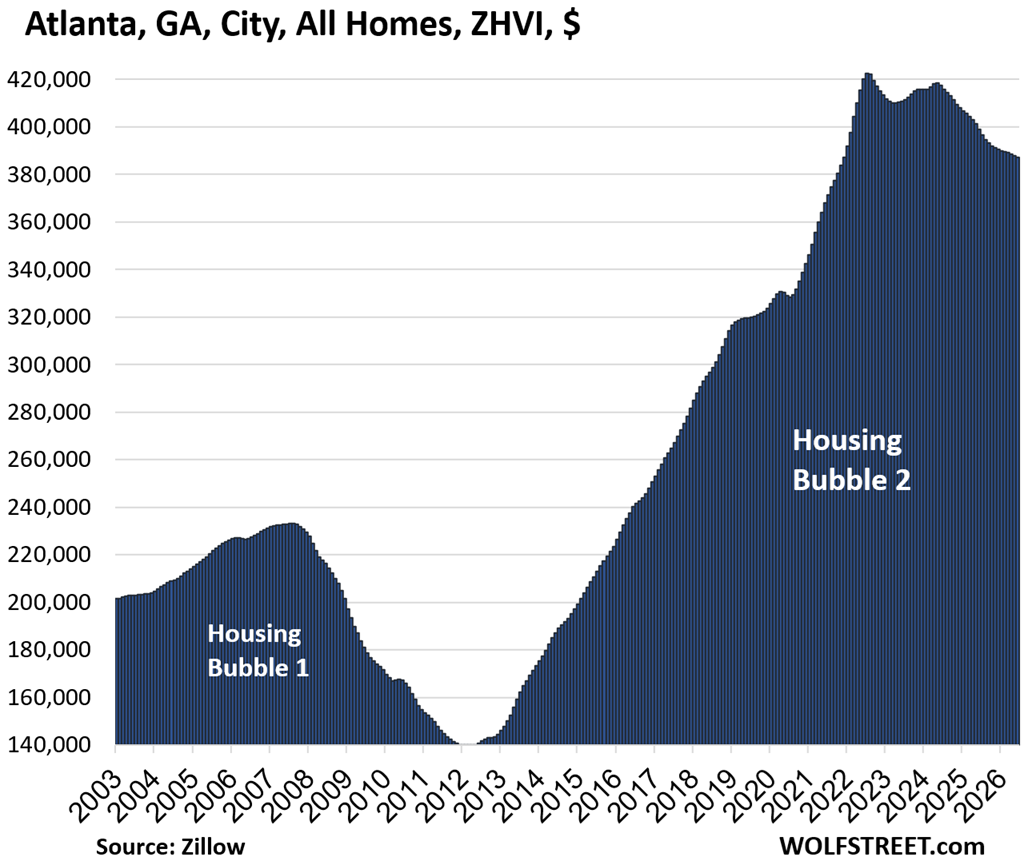
| Atlanta, GA, City, All Homes, Prices | |||
| From Jun 2022 peak | MoM | YoY | Since 2000 |
| -8% | -0.2% | -2.9% | 139% |
| San Francisco, CA, City, All Homes, Prices | |||
| From May 2022 peak | MoM | YoY | Since 2000 |
| -8% | 1.2% | 9.5% | 236% |
| Jacksonville, FL, City, All Homes, Prices | |||
| From Nov 2022 peak | MoM | YoY | Since 2000 |
| -7% | -0.2% | -1.8% | 203% |
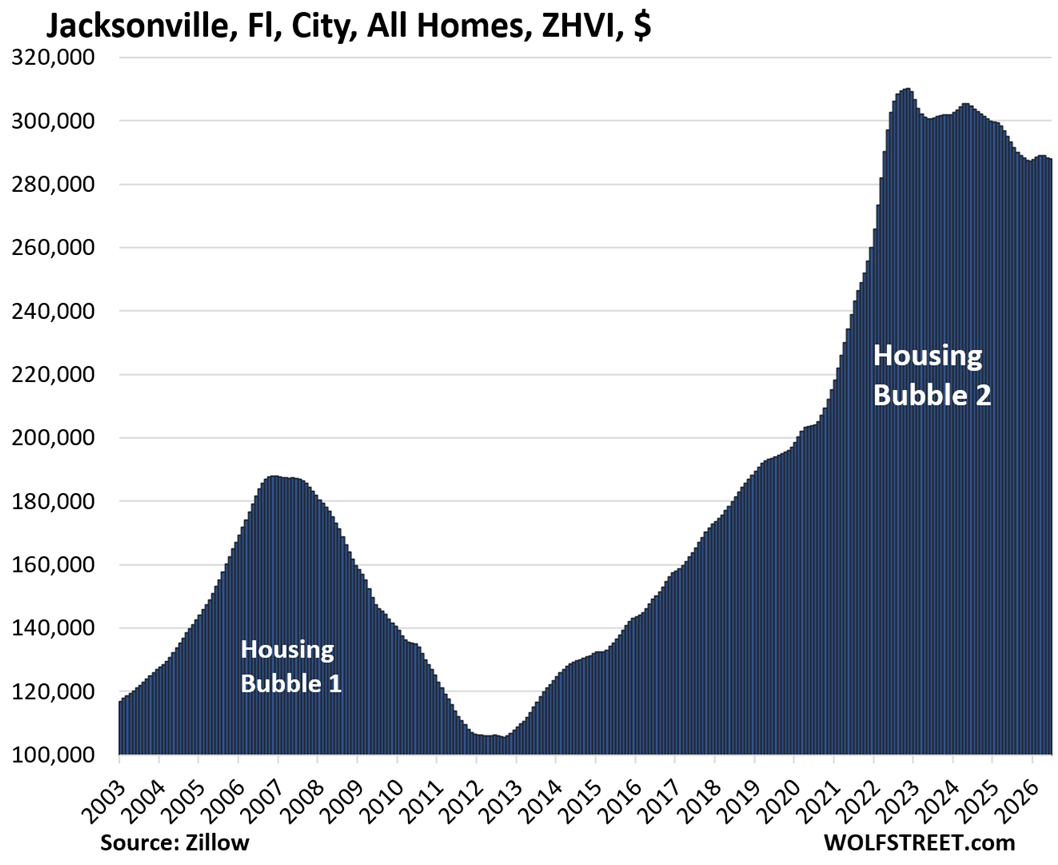
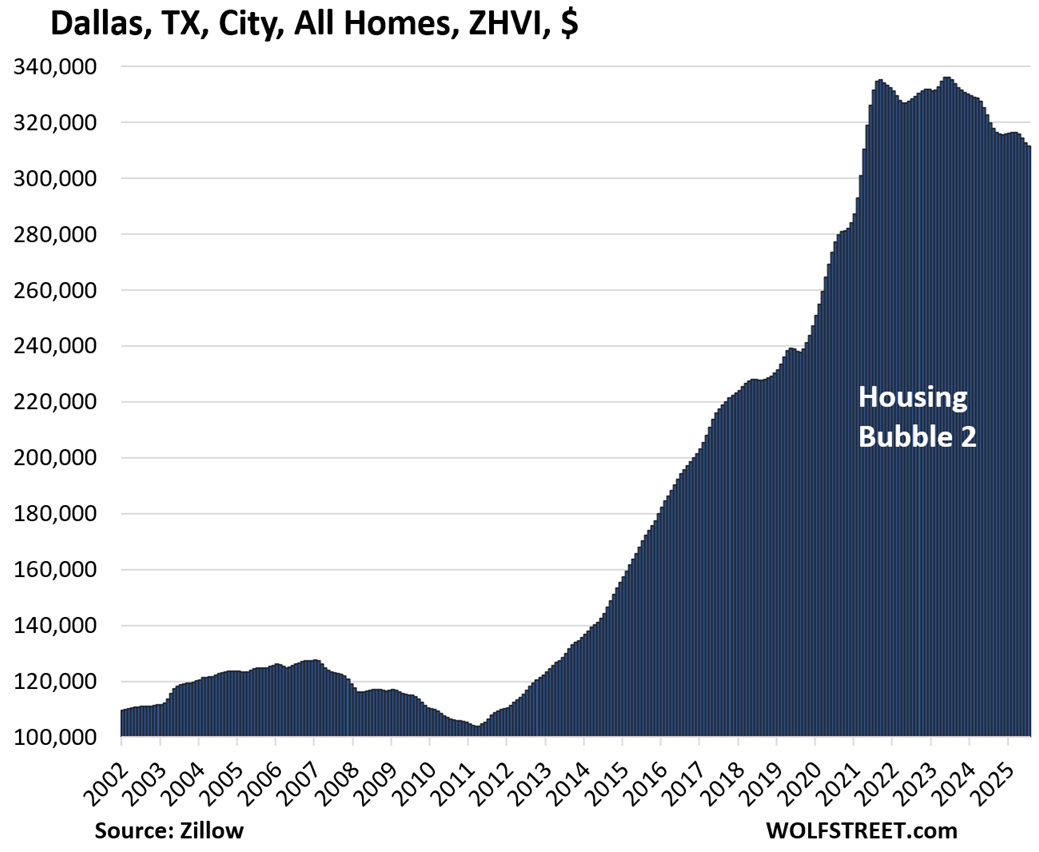
| Dallas, TX, City, All Homes, Prices | |||
| From May 2024 peak | MoM | YoY | Since 2000 |
| -7% | -0.4% | -2.7% | 211% |
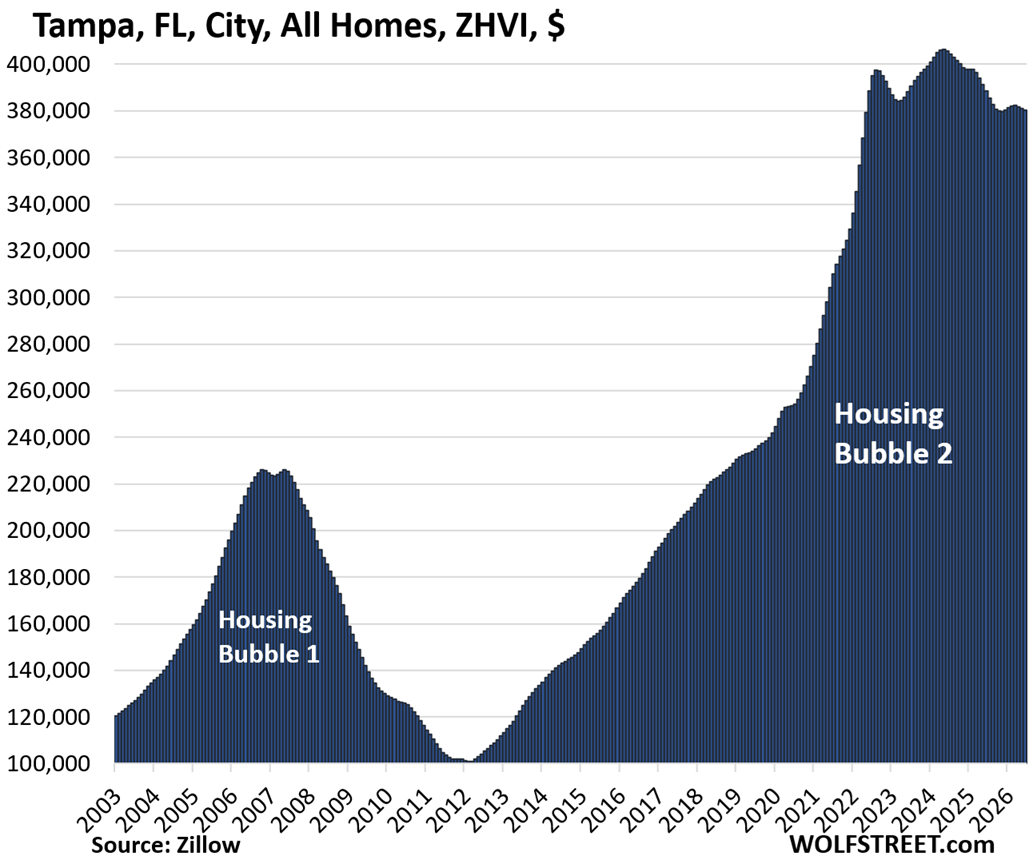
| Tampa, FL, City, All Homes, Prices | |||
| From May 2024 peak | MoM | YoY | Since 2000 |
| -6% | -0.1% | -2.1% | 310% |
| San Jose, CA, City, All Homes, Prices | |||
| From Jan 2025 peak | MoM | YoY | Since 2000 |
| -6% | -0.7% | -1.8% | 331% |
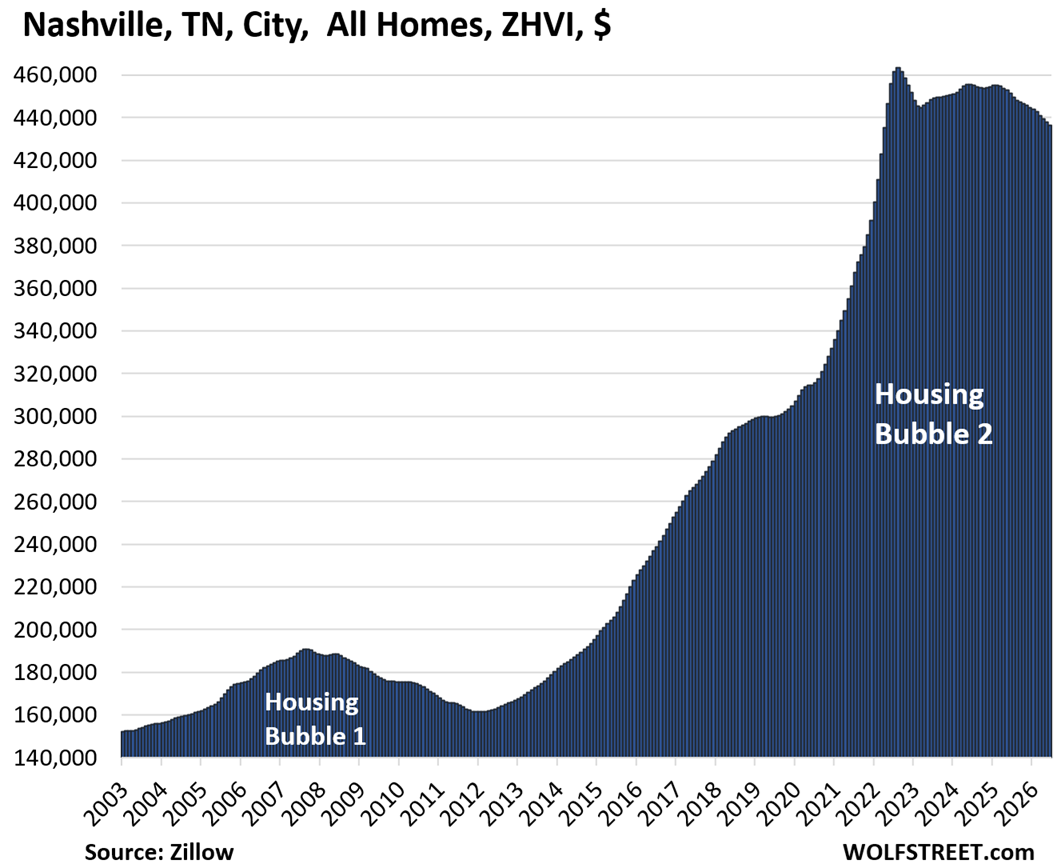
| Nashville, TN, City, All Homes, Prices | |||
| From July 2022 peak | MoM | YoY | Since 2000 |
| -6% | -0.3% | -3.3% | 211% |
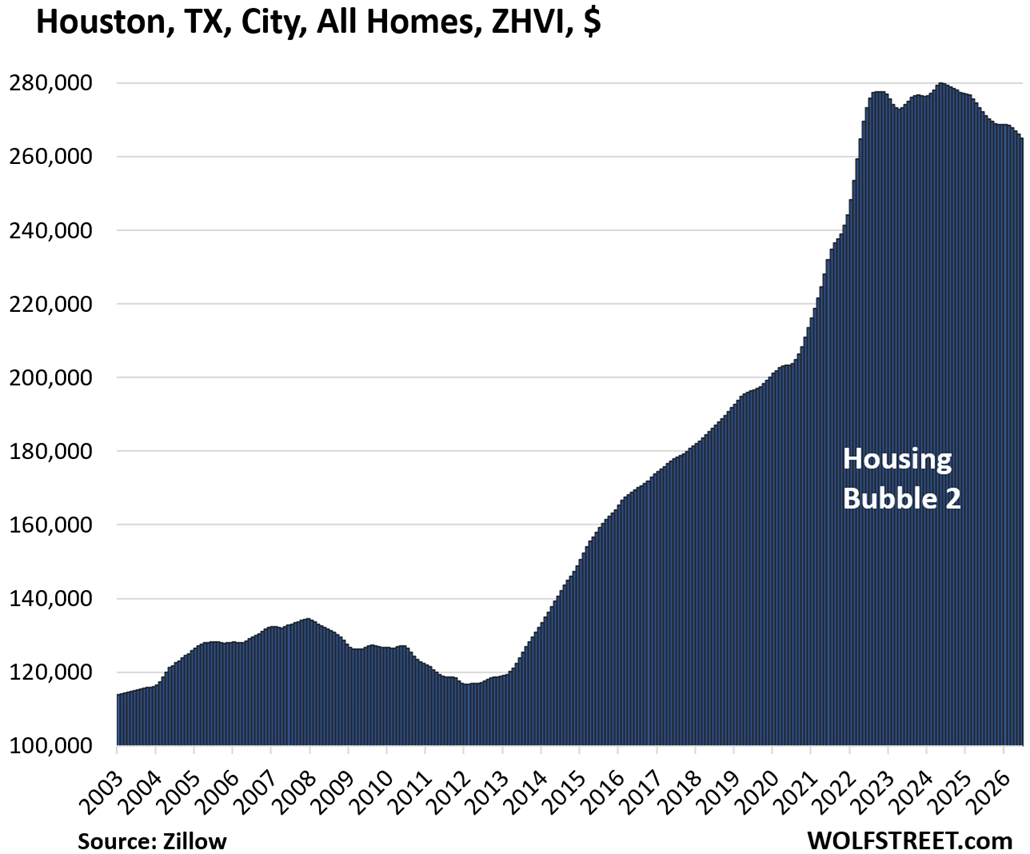
| Houston, TX, City, All Homes, Prices | |||
| From Jul 2022 peak | MoM | YoY | Since 2000 |
| -5% | -0.4% | -2.6% | 151% |
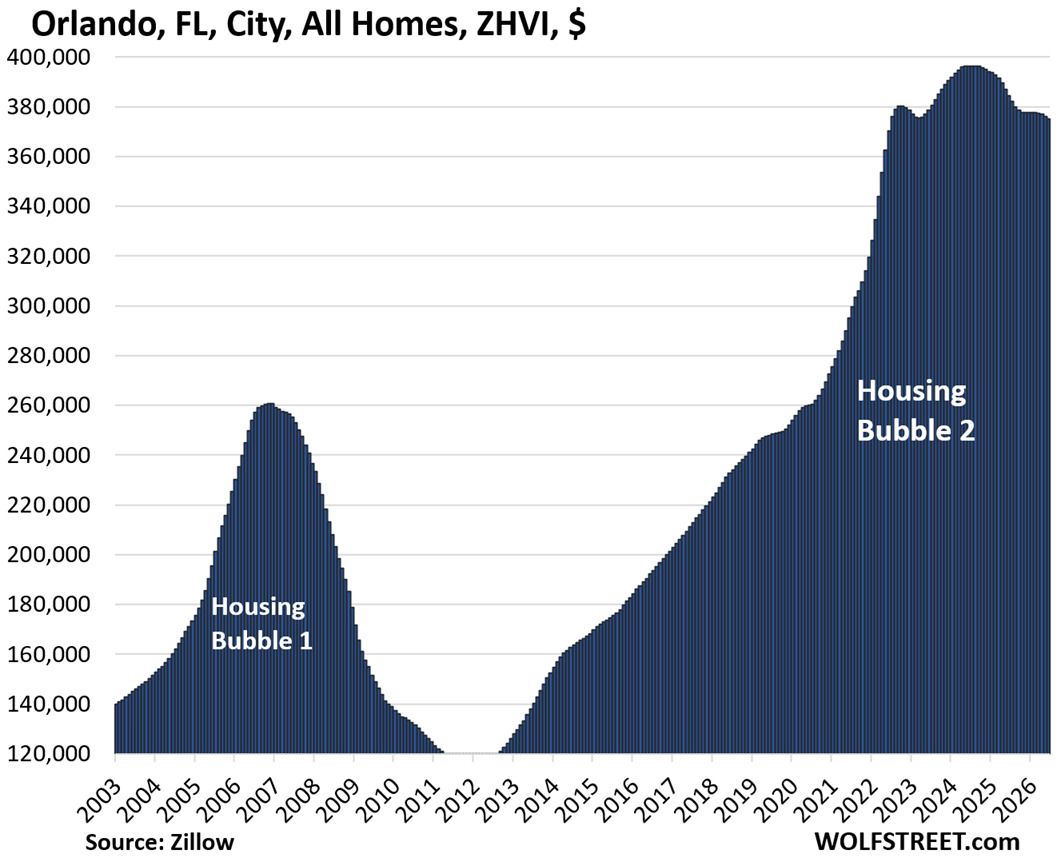
| Orlando, FL, City, All Homes, Prices | |||
| From Jun 2024 peak | MoM | YoY | Since 2000 |
| -5% | -0.2% | -2.4% | 239% |
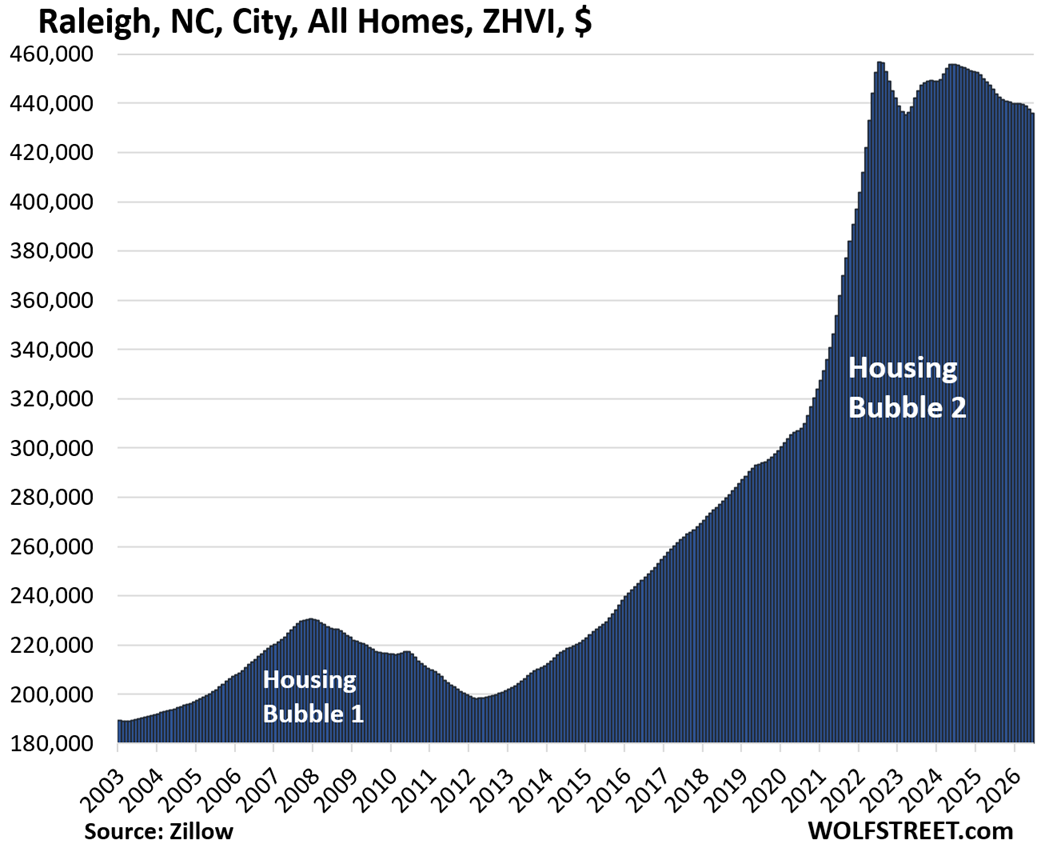
| Raleigh, NC, City, All Homes, Prices | |||
| From July 2022 peak | MoM | YoY | Since 2000 |
| -5% | -0.3% | -2.1% | 147% |
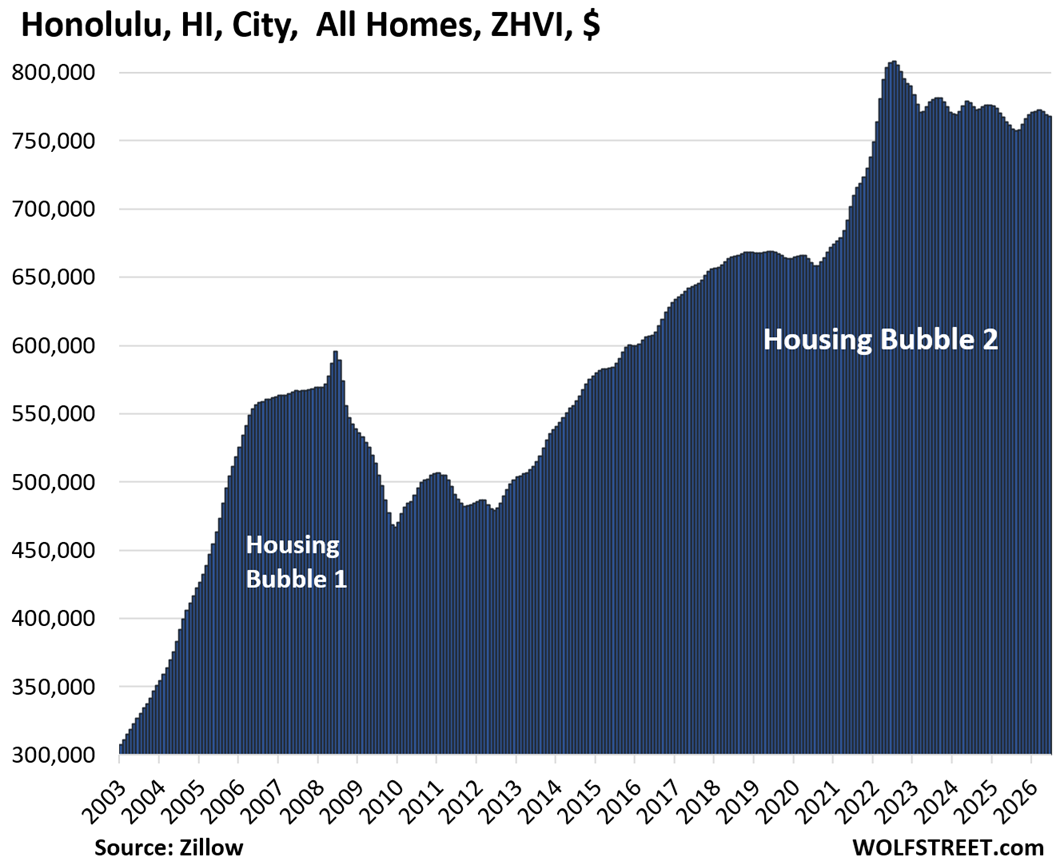
| Honolulu, HI, City, All Homes, Prices | |||
| From Jun 2022 peak | MoM | YoY | Since 2000 |
| -5% | -0.2% | 0.9% | 206% |
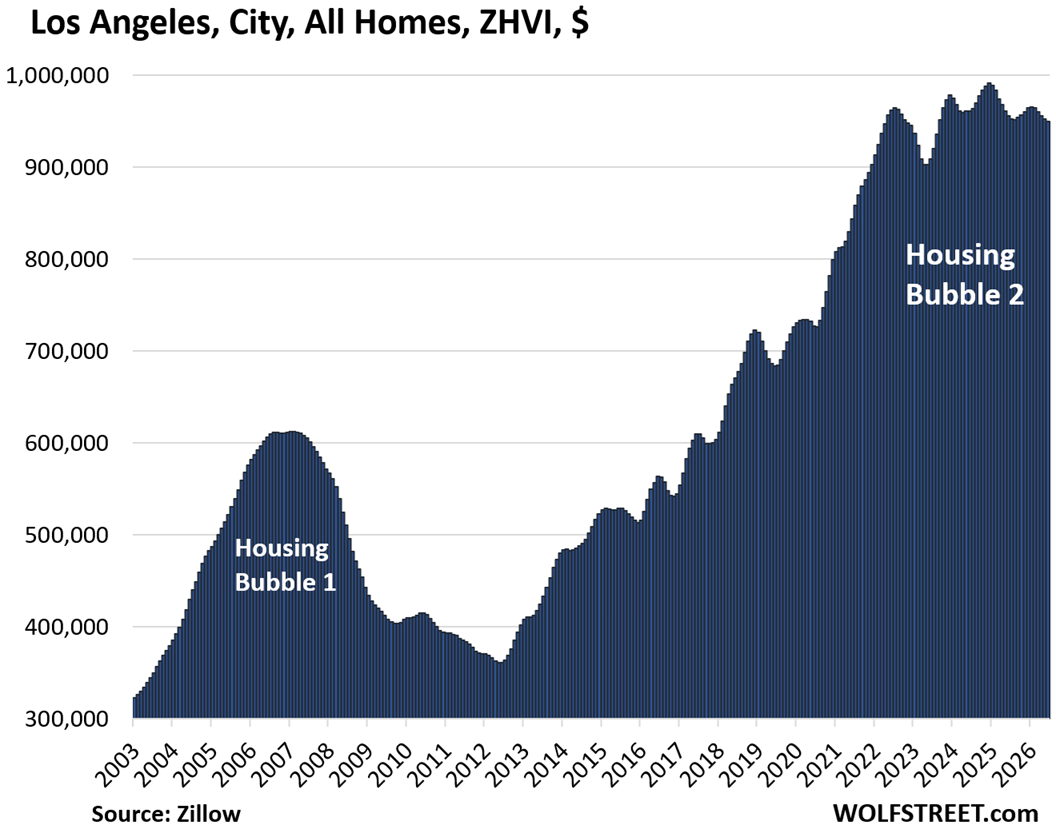
| Los Angeles, CA, City, All Homes, Prices | |||
| From Dec 2024 peak | MoM | YoY | Since 2000 |
| -4% | -0.3% | -0.7% | 322% |
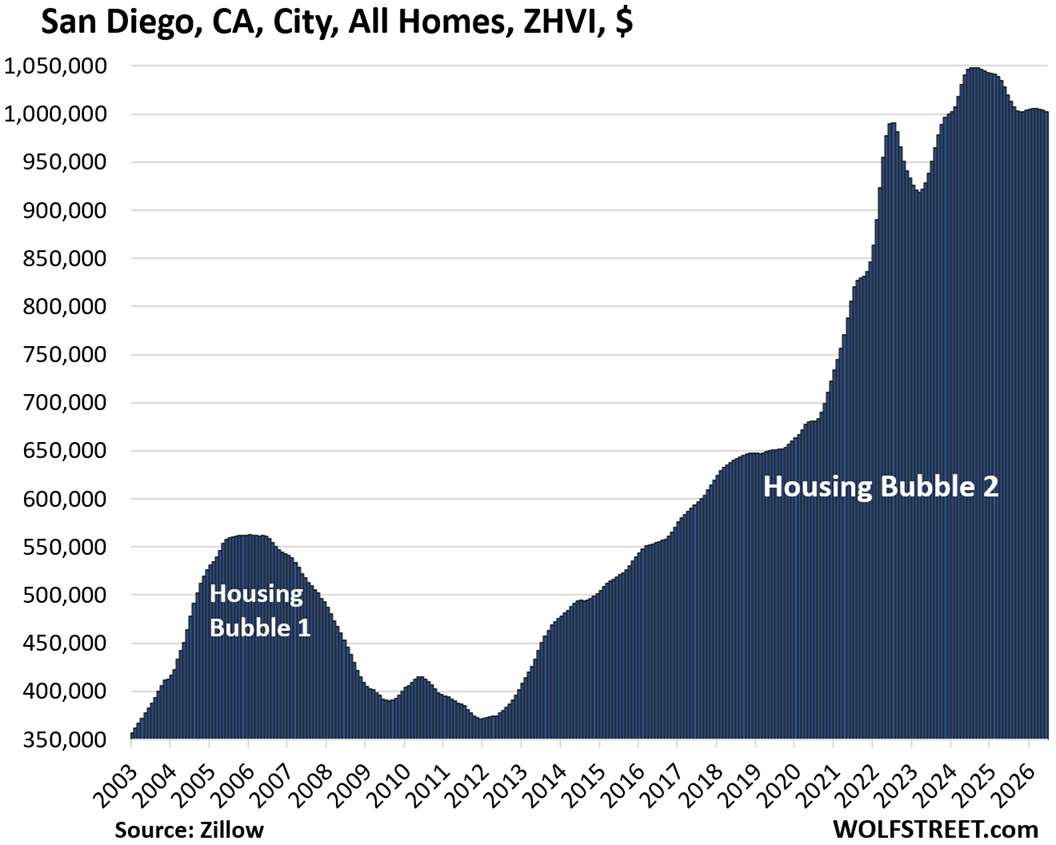
| San Diego, CA, City, All Homes, Prices | |||
| From July 2024 peak | MoM | YoY | Since 2000 |
| -4% | -0.2% | -1.7% | 346% |
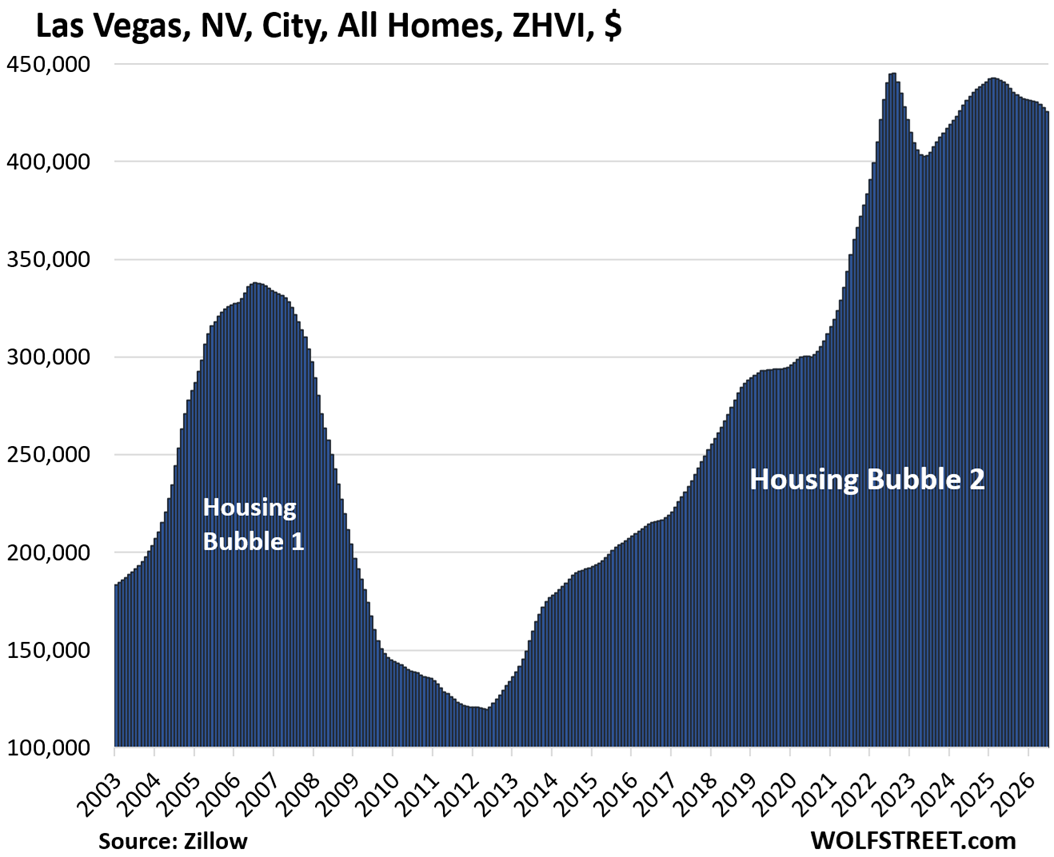
| Las Vegas, NV, City, All Homes, Prices | |||
| From June 2022 peak | MoM | YoY | Since 2000 |
| -4% | -0.5% | -3.1% | 174% |
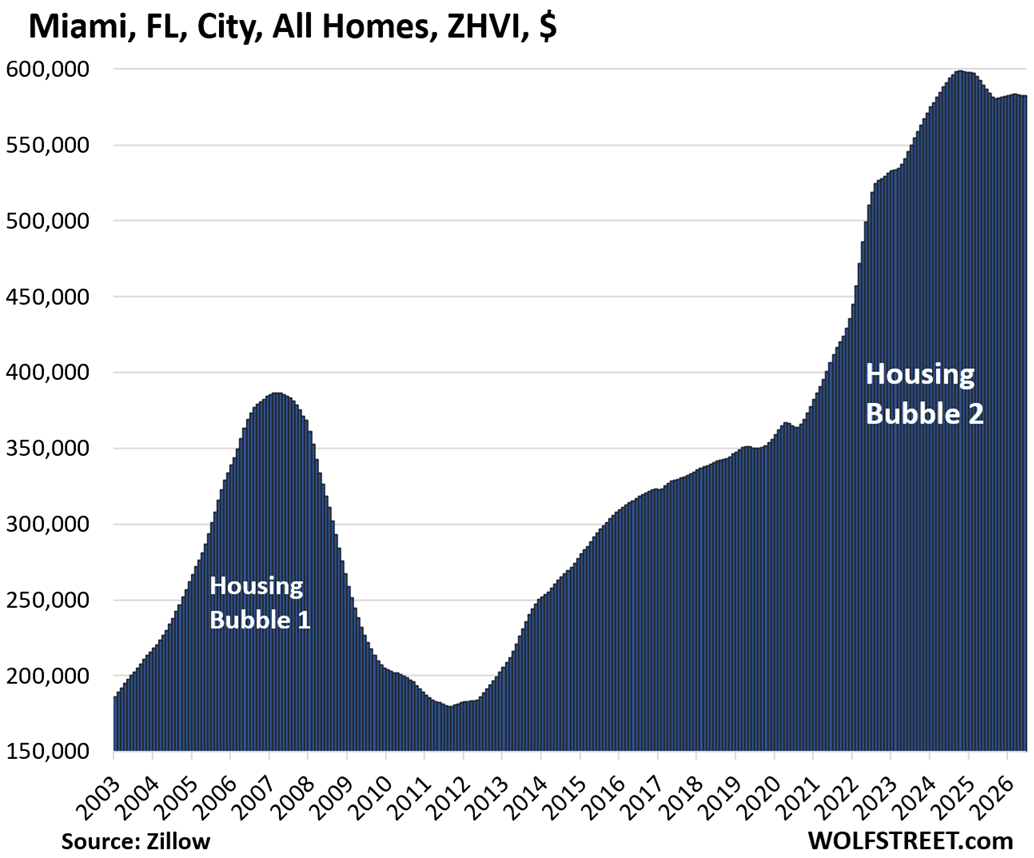
| Miami, FL City, All Homes, Prices | |||
| From Oct 2024 | MoM | YoY | Since 2000 |
| -3% | 0.0% | -0.7% | 342% |
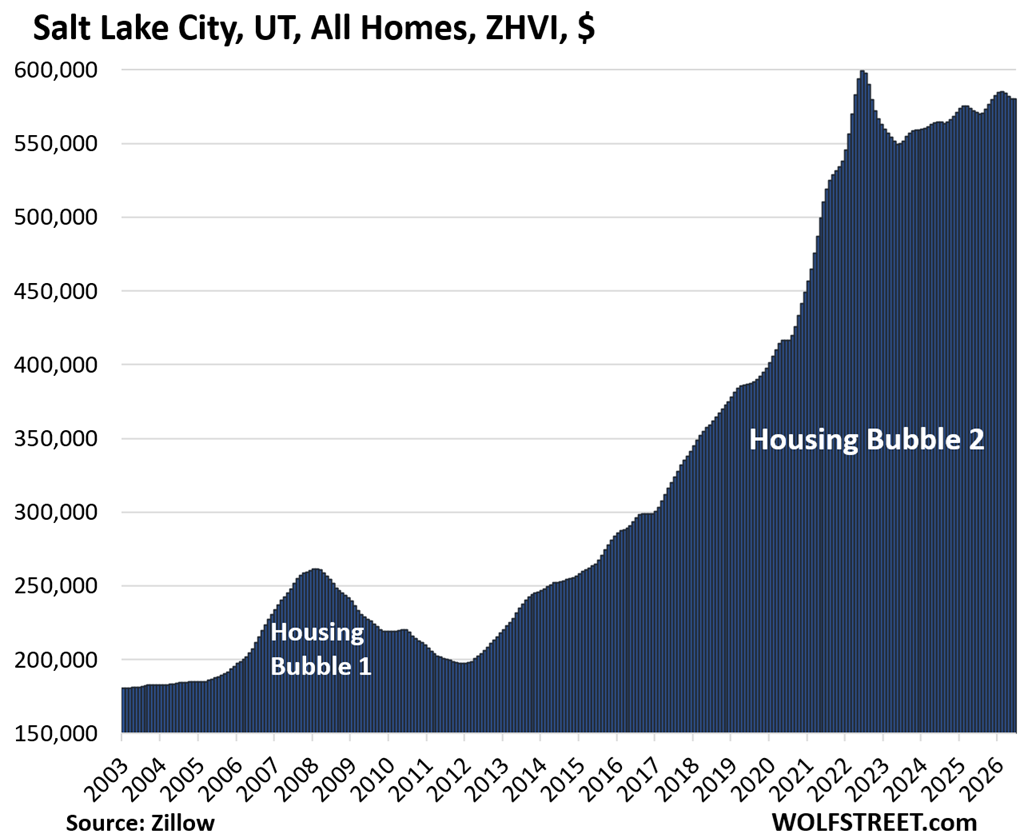
| Salt Lake City, UT, All Homes, Prices | |||
| From July 2022 peak | MoM | YoY | Since 2000 |
| -3% | 0.0% | 1.7% | 239% |
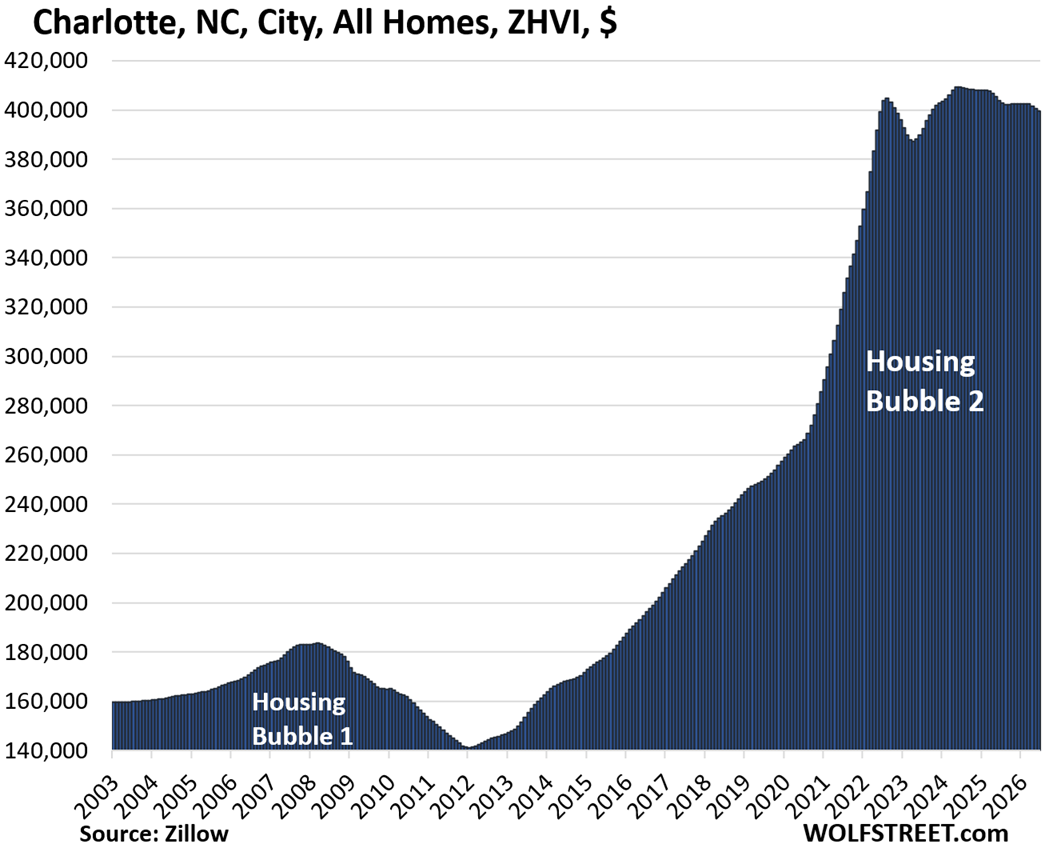
| Charlotte, NC, City, All Homes, Prices | |||
| From May 2024 peak | MoM | YoY | Since 2000 |
| -2% | -0.3% | -1.1% | 166% |
| Boston, MA, City, All Homes, Prices | |||
| From Apr 2025 peak | MoM | YoY | Since 2000 |
| -2% | -0.7% | -1.3% | 261% |
| Philadelphia, PA, City, All Homes, Prices | ||
| MoM | YoY | Since 2000 |
| -0.2% | 0.4% | 270% |
| Minneapolis, MN, City, All Homes, Prices | ||
| MoM | YoY | Since 2000 |
| -0.4% | 0.9% | 194% |
| Omaha, NE, City, All Homes, Prices | ||
| MoM | YoY | Since 2000 |
| 0.0% | 1.5% | 151% |
| New York City, NY, All Homes, Prices | ||
| MoM | YoY | Since 2000 |
| -0.1% | 3.8% | 240% |
| Chicago, IL, City, All Homes, Prices | ||
| MoM | YoY | Since 2000 |
| 0.4% | 3.9% | 118.1% |
In case you missed it: Supply of Existing Single-Family Homes Jumps to 10-Year High, Condo Supply to 14-Year High. Sales Slip Deeper into Deep Freeze.
Enjoy reading WOLF STREET and want to support it? You can donate. I appreciate it immensely. Click on the mug to find out how:


How much has the value of a dollar bill fallen since 2000? Almost exactly 100%, accoring to CPI. Home prices used to track CPI, but politicians put their thumb on the scale around the year 2000, turning a place to live into a financial asset. Residential real estate is likely the most tax incentivized investment class at this point.
> “How much has the value of a dollar bill fallen since 2000? Almost exactly 100%, accoring to CPI.”
Your answer would mean that if I had a stack of Benjamins squirreled away since 2000, it would be worthless, but that isn’t true. I think the answer is 48%.
Obviously, I didn’t read very far to see your correction before making this reply. Oops.
Sorry, the value of a dollar has fallen 50% since the year 2000, obviously not 100%. That corresponds to a 100% increase in the price of a home, as a baseline for what would be “normal”.
Some people think the USD isn’t going to fall any further. Funny.
They should read the projections as to when the interest cost on the US debt becomes the biggest budget item, and 100% of the current budget. It’s coming, just a matter of when. Not one president or Congress will stop this freight train.
And the only way out w/o causing a depression is to inflate our way out.
The value of the USD is always evaluated against other currencies. Too often doomers focus only on the US vs what is happening in those other countries. We’re becoming ever more the cleanest dirty shirt unless you can point to contrasting sources of strength for other major currencies.
I agree with that, even though you seem to think that defeats my theory.
I am actually not a doomer. A currency reset will be great in the mid to long term, and will go along ways towards resetting a lot of the big imbalances in wealth in the in U.S.
The wealthy with substantial portions of their wealth in U.S. Treasuries will take it on the chin more than any other group. If I am a ‘doomer’ I am only a doomer for those people.
When mortgage-holders effectively get their mortgages paid off in the currency reset, it will be a great day for those mortgage-holders.
You don’t actually think that we will pay-off the debt do you, or think that the debt will go to a quadrillion (1000 trillions) do you ?
The value of the dollar is overvalued, By the time Trump gets done, it may be lucky if the dollar isn’t trading for 20 cents.
20 cents of which other currency?
I live just outside of the DC swamp. Prices definitely have cooled. If a house is nice and priced right it moves quickly with multiple offers . If not, it sits a long time. Many sellers still think they are in charge and slow to adjust.
Finally, a finger pointed at Bernankes Fed. Who would of thought below nominal mortgage rates would cause such inflation after 14 years. Or how much competition was snuffed with cheap money mergers and acquisitions or how government at the Federal, State and local levels squandered trillions from cheap bond sales?
Once again the Fed comes through ti wreck futures and our economic welfare.
Yeah, the Fed. Enemy of a peaceful, well-ordered society.
I suspect that because the Fed is really a bunch of banks, that they want strong inflation because that raises asset prices, and makes loans less likely to go insolvent, which is good for the banks. There is no law to prevent them from working in their own best interests.
I also suspect the Fed is the heart of the Deep State.
Are you claiming that American society before 1913 was more peaceful and well ordered than society since then? I would argue that the opposite is true, thankfully, but I don’t think it has much to do with the Fed.
Nope, but the U.S. was well on the way towards having a more peaceful and well-ordered society, and the Fed definitely interrupted and reversed that trend.
There are webpages that address this topic.
Bernanke was the agent that created the current economic chaos
QE is a foolish philosophy on it’s face
This stuff is very interesting to me.
Here where I am in a very small market in the south, it appears that the market is pretty steady, or maybe rising. Houses do not stay on the market long at all.
It could be people are just pricing to sell. It is also a very demographically young area, and a desirable school district, so that probably plays into it.
Mid range houses still move pretty quick…..new starter homes, used older homes… they are moving sometimes in days.
No Wolf research or real numbers to support anything I said, just observing area goings ons.
Our observations can be colored by our biases
Trust the data
Jon…
The problem is there is no good real data for my small area….
I am not saying house prices are Higher or Lower…
but they are still selling here. Sales are moving, mid ranged new and used.
It may be reasonable seller pricing, or desirability of buyers….?
Not sure…. But decent houses are currently selling quick here….
Many times in days or weeks.
Well hold on to that optimism because your going to need it,
The stocks are worthless if no one wants o buy them
Dang:
I am not optimistic one way or the other as far as sales or pricing.
I purchased my home for the sole reason as a place to live… I worked to pay it off.
The value of this place to someone else could fall to zero, and it would not bother me.
It is still very valuable to me as a decent roof over my head.
By the way….
To clarify…
I was not really commenting on prices up or down necessarily…. Just quick movement.
So, there are two freaks of nature where homes deviated from what is expected, while the vast majority did as expected.
Some guy suggested in a recent real estate article that the 22,000 tech multimillionaires would jeep bay area home prices high. I almost fell off of my chair. A quick search reveals “The nine-county San Francisco Bay Area has roughly 3.03 million housing units.” 22,000+ multimillionaires will not keep the housing bubble from popping.
“…two freaks of nature where homes deviated from what is expected,”
Yes, the two being Chicago and New York City where prices are still rising.
maybe add San Francisco where prices started spiking again but remain below the peak in 2022.
28 cities have fallen below the peaks in prior years led by “Austin (-27%), Oakland (-25%), New Orleans (-19%), Washington D.C. (-13%), Denver (-13%), Phoenix (-11%), Fort Worth (-10%), and Portland (-10%).
3 more cities have turned south earlier this year, but it’s too soon to call. We’ll have to wait and see for at least a year.
This summary of the article was provided as public service.
Even with these (mostly) minor decreases in home prices, we have a
CRISIS OF AFFORDABILITY in this country – an absolute disaster. This crisis is, I believe, artificially created, that is, it is being promoted and encouraged by certain entities.
Wolf will maybe not agree with my assessment. Those graph do not show ‘Housing Bubble 2’, they show Housing Monstrosity 2.
All those charts up there need to lose about another 10% to be reasonable again (not cheap) compared to wages – Unfortunately at this rate that 3-4 more years of waiting?
I get the govt thinks avoid a crisis by slowly letting prices drop while slowly letting wages appreciate. The dumb part of that plan means they’ll have 10 years of people who bought and lost value, instead of just 1-2 years of people who paid too much. And most people stay in a house for ~7 years so the recent buyers would have been fine and everyone else had enough equity.
Not to mention people priced out during that 10 year period and unable to afford anything at all.
That must explain the increase in homelessness. /s
These charts are interesting. They will be more interesting in 12 – 18 months considering the chart of pending home sales show sales are at their lowest level since at least year 2000. Interesting times indeed.
Also can we please replace realtors already? They could easily be replaced with software….
They’re at least partly to blame for the fomo mania, housing prices are going to the moon marketing. Date the rate, marry the house. And other BS. They created a lot of this lower rates are coming soon propaganda.
In 2022 during CPE I was told anytime inflation has exceeded 4% or 5% (I don’t remember but a target we vastly exceeded) that it had taken on average 10 years for inflation to go back to 10% and to expect higher rates for awhile. Bank of America said something similar. This knowledge existed and was widely available, real estate agents could educate themselves on these topics – this is not new or shocking. If they have no training on economics and monetary policy they shouldn’t be talking about interest rates. If housing is an “investment” they should have a fiduciary responsibility to be honest and not just sell hopes and dreams.
Anytime a real estate tells me something, I now just ask chatgpt to pull the actual data and fact check it with Claude. And most of the time real estate agents are full of shit. I’ve been reading more and more stories about people using ai for listing their house themselves (listing, pricing, comps, staging recommendation, what touch ups bring in value and what don’t etc), holding an open house or two, and a real estate lawyer for the transaction and and they save tens of thousands of $s on the commission. This is the future….
Long rant – but let this be the first profession AI replaces OR require them to be useful and act as a fiduciary and make them have to take actual trainings of any topic they’re going to advise clients on.
LOL! You think realtors are a problem? How about attorneys? That a good sheep, Look over there, don’t focus the actual criminals or crimes. At the root of all the rot is the fact that we have been rewarding bad behavior in America for 50+ years. CONgress is now fully OWNED, so it no surprise that these criminals are not representing the interest of the average American.
What do the attorneys who are not in politics have to do with this ? I have a securities attorney for our company who has nothing to do with this.
Agree with you, and will also point out that both realtors and attorneys were around long before the current mess.
Allow me to help you out. In the late stages of all empires, the elite will change the laws, via attorneys, to make what was once bad business practices or outright fraud, legal. There are good attorneys, I know several who were witnesses for the state during the S&L “crisis”. All of them were receiving death threats and some were in protective custody. Unfortunately, it would seem that there are far more self-serving criminals in the law profession. The very creation of MBS was a violation of several contract laws (similar to the S&L crisis). It’s funny how the sheep accept fraud as a “crisis”. All this does is give the perps time to buy congress, via K-street, and change the law. In fact, all the laws that were enacted after the great depression have now been erased.
hedge accordingly.
Congress generate spending bills and legislation for new laws . I suspect that the majority have some sort of law degree or background . Regardless the legislation is written by the private sector legal system influenced by Congress and special interest groups (lobbyists). Legal systems that are imbedded in the system that ensures future regulation and revenues for themselves . Recession will just cause higher inflation as deficits will skyrocket
MM,I sold 2 family homes worth over a million each decades back and a condo for a friend at 2 a.m.(guy worked 2nd shift)all without realtors or ai.
I as a contractor made sure the places solid/would pass home inspectors and had curb appeal(?)and had a good closing attorney.
Unless you have a sudden job relocation or just can’t deal with people selling a home with a good closing attorney is easy,saves you monies and allows for more price wiggle room.
What’s the best strategy for finding a “good” closing attorney?
You can also use a title/escrow company.
Jeff,my attorney came decades back thru construction and a recommendation from another contractor,word of mouth have found best way to find all business contacts though even then do your own diligence.
Love that! That’s my point, what expertise or even usefulness do realtors bring to the table?
Obviously it’s a big financial transaction so you want to be sure the contract is good, but realtors aren’t experts in contract law. A lawyer will do a better job and be cheaper.
They also aren’t financial experts or fiduciaries.
They also aren’t experts on the state of the house, I.e. what kinda shape are the roof and furnace in?
I think it’s BS you can’t look at a property in CO (except open houses) unless you sign with a realtor now.
I’m considering getting my real estate license just to bypass this BS.
They are supposed to be experts in the local market–schools, crime, future development plans, etc. You know, the most important aspects of living somewhere. Moreover experienced realtors have assisted hundreds or thousands of people in real estate transactions and thus should be able to give good advice based on their experience helping people with similar backgrounds to yours, etc. There are psychological factors in life. If you can read the Bible, why is a pastor needed?
“I think it’s BS you can’t look at a property in CO (except open houses) unless you sign with a realtor now. ”
That was laid on the market by Merrick Garland.
>>I think it’s BS you can’t look at a property in CO (except open houses) unless you sign with a realtor now.
It is not that you CANNOT, it is that agents often WILL NOT, show you houses without a signed contract (even if just applicable to that one house).
Several states (WA is one of them) have laws that say that a buyer agent is not owed a commission unless the buyer has agreed in writing, including how much (which may exceed what % or $ that a seller is offering to the buyer’s agent, so be careful what you sign). Now, I have met several agents that have outright lied to me about this: They said: “The law says you must sign this contract before I can show you a house”. That is a blatant lie. What the law says is that the agent cannot demand a commission unless the commission has been agreed to in writing. That is not the same thing.
My take: Only sign such agreements for a specific house, consider asking for a non-exclusive, and limit the time of the contract to, say, 90 days or even shorter, with no funky extension clauses hidden.
William McDonald , above, comparing RE agents to pastor or priest: I think we have reached peak delusion. RE agents are more like Tele-evangelists who preach “abundance”.
You blame 3% mortgage rates on Realtors? LOL!
There is much to blame on the real estate sector but that elephant lives in Powell’s hose.
Get real, realtor. The NAR has been pushing for low interest rates since ALWAYS. NAR is one of the biggest lobbying groups in Washington, DC. Realtors are very much responsible for housing inflation.
Most owners don’t want to deal with the “hassle” of selling a home. Texas is a non-attorney state, so you just use the standard TREC forms which cover 99% of scenarios. Those forms have spots for customizing your contract with all sorts of things.
In addition, some people have access to legal services through their work benefits, but most don’t use them. My conclusion is people don’t want to deal with it. It’s a service like window cleaning. Back in NY, we lived in a split level and I only needed a ladder for 2 sides of the house to clean my windows. It was only a 12′ ladder, about 20 windows, and I was OK with that. Here in Texas, I need a 26′ ladder to clean the 40 windows on my house, plus climb on a patio roof and put a ladder on that roof to get 4 windows out of reach of the ladder from the ground. So we choose to hire a window cleaning service to clean these windows because I don’t feel like spending an entire Saturday moving around a ladder, sweating my b@#%s off in the Texas heat. It costs me $800 a year to do this, windows get cleaned twice a year inside and out. This is America, the land of the choices. Choose to use an agent, choose to not use an agent.
Agreed. And don’t forget how the realtors impede sales progress by encouraging sellers to falsely value the houses too high, and how the realtors back in 2022-2023 listed houses as “cash only”.
LOL!
Yeah, it’s not greedy sellers at all. You should get licensed and see how it really works. A “this is my forever home!” buyer paid $800k and 2 years later is “entitled” to sell for $1,500k because she(he) manifested it. Many agents just go with the flow, list high and hope to ride the price drops down and get paid. Just try telling a Woke seller the truth and see how much business you get.
“Buyers are liars and sellers are worse.
Trust another agent and get yourself a curse.”
I heard that over 40 years ago and it’s still true the vast majority of the time.
It is definitely a swamp, but the greedy flippers are as much to blame as anyone else.
What in goodness name is a “Woke seller”?
California transplants that infest States outside of California.
It’s a big problem. The self entitled attitude is off the charts. The very attitudes that have caused problems in California(causing many of them to move out of state) are carried like societal diseases to places like Austin, Boise, Nashville, etc. Colorado, Washington and Oregon succumbed decades ago. I still recall the bumper stickers all over Colorado in the late 70’s, “Don’t Californicate Colorado”. Bumper stickers didn’t stop the damage. Didn’t even slow it.
“They created a lot of this lower rates are coming soon propaganda.”
The president has said he wants lower rates forever and just put in place a Fed chair who said he expected to be able to cut rates. Rates were being cut until recently and until about a month ago every financial analyst said they expected additional rate cuts through the end of the year.
Unless the Fed does QE again they won’t be able to lower mortgage rates. Mortgage bonds (MBS) are set by the market- not the Fed.
Can I hear a shout out for Omaha, NE?
Yo, here is where it’s at.
“Regulations add approximately $131,734 to the cost of a typical newly built home, which accounts for about 26.4% of the final sales price. This figure includes costs from both land development and construction phases”.
Add to this high labor costs due to shortages of tradesmen, and it is no wonder housing is expensive.
I’m on a fairly long road trip now and noticed signs in Kirby, TX (suburb in the San Antonio area) by Lamar advertising houses starting at $140k.
So the $131,734 cost of regulation definitely does not apply to flyover states. Maybe, it does apply somewhat to high-cost areas like the Northeast and the West.
More likely, this is a highly exaggerated number pushed by the housing builders to shift the blame for their high-priced housing (yes, they sell very expensive houses too) on to the “Gubmint”.
Every industry tries to get regulations reduced mostly to the disadvantage of the common man.
Good points. The builders take the high-cost home as an example, and that makes them look good.
However, there is a large percentage of the total cost that is added due to regulations, even for modestly priced homes.
Zoning and land-use restrictions loom large, as do environmental requirements. In some towns, schools extort fees for children even in the case when the new owners do not have children.
Flyover states, 130K in fees, the absurdity of funding local schools……..welcome to the circle jerk that proves money and intelligence are not strongly correlated due to illogical policies and greed.
@Sean Shasta “the $131,734 cost of regulation” is probably an average. Here in CA I paid more than that to replace over 100 feet of sidewalk (that was fine) and two drains that the city made me get to replace a leasing office at an apartment building. Because they called the leasing office “commercial” they made me pay more than $100K for a “commercial” fire system (with a deticated connection to the water main in the street that was installed by union labor). The city also now “requires” me to pay over $1K/year to “monitor” the fire alarm system in the $1mm building with the $100K fire system (that is only used 9am-5pm).
@ApartmentInvestor: You replaced a leasing office with a section of sidewalk and two drains? Do you sit in the drain and sign the leases, or what? In all seriousness, maybe you should replace your English-teacher first.
Also serious: I get what you are saying. But an apartment complex is in and by itself a set of COMMERCIAL buildings. And if it cost you $1M to build a leasing office, it must be a VERY big apartment complex and a VERY big leasing office, and there are standards for such buildings, just like any other office building had to have sprinklers even though it is mostly occupied only 09-17.
“I’d have $131,1714 more if only the government did not force me to adhere to fire safety standards”.
It most certainly does.
Not in rural areas. The City & counties they reside in easy to hit that number. Last subdivision I worked on near Madison, about 15 years ago, it was around 55K /lot before any dirt was moved.
And then they all pontificate on urban sprawl!!
Yeah the lack of regulation has no cost.
So when does the Dr. Michael Burry effect kick in (i.e.: when do I buy into a housing market short)?
Steady as she goes. A decade of flat or down 10, 20% home prices is exactly what’s needed. Basically a 50% price cut from the 2022 peak after inflation.
Anyone who “lucked out” with a 3% mortgage back then paid the absolute highest price possible and will be waiting a while until someone else comes along to pay more.
Agreed.
Probably no big bust in nominal prices is coming. Feb doesn’t want the banks going bust.
Banks aren’t on the hook for mortgages this time, tax payers are.
Also we’d see a crash if we got a recession and stock market down turn. All you need is forced selling which doesn’t happen much at full employment
Without it though we’ll stay in this slow steady decline.
There wasn’t much of a housing crash when the stick market bubble popped and the NASDAQ lost 85% of its value from 2000-2003, and there was also a mild recession in there somewhere.
Meanwhile space X is approaching 50% down in its month old bear market.
Well, I have noticed that when a bank goes insolvent, the executives do end up losing their jobs and having difficulty getting new jobs as older people, they just seem to ‘retire’, and I am pretty sure that all shareholder value is wiped out.
“There wasn’t much of a housing crash when the stick market bubble popped and the NASDAQ lost 85% of its value from 2000-2003, and there was also a mild recession in there somewhere.”
The economy was not highly dependent on asset (e.g. stocks) like it is now. The A.I. narrative is driving the billions in construction for bridges to nowhere (data centers). When this bubble bursts, Wall Street better find another narrative to cling on to. Otherwise, the upper end of the K shaped economy will sag into an R.
Many people I know who already owned houses, almost paid off, did a cash out refi at an insanely low rate, then bought a 2nd house as an “investment” and had the same payment as before, or lower, but had an additional house.
What on earth would they want ‘an additional house’ for?
Since 2000 these price increases amount to about 4% a year – more for Florida and CA less for TX, TN etc. So just ahead of CPI inflation. Truth is that prices were already too high in 2000, it’s just that the ultra low interest rate environment disguised the affordability issue until 2008 and again more recently. Shows how long we have been living in cloud cuckoo land. On the other hand – property has actually been a not very exciting investment since 2000, albeit very low risk and underwritten by various Federal bodies.
Raleigh is being stubborn.
You know you’re really poor just pretending to be rich.
Lol
Here’s a ‘home’ for you, Wolf – the 70th floor of the Transamerica Pyramid in San Francisco (181 Fremont Street). Price – $47.5 Million!!
6941 square feet. You could even run Wolfstreet from up there!
Here’s the humdinger – it was built and sold in 2018 for….$15 Million. Either we have the mother of all real estate bubbles, or our currency is becoming monopoly money.
Do you make enough from Wolfstreet to make that house payment? 😂❤️😊
LOL you’re falling for clickbait BS and twisting it to your own liking. Never gets old?
1. The Transamerica Pyramid is an office tower, not a residential tower. There are no residential units for sale in it.
2. All offices in it are rentals. There is nothing for sale in it.
3. The Transamerica Pyramid was sold to Cyprus-based Yoda PLC this March under distressed conditions at a $210 million loss, for $691 million.
The building, one of the premier buildings in SF, was purchased in 2020 for $650 million by Shvo and his investors (Bayerische Versorgungskammer and Deutsche Finance) and then renovated for $250 million (out of a planned $400 million project). So by the time the deal collapsed, they had $900 million in it, and it sold for $691 million, or a 23% loss.
“In public, Shvo touted “record-breaking” leases at the renovated property as evidence that there was demand for his project. But the rent credits and generous remodeling allowances his team was giving tenants in order to woo them from other buildings cut into those profits.” : SF Standard
Bad Feng Shui from the Transamerica “financial product” scammers that used to occupy the place.
“This massive home-price inflation over those two years, which came on top of the already outsized price increases in the prior years, was caused by the Fed’s reckless free-money policies, which included trillions of dollars of purchases of Treasury securities and mortgage-backed securities (MBS), which produced the below-3% mortgage rates, even as inflation was raging at the time toward 9%, which led to off-the-chart FOMO buying behavior at the time.”
The few times they were actually asked, the FED has completely denied this. But they mostly don’t even allow the question. So, the entity responsible for this assault on affordable shelter is completely disingenuous – LIARS.
Yet, when I question these proven LIARS’ data, my comments are usually removed. Why should we trust anything these liars say when they are completely unaccountable? They have ZERO CREDIBILITY.
The US Treasuries markets – where interest rates at set by the largest free market in the world – are vastly larger than the Federal Reserve and all mortgage rates are keyed off the yield (interest rate) on 10 year US Treasuries plus around 3%.
Can they control it? No. Can they delay things? Yes. The bear market in rates should have began in 2008. They’ve been putting that off with shenanigans for quite some time. They lost control in 2020.
Because life is like one giant high school. Most people follow popularity and “authority”. Until you can supplant either one of those, being right doesn’t matter.
Hey Rick, how many investors flock to get a piece of those $130k house in Texas? Zero! God dam the roaches. and can you do a study with fancy graphs to see if there’s a correlation between globalist or corporate controlled counties, exuberant regulations, and globalist subcontractors hired for basic government inspection of one’s construction. Something gone fishy with housing inflation. I can’t believe my eyes no more. Investors in housing, government as a housing developer fuck both of that!
I told you in spring of 2020 this was happening, why you so god dam shy about your delay in intelligence is been only 60% of a decade at this point, I have faith we will get the still….
Just because regulation ads cost at the time of construction does not mean that it doesn’t add value to the asset over the long run.
I don’t care for that expression – “The math ain’t mathin” but in this current housing market it fits perfectly.
The math ain’t mathin, unless a prospective homeowner wants to end up broke at the end of every month. Many young people feel shut out by this current housing market. And how can a homebuyer reasonably pay a monthly house payment each month and have money left over for other needs, including retirement savings?
Home payments are becoming an anchor around homeowners’ necks. A burden! So here we are at a major inflection point. It may become like a roller coaster ride or even worse for home sellers and for homeowners who bought at insane valuation levels.
Once upon a time, builders predominately used 2×4 lumber to build houses which cost about $3. Then came a very scary flu season during a presidential year, and those 2×4 magically cost $12. The science defeated the danger with a magic injection (and a lot of money) and 2×4 finally settled around $4.15 and and everyone lived happily ever after.