
Spring selling season was a dud. But mortgage rates are not high; inflation is high.
By Wolf Richter for WOLF STREET.
Sales of existing single-family homes that closed in June fell by 2.4% from May, seasonally adjusted, to an annual rate of 3.73 million sales, in the rock-bottom range that sales have been stuck in for four years, according to data by the National Association of Realtors today.
Compared to June in prior years (historical data from YCharts):
- 2025: +3.3% (year-over-year)
- 2024: +5.1%
- 2023: +1.4%
- 2022: -18.6%
- 2021: -28.8%
- 2019: -21.5%
- 2015: -21.8%
- 2009: +1.9% (Housing Bust)
- 1996: -1.1%
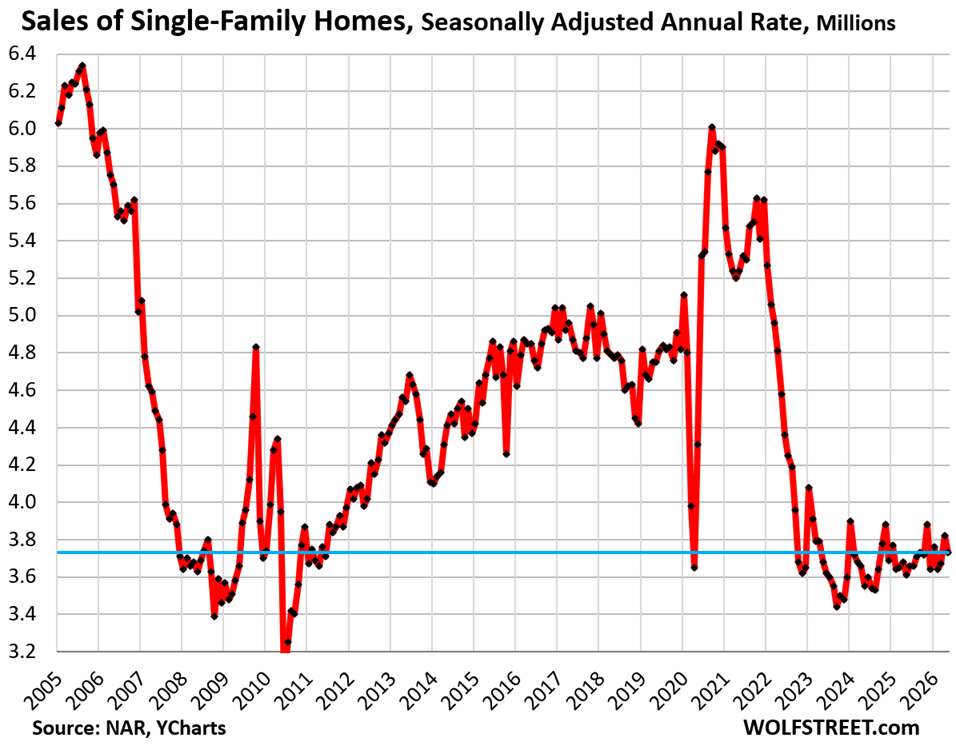
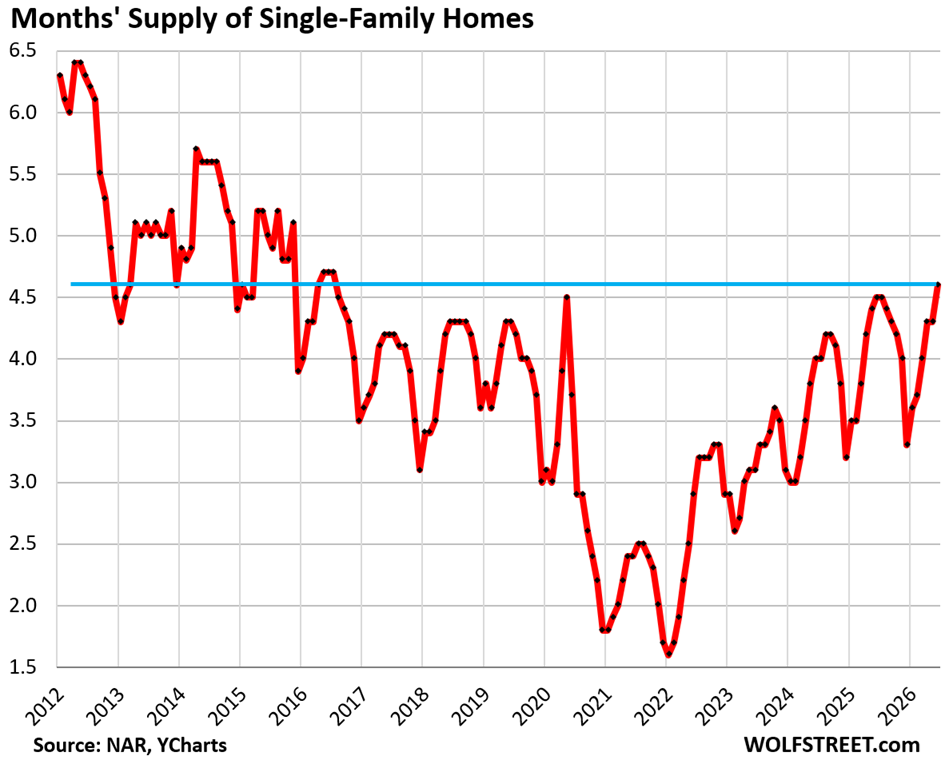
Supply of single-family homes rose to 4.6 months in June, the highest since 2016.
Supply is a function of inventory and sales – how much inventory there is in relationship to demand. Sales have hobbled along rock-bottom, while inventories have been rising (historical data from YCharts).
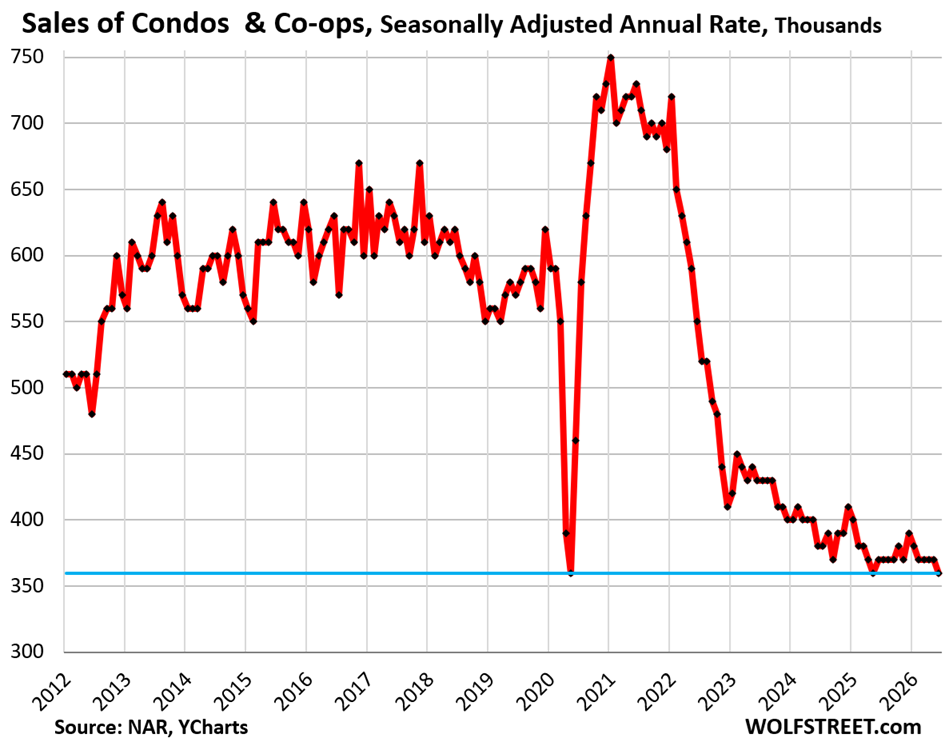
Sales of condos and co-ops fell by 2.7% seasonally adjusted in June from May, and by 2.7% year-over-year, to annual rate of 360,000, a record low, shared also by May 2020 and May 2025, all of them the same record low in the data that go back only to late 2011.
The seasonally adjusted annual rate compared to June in prior years:
- 2025: -2.7% (year-over-year)
- 2021: -50.7%
- 2019: -36.8%
- 2012: -25.0% (first June in the data series)
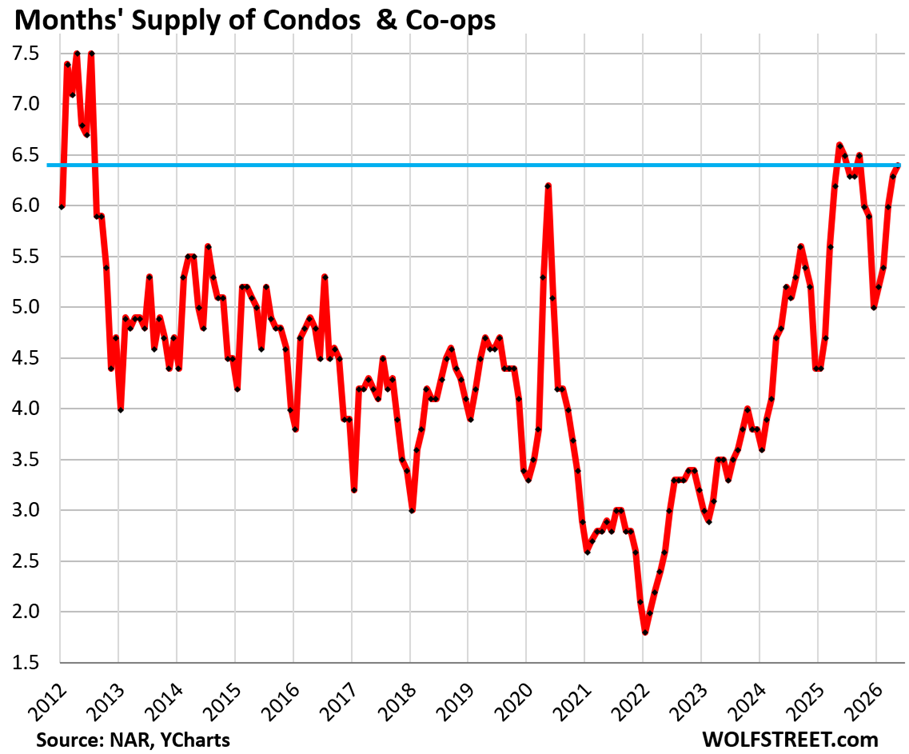
Supply of condos rose to 6.4 months, along with May, June, and September last year the highest since 2012.
Sales by region of existing homes of all types.
On a month-to-month basis, seasonally adjusted, sales of existing homes (single-family, condos, and co-ops combined) in June fell in the South (-3.6%), the Midwest (-3.0%), and the West (-1.3%), and rose in the Northeast (+2.1%).
Compared to the same month in 2019, sales in June were down: in the West (-33%), Northeast (-29%), Midwest (-21%), and South (-17%). A map of the four regions is below the article at the top of the comments.
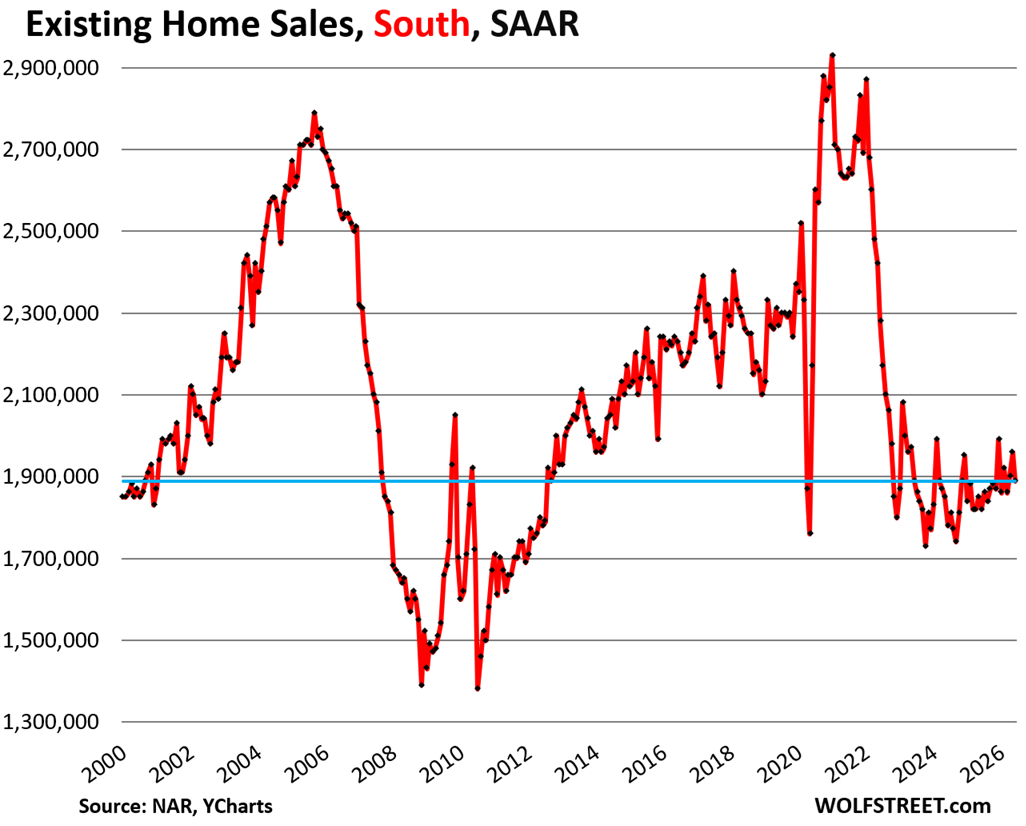
In the South, the seasonally adjusted annual rate of sales fell 3.6% in June from May, to 1,890,000 homes.
Compared to June in prior years:
- 2025: +3.8% (year-over-year)
- 2024: +6.2%
- 2023: 0%
- 2022: -17.1%
- 2019: -16.7%
- 2018: -16.4%
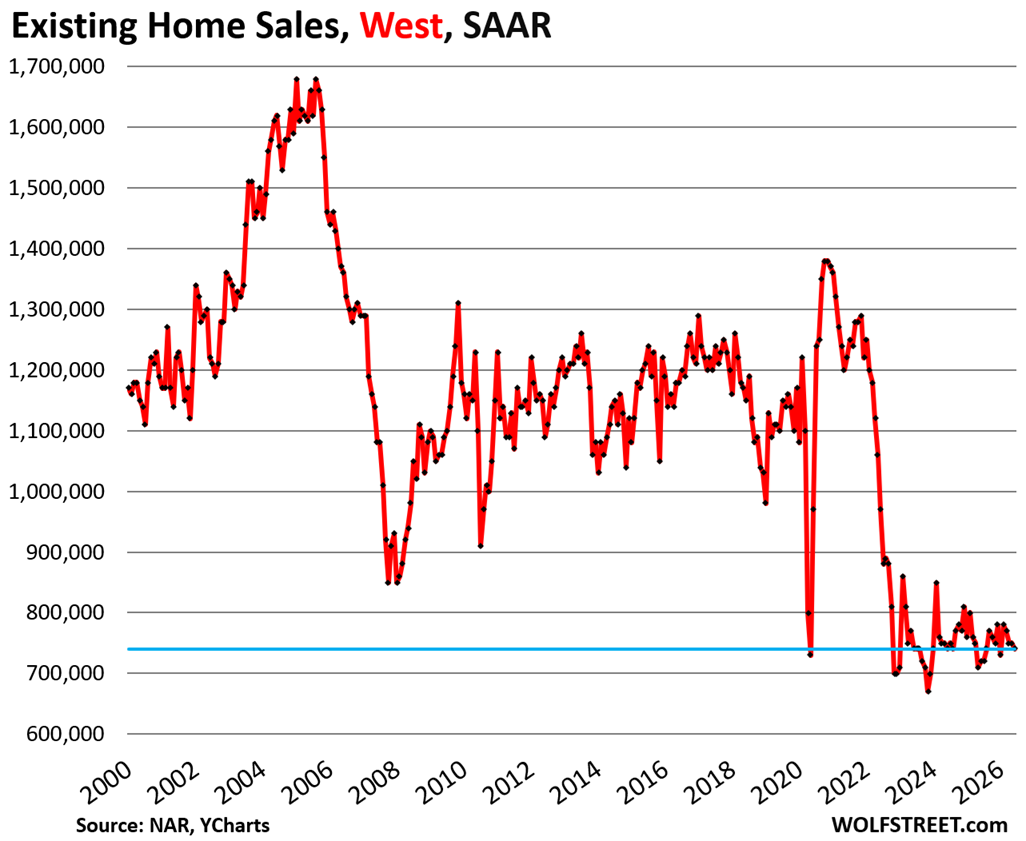
In the West, the seasonally adjusted annual rate of sales fell 1.3% in June from May, to 740,000 homes.
Compared to June in prior years:
- 2025: +2.8% (year-over-year)
- 2024: 0%
- 2023: 0%
- 2022: -23.7%
- 2019: -32.7%
- 2018: -35.7%
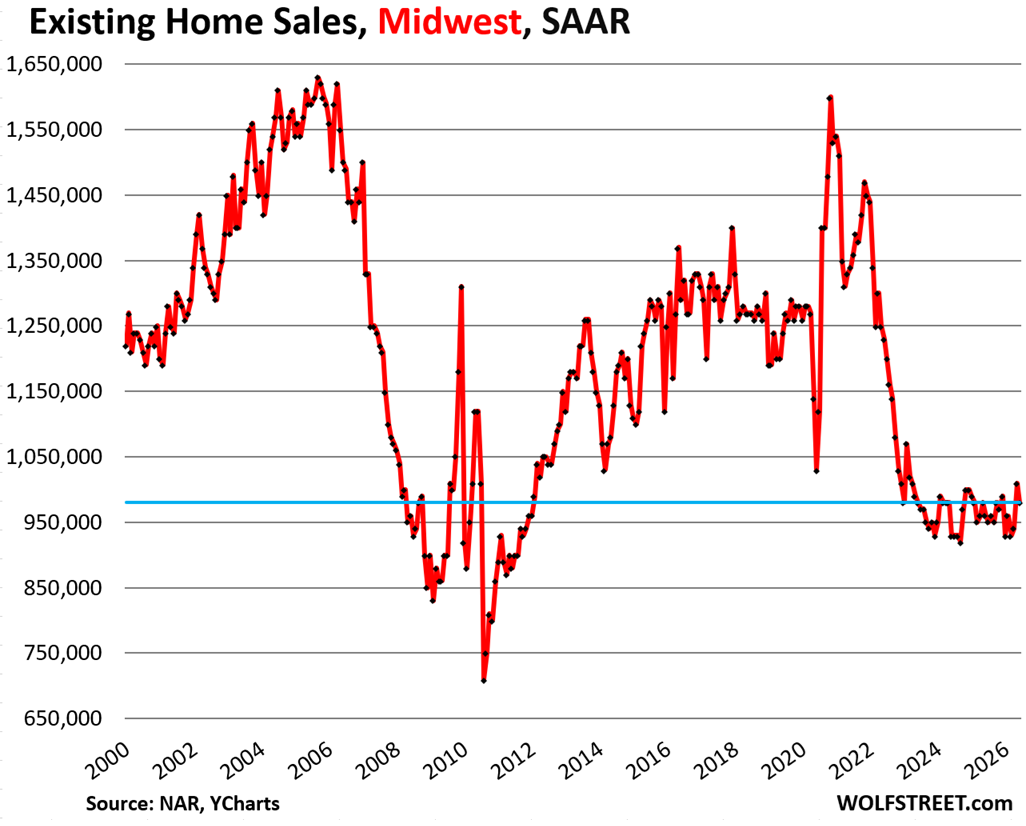
In the Midwest, the seasonally adjusted annual rate of sales fell 3.0% in June from May, to 980,000 homes.
Compared to June in prior years:
- 2025: +2.1% (year-over-year)
- 2024: +5.4%
- 2023: 0%
- 2022: -20.3%
- 2019: -21.0%
- 2018: -22.8%
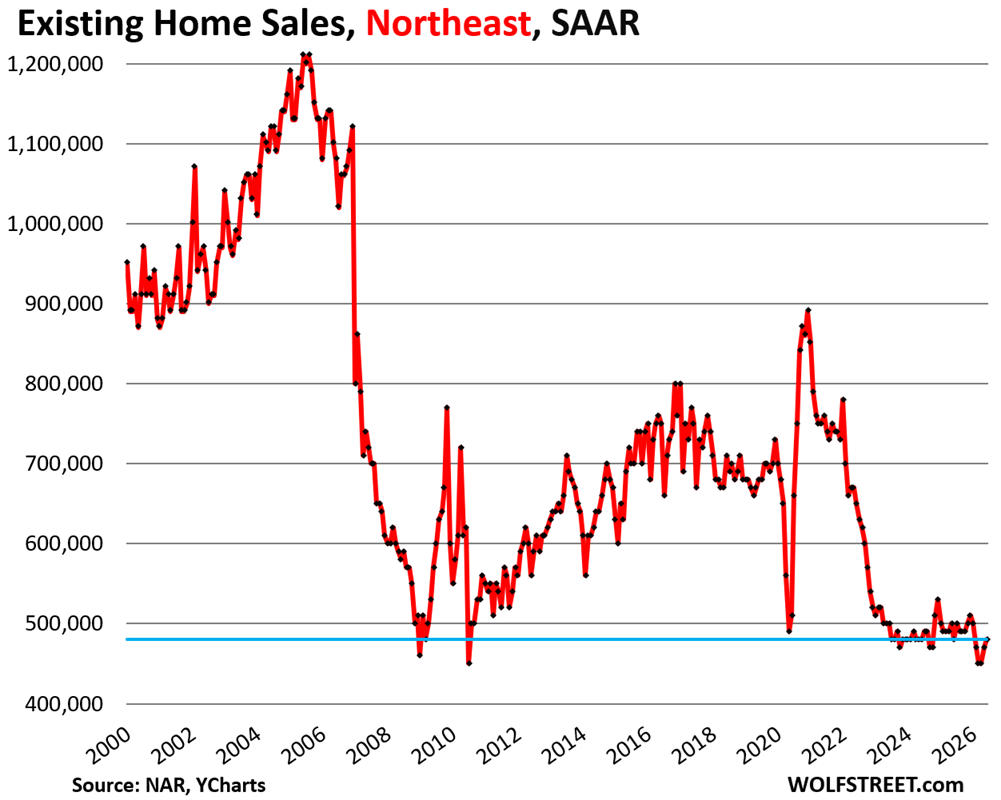
In the Northeast, the seasonally adjusted annual rate of sales rose by 2.1% in June from May, to 480,000 homes, but still just a smidgen above the record low in NAR’s data, which goes back to 1999.
Compared to June in prior years:
- 2025: 0% (year-over-year)
- 2024: 0%
- 2023: -4.0%
- 2022: -26.2%
- 2019: -29.4%
- 2018: -32.4%
But mortgage rates are not high; inflation is high.
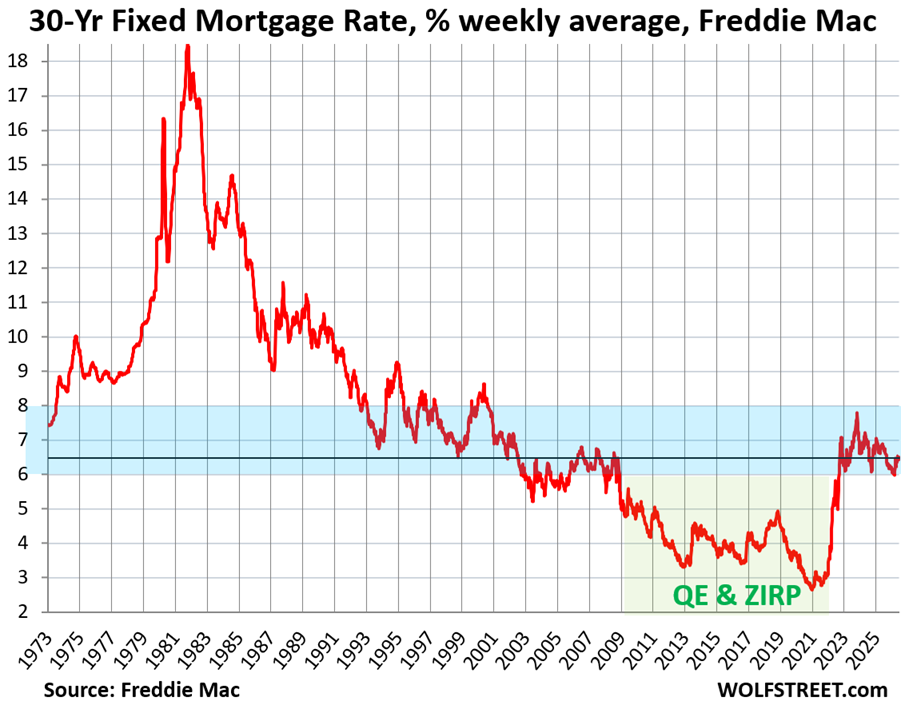
The average weekly 30-year fixed mortgage rate through Wednesday ticked up to 6.49%, according to Freddie Mac’s weekly measure released today.
Mortgage rates key off the 10-year Treasury yield (4.55% at the moment), but are higher, and the spread between them varies.
Inflation accelerated to 4.2% in May, as measured by CPI, and these 30-year fixed mortgage rates are only 2.3 percentage points above the rate of inflation.
Current mortgage rates are at the lower end of the spectrum that prevailed in the decades before the Fed’s QE which started in 2009 and involved purchases of trillions of dollars of mortgage-backed securities to suppress mortgage rates and pump up home prices and create the current affordability crisis.
Mega-QE during the pandemic, which triggered the below-3% mortgage rates and the negative “real” mortgage rates (mortgage rates below the rate of inflation), was the main culprit in the explosion of home prices from mid-2020 to mid-2022, and thereby the main culprit of the “affordability” crisis since then. Mega-QE also helped trigger the worst consumer price inflation in 40 years.
The housing market – buyers, sellers, and everyone in between – needs to get used to these mortgage rates.
National median price, local prices, inflation, and wage increases.
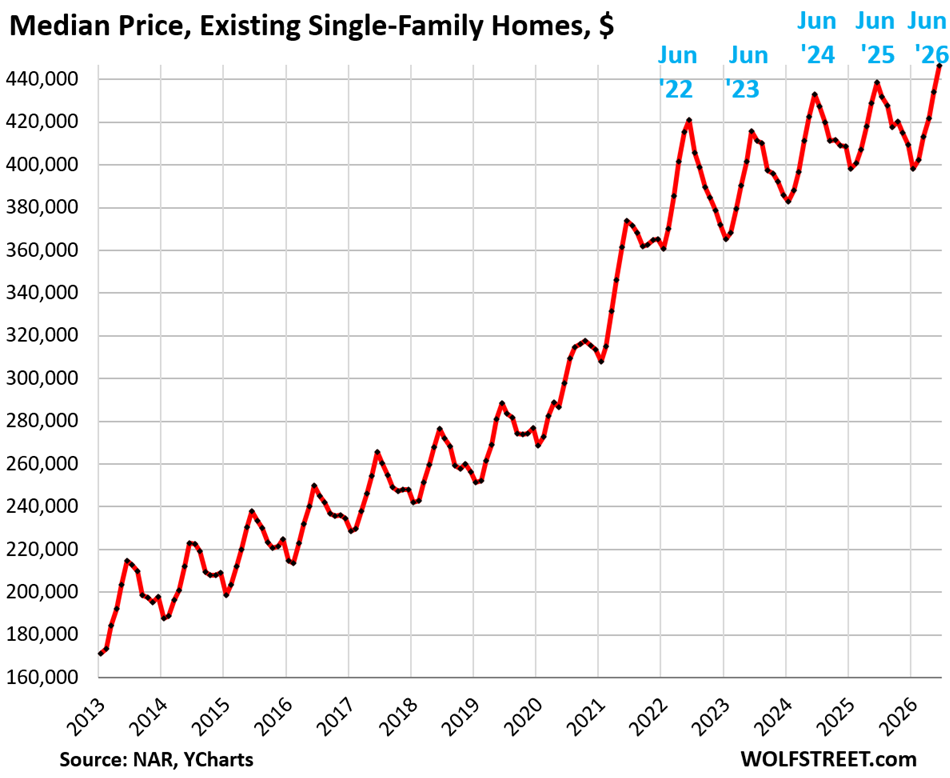
The median price of single-family homes inched up year-over-year by 1.8% in June, not seasonally adjusted, to $446,400.
From a macro perspective, since late 2022, the national median home price has been inching up at a pace that is substantially below the rate of inflation and wage increases. That is one way to very slowly, over many years, resolve the affordability crisis that was caused by the price explosion of the national median price of over 40% in two years from mid-2020 to mid-2022 that had come on top of already high prices.
From June 2022 through June 2026, over those four years:
- National median price of single-family homes: +6.1%.
- Consumer Price Index (CPI): +13.2%
- Average hourly earnings: +16.9%
But for people buying or selling a home, the national median price is irrelevant. What matters to buyers and sellers are prices in their local markets, where prices vary dramatically. Single-family home prices have dropped by 10% to 26% in 15 bigger markets, including:
- Austin, TX: -26%
- Oakland, CA: -25%
- New Orleans, LA: -20%
- Sarasota County, FL: -17%
But in some other bigger cities, prices of single-family homes have continued to rise to new highs, notably year-over-year:
- New York City: +5.1%
- Chicago: +3.9%
- Milwaukee: +3.7%.
On a national scale, these diverging markets nearly balance each other out, to where the national median price of single-family homes has been up by 0% to 2% year-over-year since April last year.
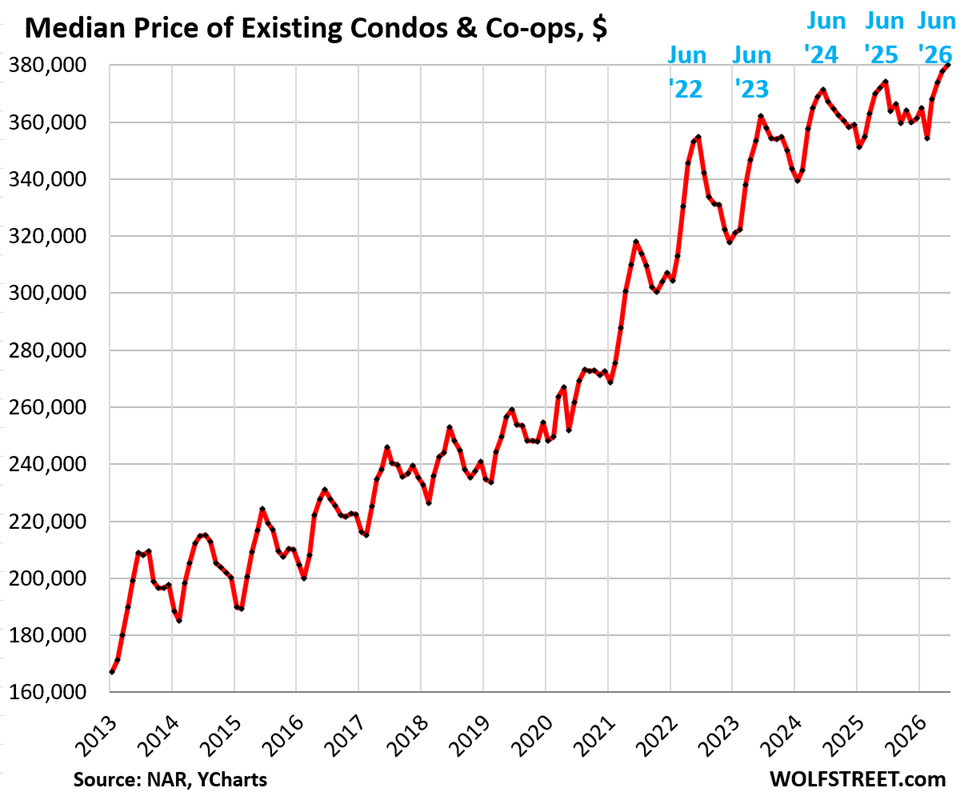
The national median price of condos and co-ops rose year-over-year by 1.6%. The year-over-year readings have ranged since April last year from -0.8% (September) to +4.0% (January).
On a local basis, condo prices have plunged by 15% to 33% in 24 markets from their highs, with several markets dropping below their highs in 2006. From peak:
- Cape Coral, FL: -33%
- Oakland, CA: -31%
- Petersburg, Fl: -28%
- Austin, TX: -27%
- Fort Myers, FL: -26%
- Sarasota County, FL: -24%
- Tampa, FL: -20%
- Garland, TX: -19%.
In case you missed it: Unwinding the “Lock-in Effect” Suddenly Stalls as Homeowners Stopped Paying Off Below-3% Mortgages
Enjoy reading WOLF STREET and want to support it? You can donate. I appreciate it immensely. Click on the mug to find out how:


Here is a map of the four Census regions of the US:
I’ve thrown in the towel on waiting. I have a family and want my kids to have a normal childhood in a family home. Bring on the huge mortgage payment. I’m done with dealing with shitty landlords who try and scam you for everything.
Thanks a lot JPOW for ruining the dream of home ownership for those under 40.
lol, I can’t make the math work.
Money would be incredibly tight, not much savings annually and there is risk of some huge repairs popping up.
I try every angle and calculation.
These sellers just want too much.
Sufferin and Jpow
I am very disturbed by your comments and situation.
I do believe most asking prices will eventually come down. That is if sellers want out, and one day all home ownership will transfer as estates are liquidated.
One small example: a local builder died about 18 months ago. Nice place, but as he declined he did not want to leave the area and listed very high. Then he dies, wife relocated to town and she still kept the price high. I see a sale closed last week at a 15% reduction. The final price was realistic.
Good luck you guys.
JPOW – I could have written the exact same post in 2007 when my kids were 9-12 years old, and never regretted buying a house then.
But please try to find a locale that won’t go down much in the next 5 years. I made a good guess on that, I hope you do too.
You only have young kids once in your life. Get them a yard to play in, and get rid of those f’ing landlords.
I’ve had a great landlord for the past 7 years. I’m lucky I guess, but not as lucky as him. I really wish I could buy, but a mortgage on this home for me would be over $4k per month, and while rent has only gone from $2200 to $2600 in those 7 years.
Condo prices in Garland TX are going down because of deportations.
Might be a great ploy to buy now in Garland, and when the next Dem is elected to the White House, the floodgates of immigration will be opened even more than during the Biden years, and the prices in Garland will go up more than most places in the U.S.
Those condos in Garland are all old (40+ years old), most were built in the 1980s when Texas was embroiled in the S&L scandal. The ones I have seen appear to have been poorly built and poorly maintained.
There was little reason for these condos to double in price during the covid years. A glut of apartments in the Dallas area are coming online that are putting downward pressure on the rents that these 40 year old condos can bring.
Garland is not unusual in this. Condo prices in Richardson, Plano, Carrollton, Farmers Branch, and Irving are in the same boat. Addison is probably the only outlier.
I thought Joe Biden was behind the COVID largesse at the expense of the US taxpayer
Trump first, Biden second, handed out stimulus trillions, including the PPP loans, which got spent and helped trigger the worst inflation in 40 years.
The Fed handed out $4.5 trillion in new money and bought MBS and Treasuries between 3-2020 and 1-2022, which caused interest rates, including mortgage rates to plunge, despite surging inflation, triggering the worst home price explosion ever and the current affordability crisis.
Fed Chair Powell was first nominated by Trump, confirmed by the Senate, then re-nominated by Biden and re-confirmed by the Senate. Powell was the guy that spanned the entire time.
I always cringe when people try to make the covid era inflation political. It obviously spanned both administrations. We clearly have a government we can’t afford and a central bank willing to tow the line
W R-“Trump first, Biden second, handed out stimulus trillions, including the PPP loans, which got spent and helped trigger the worst inflation in 40 years.”
“The Fed handed out $4.5 trillion in new money and bought MBS and Treasuries between 3-2020 and 1-2022, which caused interest rates, including mortgage rates to plunge, despite surging inflation, triggering the worst home price explosion ever and the current affordability crisis.”
Thank you W R for saying what few will say, and what fewer will admit or comprehend.
“Inflation is always and everywhere a monetary phenomenon in the sense that it is and can be produced only by a more rapid increase in the quantity of money than in output.” – Milton Friedman
“It is difficult to get a man to understand something when his salary depends on his not understanding it.” – Upton Sinclair
“People can foresee the future only when it coincides with their own wishes, and the most grossly obvious facts can be ignored when they are unwelcome.” ~ George Orwell
Recap.: Housing prices rose 30-50% due to mortgage rates being artificially driven to 2-3%. Rates down=prices up. Now rates are at 6.65% (MND), but prices haven’t come back down by 30-50%. Yet.
Summary: Existing home sales (EHS) are frozen. New home sales are moving because builders are providing massive incentives, and cutting prices to move inventory. Overall, U.S. housing is the most unaffordable ever, but this too shall pass like a large kidney stone. Yes, with a lot of pain, and coming to a market near you.
History says that asset bubbles always burst. There are no permanent plateaus, and no exceptions; an inconvenient truth. Just based on mortgage rates, house prices need to fall by 30-50%. That’s P&I only; doesn’t include carrying costs of T&I, HOA fees, maint. and repairs, which are also through the roof.
Prob better than being in the Great Depression part 2.
The markets were gumming up really badly during Covid.
… But markets recover. So what if they go up and down.
I’m so tired of this argument. There were ways to prevent the bond market from seizing up without printing $4 trillion.
TS, it’s true man.
Better to be in debt than to have no house, car or job.
You can be tired of the truth but it still hits you in the face like Mike Tyson if they did nothing.
@TSonder
I guess every financial policy leader in the developed world is just dumb for coming to the same conclusion as Powell. Inflation was everywhere, which is partly why people are overreacting on forums like this. Should have simply put a ping out to you for a quick explanation of the right way to handle things.
Mega QE was everywhere too, and so were trillions of dollar in stimulus deficit spending. They all did it, but Powell started it, and so the result — inflation — spread around the world.
” I’m done with dealing with shitty landlords who try and scam you for everything.”
Wait until you start not beling able to pay off the monthly mortgage on a $200k house (2002) priced at $500k (post 2002).
Whatever financial headaches you think you have with apartment renting, wait until you get sideways on a home mortgage – the negative financial impact can/will be 10x-15x worse.
Ask the 8 million home “owners” (out of 50 million with mortgages) who got foreclosed in Bubble Pop 1.0 (2007-2013) – ask about the financial impact on them.
Exactly why I’m still sitting on the sidelines years later. I have a massive down payment I can use, close to 50% for what I’d buy in this market but I’ve put too much skin in the game to gamble losing it. Rent is pretty cheap, the parity between rent and a mortgage are quite close now.
The issue is that I would need to buy far out of town, 1.5-2 hour one way commute which is fine for my current regional job but if this job goes under (and corporate’s doubling down on AI running operations makes that seem more and more likely) I’ll be stuck with 3-4 hours of driving into town for work that will pay less. And in the trucking world, 12-14 hour workdays are the norm. Especially local jobs.
I can cut and run in my current situation and need nothing more than a few hours and a 10′ box truck rental. Job issues don’t mean much now. Buying a house could cost me everything I’ve spent years working for.
Hopefully corporate will wisen up and stop screwing around with AI routing and dispatching. I’ve seen it work great at one company but not here. We are bleeding customers left and right because our service has tanked in quality and due to inefficiencies we have miles and labor hours through the roof. Operating costs are spiraling out of control while we have a customer attrition rate of over 2:1.
So glad you asked. The financial impacts are nothing for people with nothing to begin with. I walked away in 09 after the market went down 40%. I had put no money down so it was no different than renting from the bank for 3 years. I went to get an apartment and explained that my credit might be bad because of the foreclosure. She said my credit was better than most. Go figure. By 2016 I was signing on the dotted line again, but the ending was better this time.
Just buy it if you need it.
I bought my house in 2007 at the peak of the market because I want my children to have a house that I need they will enjoy. It’s an expense you have to pay. It’s not speculation. It’s not investment. It’s the price of raising a family.
My first mortgage rate is 6.8%. It came down pretty quickly afterwards. My current mortgage rate is 3.125%. I will pay off the loan after my youngest go to college. It’s not that bad.
The prices go down but the HOA fees go up. Because of those fees there are no real bargains to be had.
I see this so much in SoCal right now. No one wants to pay an HOA of $500+ on a low end 2-story wood frame complex where you can hear every noise from the neighboring units. Some communities I’ve looked at the prices are down over 15% in just one year.
Is it just me, or is it obvious that an entire generation knows nothing about rates? We will never go back down to rates in 2020.
The biggest issue in my area (the west) is the barrier of entry. When a condo can cost the same as a 3 bedroom, we have a fundamental issue. Condos are an entry point for the average folk to get into a home. Will they stay there, probably not. Point being, it costs so much to get into housing, where 4 bedroom 3 baths don’t cost much more. In my area, a condo costs 350-400k a 3 bedroom home 420k and a 4 bed 2 bath 430k and a 4 bed 3 bath 500k. It’s no wonder people can’t get into a home. The best news for my area is building is significant so you could enter into a 3 bed 2 bath home with a rate down.
A fundamental issue in housing is the cost of building (regulation), zoning, and the physical investment itself. The last part is important because for sometime, building a physical home wasn’t costly. We shifted to a tech sector where physical investment is now data centers. We are facing a energy crisis and water depending on area. When foreign investment dictates growth, there is a fundamental problem. Unless domestic investment reposition itself into housing (the same scale it was prior to GFC), it’s unlikely to expect any price change on a mass scale.
Wolf is doing a great job showing others the empirical evidence. Some communities are seeing lower prices however ones that shoe gains are also not building homes. Again a zoning and reg problem. Keep up the good work Wolfm
“Condos are an entry point for the average folk to get into a home.”
Condos can be very expensive, costing tens of millions of dollars, just like a house. The median condo in San Francisco costs $1.07 million. But they’re not out in the boonies. they’re in urban cores or along the shore in city centers, and if you want to buy something in that part of town, it’ll have to be a condo because they’re not building SFH there. Sure, there are entry level condos, just like there are entry level houses. And you can get condos that are smaller than a house (why would a single need a 2,800 sf house in the boonies? Why not a 900 sf condo with lots of amenities in the city center or along the beach with great views and walk to work?
I went from a condo valued at 485k to a home at 500k. My home is 2300sqft 4 bed 3 bath den too. My condo that I was in was a 2 bed 3 bathroom at 1250sqft. Location matters.
I’d like to think people could refrain from things they can’t afford, but DTI (debt to income) in today’s market tells another story. People are stretching once more all the way to 56% DTI.
@wolf – 900 sqft condo in big city might be ok for singles or childless couples. With a child that can walk, many are likely to feel the need for more space like maybe 1500 sqft or so. Thats what I heard from a few people i know and a realtor. A small backyard can be nice, but shared playground might work for some. I dont see too many of such units at an AFFORDABLE price in a big tech city.
Somehow families on most other continents manage to raise healthy kids is homes well under 1k sqft and with small yards. Heck, most baby boomers were raised that way and they turned out mostly fine.
“Rates will never……” the statement of never say never is true. Back in 2011, I refinanced my 5.8% mortgage down to 3.1%. At that time, the statement was everywhere “You will NEVER see rates this low again!” Fast forward to 2021, I bought a home at 2.75% 30 YR, with the option to do a 1.75% for 15 YR. And again, here we go, “we will NEVER see this again.”
My advice for people that feel “stuck” in this housing market is do what you want. You want. A home? Pay the money and move on. YOLO has a bad connotation for some reason, but there is no bigger truth than that. YOLO on this Earth, NOBODY knows what happens afterwards.
Meanwhile. SF housing sees bidding war with offers $1M over asking price. AI bubble in full swing. I see a pin in the not too distant future.
Bay area has at least 20,000+ ai boom multi-millionaires (from openai, anthopic, etc). They will “protect” the bay area market, no slowdown to expect in next few years.
Freddy,
Clickbait headline in the braindead real-estate-paid-for media written by AI and designed to titillate.
player,
Wait till the AI bubble implodes like the dotcom bubble imploded (Nasdaq Composite -78% in 2.5 years, with thousands of startups and bigger companies wiped out completely). It triggered a depression in the Bay Area.
This bubble explosion may be much worse. The last time we got fiber, but this time? Bupkis (nothing)!
About 20 years ago, I heard from a Bay Area resident after the Internet Bubble burst, the stock option holders were in at such low strike prices that they were still able to able raise cash by selling their shares, and were putting their proceeds into houses, and housing prices didn’t so down.
The lucky ones whose stocks and options still existed and whose companies survived. The thousands of companies that imploded and shut down left their stocks and stock options worthless and useless. They were worth zero.
Freddy you are crazy if you think AI will result in nothing for society. Have you even used chatgpt? Are we in a bubble? Yes. Is AI blown out of proportion and is everything happening right now highly unsustainable and likely to result in tears for nearly everyone? I’d say so. But is AI going to still change the world? Oh yes. You don’t have to buy into the hype but I’d encourage you to not be in denial about the power it could have just like anything…railroad, cars, cell phones, robotics, LED lights)
Blake,
It’s going to change the world alright.
The Google search now takes us to a cliff notes of the websites we would have glanced thru quickly.
🤣
That’d be nice. I’ve always wanted a reasonably priced condo in Sonoma.
“Wait till the AI bubble implodes”
It’s laughable hearing analysts on Bloomberg Surveillance every morning say this is so much different than the 2000 Dot-Com crash.
This time it’s different…….and these same analysts want people to give them their hard earned money to invest into these same AI companies. Rose-colored glasses I guess.
CA people are leaving.
AI is a problem not a solution. Chatbots will be behind paywalls. Ask openAI and anthropic. They not only are going public, they have set the stage for an income driven AI. Investors aren’t happy.
Then you have the AI mark to market earnings issue. When a dollar is counted as revenue for 5 companies with 1 point of sale, things break. Ask Microsoft. They aren’t very happy with open AI right now. In the short term, there’s a chance that we will see gains however; The likihood one of these giants falls is very high. EVs weren’t supported by grid infrastructure, so how is a building that will require refreshes every 2-3 years? That’s just scratching the surface. AI to investors will loose confidence soon enough. Price actions are showing it.
Where do you put money in if there will be a crash in 2 years? No one can time the market.
Thank you for another great post! As a southerner, that i the data I focus on. I think it’s interesting to look at the data on a per capita basis. I can not speak to the demographics of of the other 3 regions but the South has experienced very heathy population growth in recent years. I looked up the Souths population from the FED website and crossed with your graph here. It looks like we are at similar home sales today as we had back in 2013. When you look at the numbers, the population has increased 14%. On per capita basis, home sales are down 12%. We would need roughly 250,000 to 300,000 more home sales to be truly level where we were thirteen years ago. Another sign this market is cooling. Very slowly. Thank you again for all the work you put into these posts!
Tiny home (s) in the back yard, anybody.
More and more apts/ADUs are being okayed in more and more metros.
The local pols (who used zoning and code abuse to feather-bed the incumbent RE interests who back them) know that their voters are terminally pissed and the pols are starting to run scared.
It only took decades…
How does one septic this situation?
So many questions. Haha
/s
I may have posted this before(my memory ain’t what it used to be) but:
Saying inflation is 4% without taking into account the existing inflated price is like this:
Mrs. Powell says “You’re going to fast!!”
Jay says, “I’m only going 4% faster than I was!(speedometer reads 83mph and the limit is 55).
You need to learn the difference between “inflation” and “high prices.” There is no reason to discuss anything if you cannot keep those two apart.
High prices = high prices
Inflation = rate of change of prices in a specified time period.
That is exactly my point as exhibited by your Median price of existing SF family homes chart shows. The minuscule 2% rise from last year is insignificant when compared to the rise between 2013 and 2023.
Average home payments were historically and abnormally low during the 2012-2018 period and are just now returning to something close to their long term average. People are big mad about losing their super cheap housing (*not super cheap in a small number of very popular cities).
Since 2000 average annualized inflation has been 2.8%. There have been plenty of low inflation years to offset the COVID period.
2008 – 0.09%
2014 – 0.76%
2015 – 0.73%
Which is also the 100 year average
Those figures are from higher and higher bases, y-o-y calculations.
Yes, that is how math works. So? Doesn’t change the average, which is calculated by taking the total rise and distributing it evenly over all years.
Personally, I don’t think people like JPOW above can wait for home price increases to slow over many years to overcome the crazy, out of whack prices that persist. While a 6.5% mortgage is about historically average, this does not take into account the massive price increases. It’s simply amazing that the economy continues to grow despite all of potential building downsides. Will 2027 finally be the year that we lurch towards a recession? Who knows. I for one wonder if a political change this fall might be the catalyst that causes enormous uncertainty to entire the economy. Certainly, nobody appears to be worried about what’s soon to be $40T in debt and what might be 4.5% CPI in the next few months.
Ben,
An add on is that Jpow and others here waiting to buy are also much better informed than my cohort. We didn’t really think about the nuts and bolts of buying as ‘real wages’ were higher, even in the 70s. I remember my good friend had a job in a pulp mill. Normal job for the time, but today it would thought of as incredible for a blue collar family. He complained to his Dad he could not afford to buy a home so his Dad recommended he buy some land and start building. He did it that way. I just saved a small down payment and got into a shack….rebuilt it and did it again. Started the house purchase at age 23, the kids at age 24. However, we were poor compared to today’s lifestyles. Drove junk. Never never ate out. Never made payments on anything. Just got by until the magic moment of no more mortgage.
The point is that there is ‘no best time’ to buy. You climb on the tortoise for the slow ride into the future and try and enjoy the days as they pass. Picnics and local camping instead of vacations….. family meal menus based on sales, absolutely no dining out unless it is a very special occasion. etc etc. Then one day you will be set up because you own a house free and clear, provided of course you live in an area where property taxes are realistic.
Sure, it might be cheaper to rent. Now. But when you are retired do you want to still be paying comparable rents? You’ll need a huge income stream to make that work. It’s kind of a “pay me now or pay me later” situation.
“The point is that there is ‘no best time’ to buy”
This is a very bad advise. It is much cheaper to rent home than buying and home prices are falling a lot.
I have seen instances where people have bought homes in very desirable neighborhood at 40% from its peak.
“Picnics and local camping instead of vacations….. family meal menus based on sales, absolutely no dining out unless it is a very special occasion. etc etc. Then one day you will be set up because you own a house free and clear”
We all have different visions of the good life. Have you actually tried to sell this logic to anyone under 50?
William, I’m under 35 and live exactly like this, as do many others just like myself who are prioritizing FIRE (financial independence, retire early)
As you correctly said, we all have different versions of the good life, and for some of us it feels better operating in this more frugal way. Not everyone is concerned about keeping up with the Joneses, all depends on priorities.
I am in my 40s, and almost everyone in my circle (except for a few folks who inherited 100+ acres of land that cost pennies in 1960s, but made them a fortune overnight recently) live this exact lifestyle. Just came back from another camping trip with a few friends for the 4th – and with how bad the service became after covid even in more expensive chain hotels, I don’t feel we are missing anything.
Cars are to move from Point A to Point B. As long as it is safe and reliable, nobody cares it is 8 years old with 120k miles on it. 3br 3ba house in an okay 7/10 school district is more than enough. If we fly on our dime, you can bet it will be Economy. Kids don’t need a 90k/year undergrad degree unless they have a clear plan on how to cover it with grants/scholarships and how to pay the debt (spoiler: they don’t).
I am still working on cutting on some *toys* though. Hobbies can be expensive af.
Much to my surprise, the $40 tril debt doesn’t seem to be fazing the big money people, the latest 10 year treasury auction was quite successful.
Big money people don’t know where to stash their cash, and their treasuries will become huge losses when the SHTF later on our debt.
And the relatively high interest rates the Treasury is paying for that debt is accelerating debt growth.
The only way out of the debt problem is to inflate-away the debt.
So, big inflation is coming. Hold on to your tangible assets !
So wait how will that work?
Will the U.S. be like Russia and just refuse to pay its debts?
Like FU world! We’re the currency of choice in the world and you must all use us, but we’re not gonna pay back our debts.
Cmon man. Never gonna happen. We’re far too successful
Inflating away the debt isn’t non-payment of the debt.
The idea is, if we owe 40T, one path to erode that debt is by inflating the currency, and in doing so making 40T debt worth less than before. For example, if you owed $100 in 1960, that would have been a much larger portion of an average salary compared to a $100 debt today. Same happens with government debt. We don’t even have to be running a balanced budget, could still be operating at a deficit, and so long as the inflation is larger than the percentage growth of total debt each year, the real cost of that debt would still be lower despite being a larger number from the year before.
The economy has been propelled by a large injection of new money, the draining of the O/N repo facility, and the activation of bank-held savings into the nonbanks, e.g., MMMF growth.
The banks have reversed decades of otherwise idle money.
Nearly 50% of adults ages 18 to 29 and a third of all young adults under 35 now live with their parents. Driven by soaring housing costs—with national median home prices near $430,000—living at home is a widespread, employed demographic normalizing as a strategic financial choice.The landscape of young adults (kids/young adults under 30) living with their parents has shifted dramatically over the last few years, driven by major economic realities:High Co-Residence Rates: According to recent Federal Reserve data, 49% of adults aged 18 to 29 live with their parents. Among slightly older demographics, about 1 in 3 adults under 35 live at home. “How long has this been going on?” Repeat the chorus line to this 1974 classic song. I see communal living with 3 generations under roof trending for decades to come. The America Dream juice is no longer worth the squeeze. Unselfish living, man used to only need a place to shit, shave, and shower. Demand Destruction in Denver is constantly killing off bars and restaurants. The housing $FOMO peaked 4 years ago this summer.
I know, there are all kinds of surveys about this. So here is the data from Pew going back to 1900, of adults aged 25-34 living with their parents, through 2023, based on Pew’s analysis of the data from 10-year Census and from the Census Bureau’s American Community Survey. What it shows is that it reverted to historic trend of 1940 and before. But boomer were freedom-lovers and rebels, and we couldn’t be tied down in our parents’ home and had to get the hell out at an early age no matter what, including me and ALL my friends. We lived in abject poverty but gloriously away from home, and rebelled against everything. The younger generations that grew up with everything and didn’t have to rebel against anything weren’t enamored with that lifestyle though, it seems. So the ratio has returned to the pre-boomer levels:
https://www.pewresearch.org/short-reads/2025/04/17/the-shares-of-young-adults-living-with-parents-vary-widely-across-the-us/
Yes, Pew has the best data on this, and it shows that this is primarily a story of demographic change rather than an economic one.
The areas with the highest rates of adults living at home have the highest concentration of Latino householders, but are typically relatively low cost housing areas. For example, the Brownsville + McAllen MSAs have some of the highest concentrations of kids living alone while at the same time among the cheapest housing in the country.
Your comment cracked me up. So true, couldn’t wait to get out, and yes, I struggled too! Great life lessons, well said.
Just a single year of true 0% nominal price growth for homes would *greatly* enhance national affordability. We are so close to a 0% growth rate right now, that the Fed could *easily* make that happen if they wanted to, without any major negative effect (though admittedly minor effect).
We just bought a home in April this year. Honestly I was so stressed about a crash for so many years and now I’m honestly happier than I have been in all those years I was worried about losing money. Would we got a nicer house had we bought 4 years ago? Absolutely. But are we a million times happier being in a home that fits our budget and has a yard for our kids to run around in and entertain guests in? Yes.
I read too much fear blogging. I wish I would have bought years ago. You only live once.
The recent passing of the bipartisan housing bill, lifted some significant restrictions on manufactured housing (steel subframe, etc.). This may lead some innovation in the field, lower building costs and greater acceptance of manufactured housing. All of which will help increases housing supply.
Wolf – your thoughts on the new housing law???
Yes, I’ve always wondered why homes are still being built by hand one piece at a time, rather than via mass-production of large standardized components that are then assembled on location. This is being done already, but it’s also getting blocked left and right. They’re building homes today like they built cars before the Model T came along.
There’s some stupid stuff too. For example, I heard that to build city or state subsidized affordable multifamily housing in San Francisco, the developer has to use local union labor, which then eliminates the use of components that have been manufactured at a lower cost somewhere else. Which is in part why it costs more to build affordable housing units than market-based units. I don’t know how much of that is accurate, but that’s how I remember the story.
Cities, run by NIMBYs, have imposed lots of restrictions on development of housing so that a “housing shortage” gets manufactured instead of housing, assuring that prices of NIMBY-owned homes continue to rise. NIMBYs are the worst despicable scourge of the self-serving housing market. The new federal law won’t change any of those local barriers, though the incentives in the law might whittle away at the barriers over time.
Take it a step further and ask why were essentially the last country in the world that primarily builds single family housing rather than much more efficient multi-family.
I get the logic of the initial urban layouts in the 20th century, but not why we’re still pursuing exurban sprawl in a time where people are regularly living to 90+ and labor is becoming more scarce due to population decline. All the time you hear people talking about how residential plumbers can make high incomes and somehow missing that this is because there is coming out of their pocket, not a good use of societal resources, and directly the result of our housing model.
@Wolf Thanks for the historic young adults living at home chart.
As for union labor in CA, with rare exceptions if a government in CA is involved with anything they will use expensive union labor.
The higher cost union labor is just one of the reasons for the high cost of government projects in CA since every time a big projects is started ALL the politically connected people that want a return on their investment of all the “bribes” they pay (that we call “perfectly legal campaign contributions” in CA) will get paid (the “bullet train” money sucking project that will never connect SF and LA is a good example),
P.S. The “million dollar a unit” “affordable housing almost always costs much much more since they are good in CA at paying out of different buckets and like to hide the true cost (aka hide all the waste rarely do they include the cost of the land in the cost of an affordable housing unit).
“The housing market – buyers, sellers, and everyone in between – needs to get used to these mortgage rates.”
Why exactly? They were well below that lever for 13 years before 2022.
Because the 13 years of QE and mega QE where the Fed bought trillions of dollars of MBS is history. The Fed keeps shedding its MBS even today. it will get rid of all of them. The Fed is leaving the mortgage market to its own devices = higher mortgage rates.