Supercore services inflation surged, after taking off last fall. And AI data center demand drives electricity inflation.
By Wolf Richter for WOLF STREET.
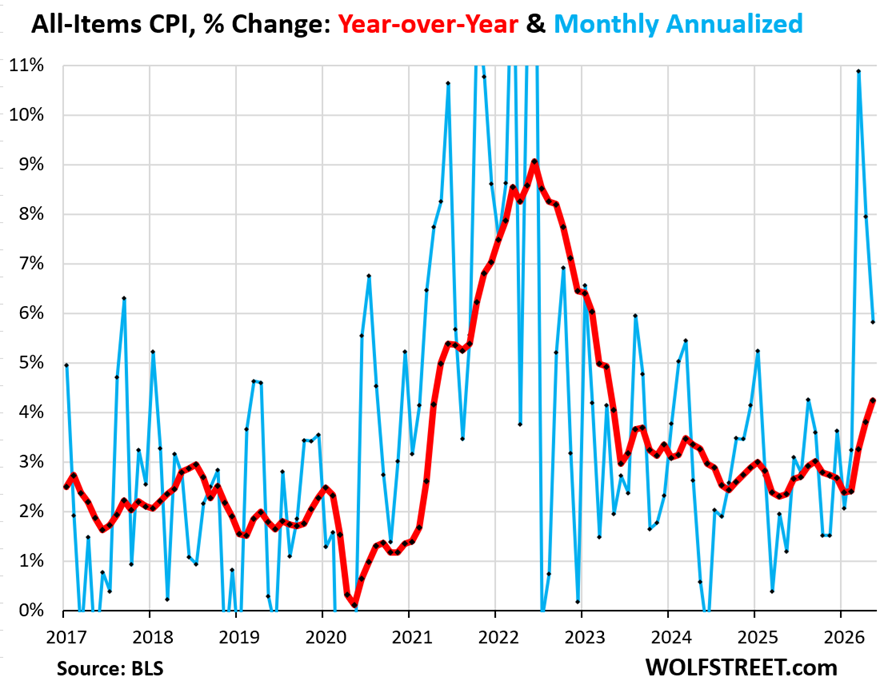
The all-items CPI jumped by 0.47% seasonally adjusted in May from April (+5.6% annualized), on top of the two majestic spikes in the prior two months (blue line in the chart).
CPI inflation got hit for the third month by the gasoline price spike. Electricity prices continued their spike, driven by structural demand from AI data centers. And inflation in supercore services (which exclude energy services and housing) has taken off – the worst month-to-month surge in over two years, and has been accelerating since last fall. But food prices, after the spike in April, added only a little. And goods prices without food and energy dipped.
Year-over-year, the all-items CPI jumped by 4.25%, the worst inflation reading since April 2023, according to data from the Bureau of Labor Statistics today (red in the chart).
Negative “real” Treasury yields up to 5 years.
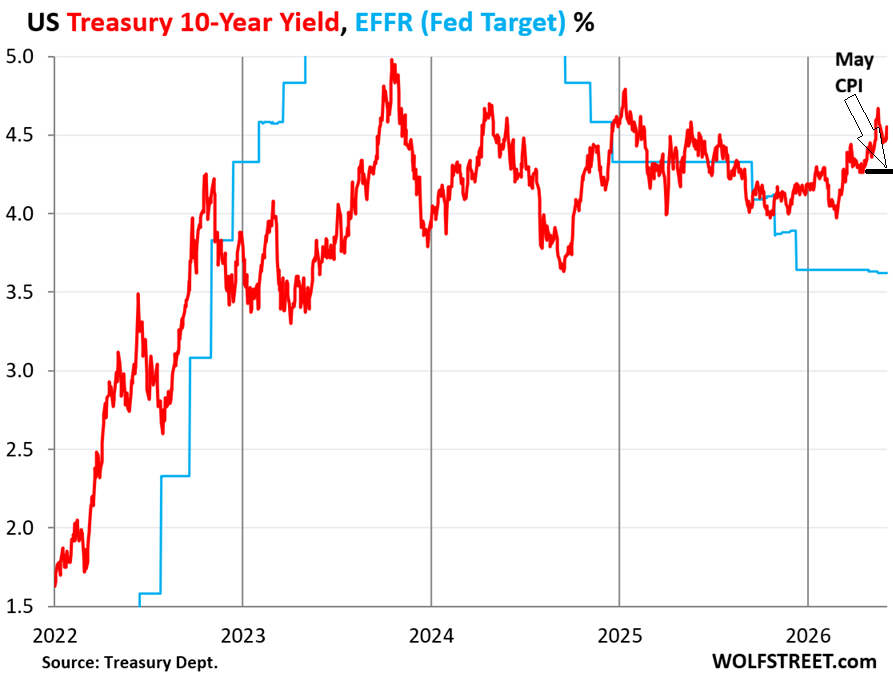
The year-over-year increase of CPI had blown past the Federal Reserve’s policy interest rates (3.5% to 3.75%) a month earlier. With these policy rates, the Fed targets the Effective Federal Funds Rate (EFFR, blue line in the chart below), which is an overnight rate between banks.
And now, CPI, inflation at 4.25%, blew by the 2-year Treasury yield (4.16%) and the 3-year Treasury yield (4.21%). All those yields have turned negative in real terms (after inflation).
To find Treasury yields that are not negative in real terms, you can go out on the curve to the five-year Treasury yield (4.28%) and beyond.
CPI inflation for May (short bold black line in the chart) is closing in on the 10-year Treasury yield (4.55%). This puts even long-term Treasury yields at risk of turning negative in real terms.
The 10-year Treasury yield (red line in the chart) has come up over the past three months, but not nearly enough, and the spread between it and CPI inflation has narrowed to just 30 basis points, indicating that the bond market still believes that at least part of this bout of inflation will be “transitory,” so to Powell-speak.
Interest rates that are negative or very low in real terms are stimulative to the economy and inflation, providing further fodder for inflation to thrive.
Inflation in services.
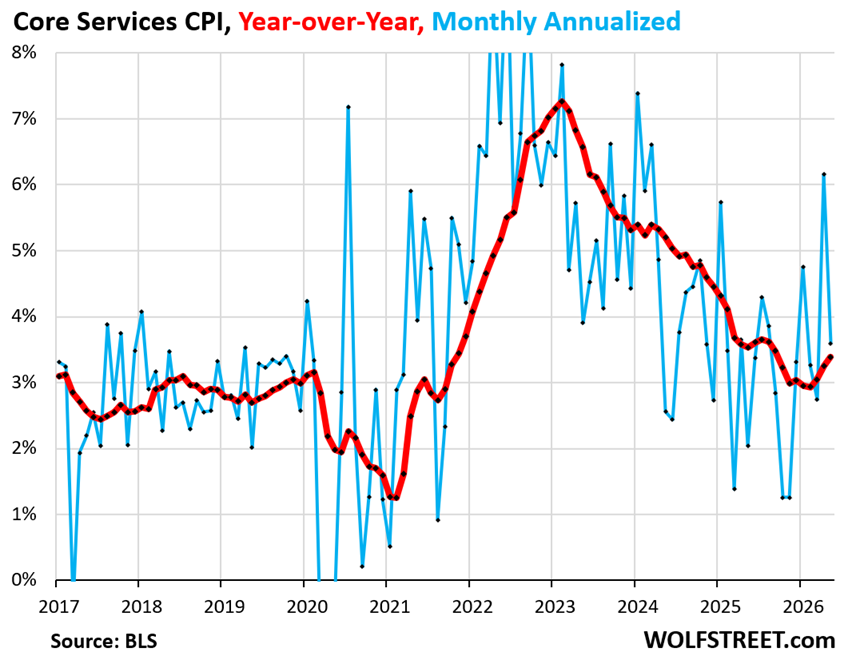
The core services CPI, which excludes energy services such as electricity, rose by 0.30% (+3.6% annualized) in May from April, after the spike in the prior month (blue in the chart below).
Year-over-year, it rose by 3.4%, worst since September (red line).
What held down core services CPI were the housing CPIs, rent and Owners Equivalent of Rent (OER).
But the “supercore” services CPI – core services without rent and OER – has been accelerating since last fall and in May jumped by the most since March 2024 (more in a moment).
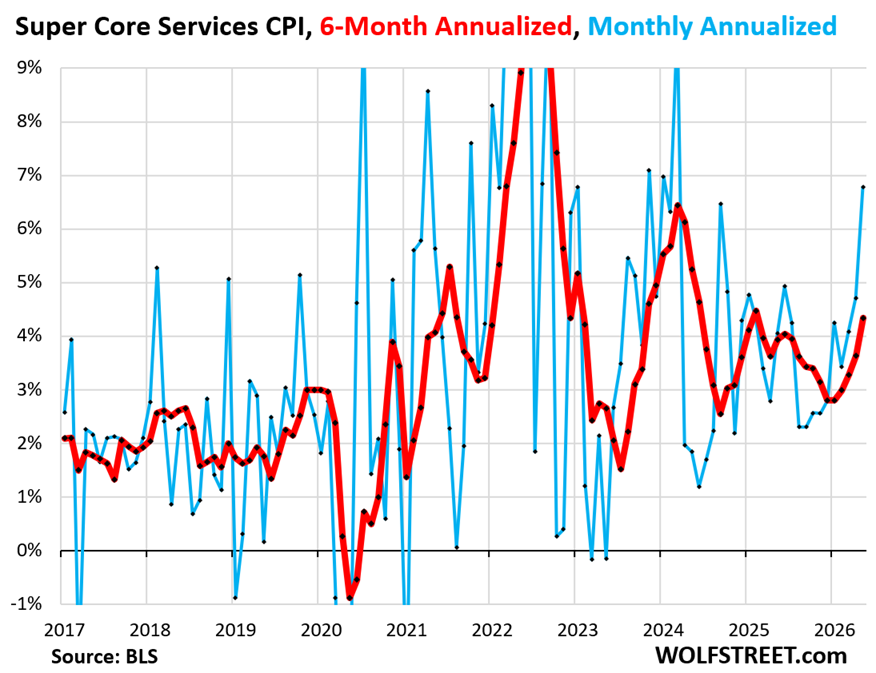
Supercore services inflation has taken off. Back when housing inflation was very high, Powell had referenced supercore services inflation as an important indicator of where core inflation was headed. At the time, supercore services inflation was cooling rapidly, and he used that cooling as one of the factors in rationalizing the rate cuts, while the housing inflation measures remained hot. Now it’s the opposite.
The “supercore” services CPI spiked by 0.55% in May from April (+6.8%) annualized, the worst increase since March 2024. And it has been accelerating since last fall.
The six-month supercore services CPI, which shows this recent trend, spiked by 4.3% annualized (red line).
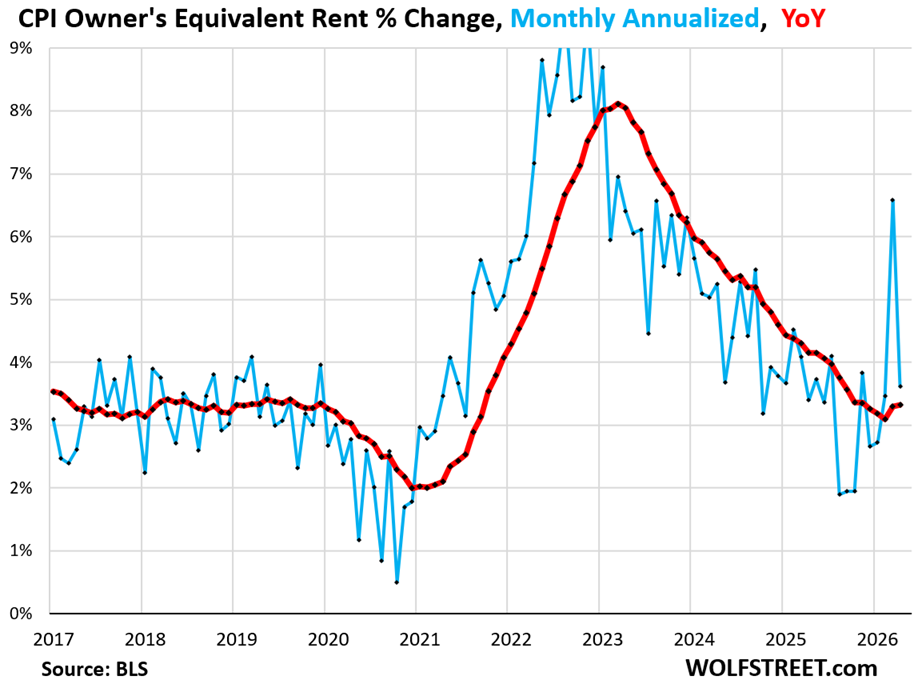
The CPI for Owners’ equivalent of rent (OER) rose by 0.30% (+3.6% annualized) in May after the spike in April that had corrected for part of the distortions in September, October, and November last year.
Year-over-year, it accelerated to 3.3%. This is the range that prevailed before the pandemic (red line).
The CPI for OER weighs 25.9% in the all-items CPI. Combined, rent and OER weigh 33.6% of the all-items CPI.
But OER is deeply flawed as a measure of inflation that homeowners face. It tracks what a large panel of homeowners think their home would rent for; it’s a stand-in for costs that homeowners actually face, such as homeowner’s insurance, property taxes, HOA fees, repairs and maintenance, which are not included in CPI, but these costs have been surging. OER is a fundamentally flawed metric in the CPI and should be replaced by the actual costs homeowners face.
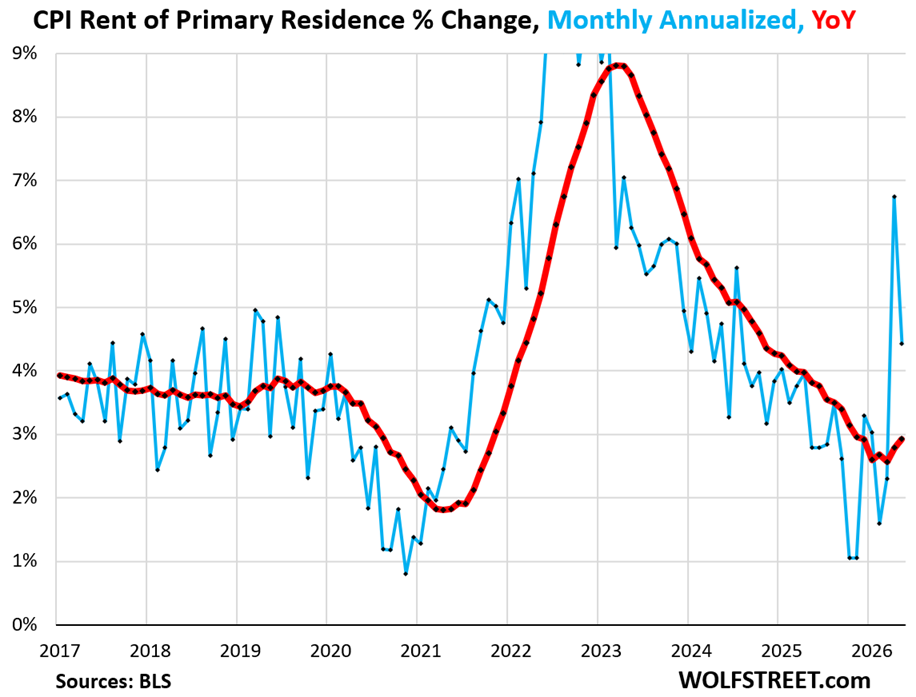
The CPI for rent of primary residence rose by 0.36% in May from April (+4.4% annualized), after the spike in April that had corrected for part of the distortions in September, October, and November. The sharp increase in May appears to correct for the rest of the distortions last fall.
Year-over-year, the CPI for rent rose by 2.9%, the biggest increase since December.
The CPI for rent of primary residence weighs 7.7% in the all-items CPI. It is mostly based on renewal rents paid by tenants; only a small portion is based on rents from newly signed leases (differs from “asking rents,” which reflect advertised rents of vacant units).
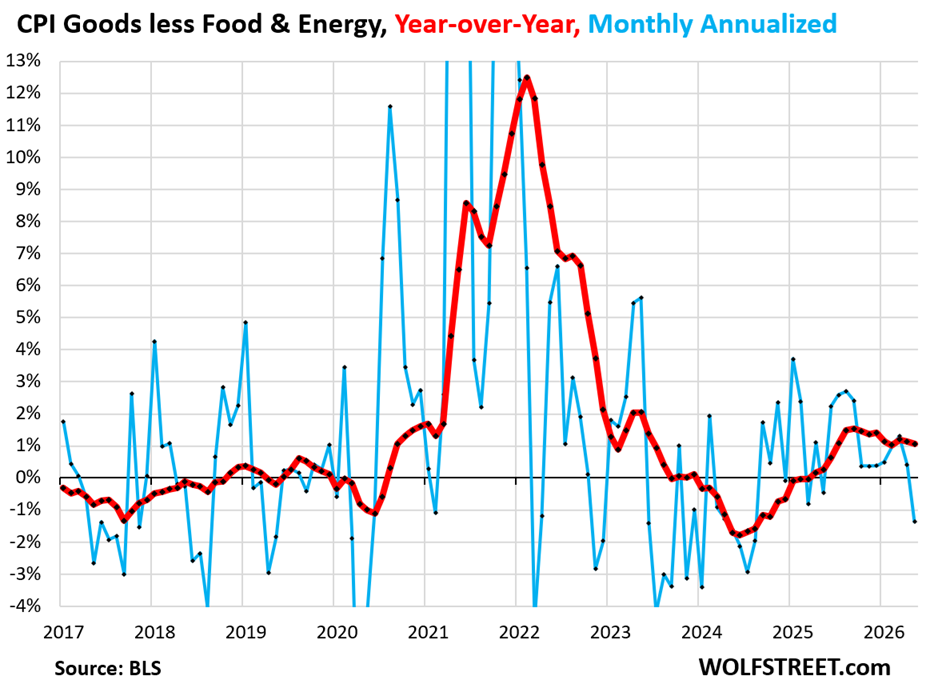
The “core goods” CPI (all goods except food & energy) dipped by 0.1% in May from April. This reduced the year-over-year increase to 1.1%.
The CPI for new and used vehicle prices, the biggest sub-category of goods, dipped a little month-to-month and year-over-year.
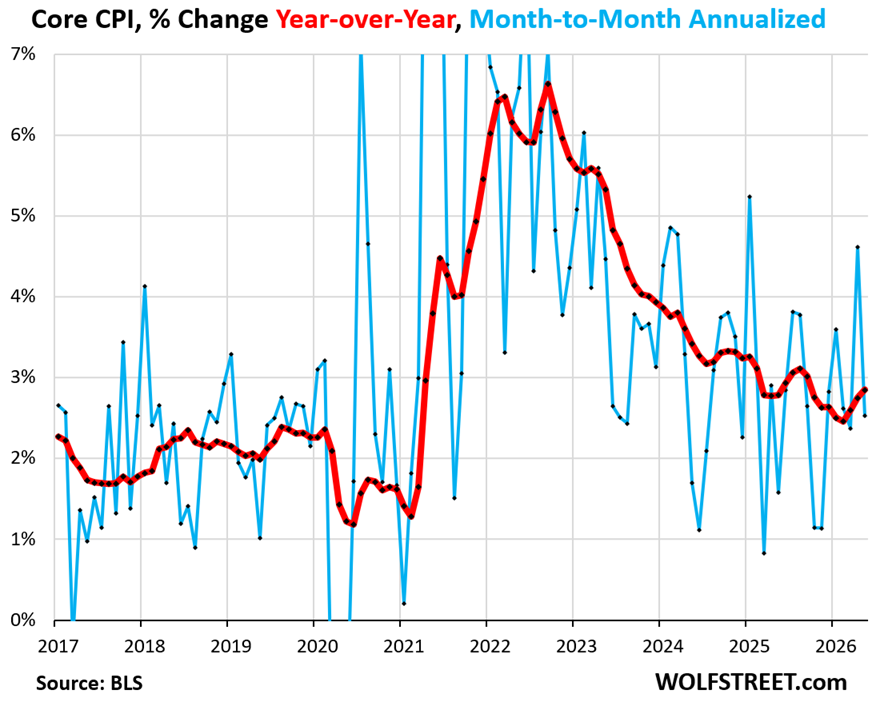
The “core” CPI, which excludes food and energy prices, rose by 0.21% (+2.5% annualized), in May, after the jump in the prior month.
Year-over-year, it accelerated to +2.9%, the third month in a row of acceleration and the worst increase since September (red line).
The core CPI is dominated by the core services CPI, but also includes all goods except food and energy goods.
Energy inflation: gasoline and electricity.
The CPI for energy spiked by 3.9% in May from April and by 23.0% year-over-year. Most components surged (motor fuels, electricity, other fuels), but natural gas to the home dipped.
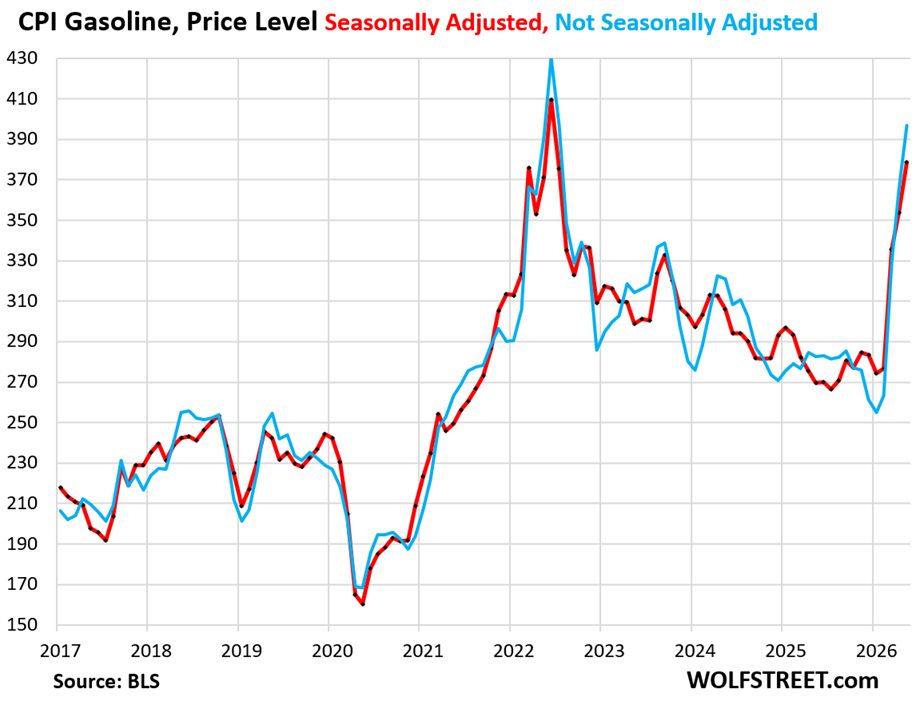
The CPI for gasoline spiked by another 7.0% in May, seasonally adjusted, and by 40.5% year-over-year.
The price level in May approached the peak of the prior spike of inflation in mid-2022. The CPI for gasoline of all types weighs 3.6% of the all-items CPI.
The chart shows the price level of the gasoline CPI, and not the percentage change, seasonally adjusted (red) and not seasonally adjusted (blue).
The CPI for electricity spiked by 0.63% in May from March, on top of the spike in April. Year-over-year, it jumped by 5.9%.
Data center demand has been pressuring electricity prices for years. Since the beginning of 2021, the CPI for electricity has surged by 43%.
The CPI for electricity weighs 2.5% in the all-items CPI.
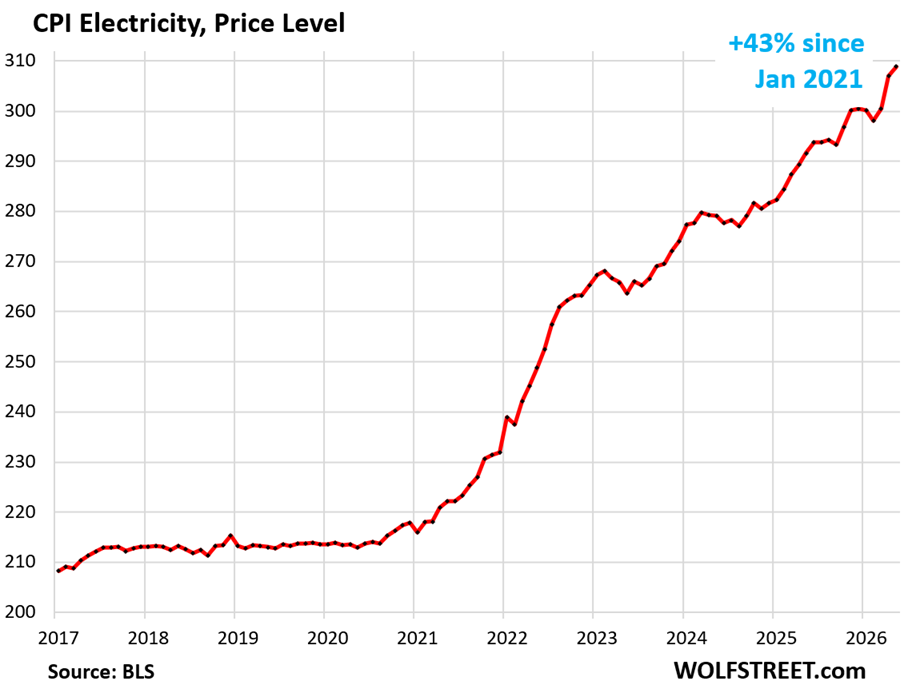
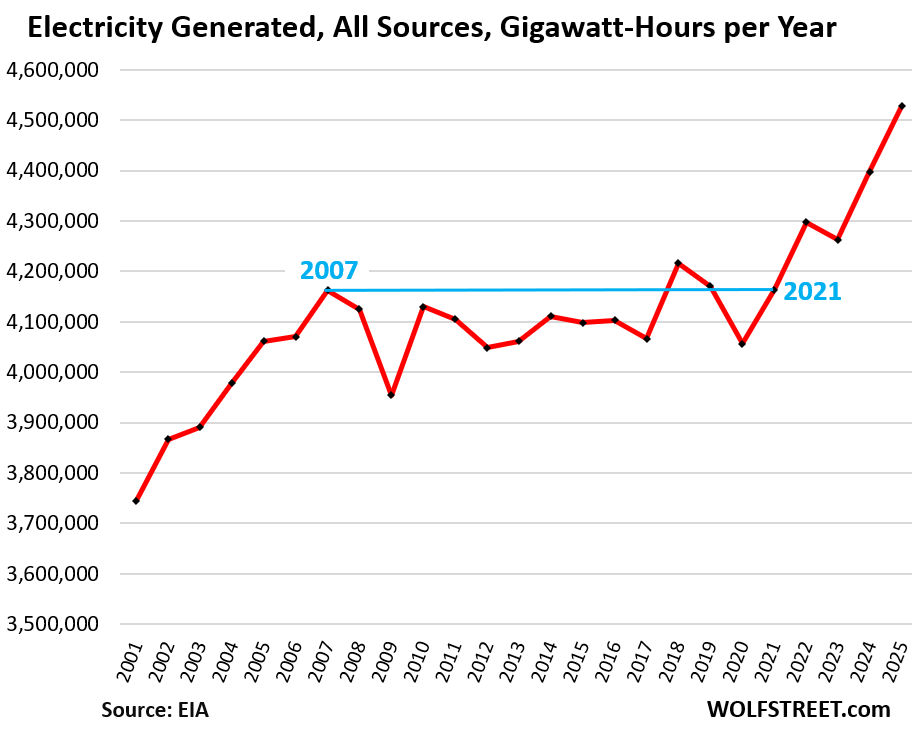
Demand from data centers has been increasing faster than power plants could be built, and supplying sufficient power to data centers is one of the bottlenecks the AI industry has to deal with. Electricity prices for households are regulated and generally don’t fall back, and price increases are essentially permanent, to be followed by more price increases — unlike gasoline prices that spike and plunge.
The surge of demand for electricity started in 2021, after remaining roughly flat for 15 years. No one was ready for this (my annual analysis):
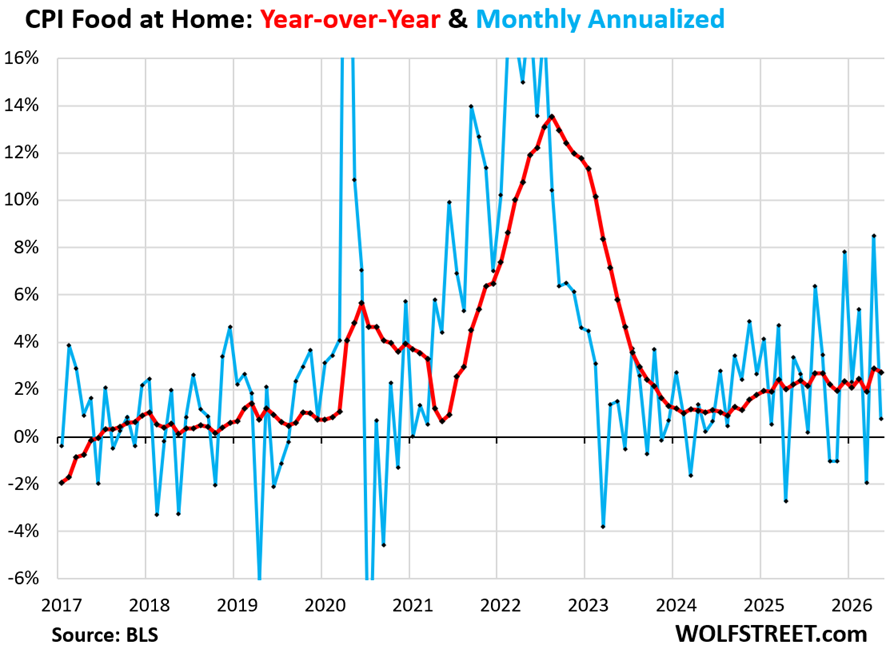
The CPI for food at home ticked up by 0.1% in May from April, after the spike in the prior month.
Year-over-year, food inflation rose by 2.7%, which was slightly less than in the prior month, which had been the worst increase since August 2023 (red line).
Enjoy reading WOLF STREET and want to support it? You can donate. I appreciate it immensely. Click on the mug to find out how:

![]()
The million dollar question is this – will Mr. Warsh push the panic button?
He won’t. There won’t be a rate hike at the June meeting. There may be one later this year. The Fed, including Warsh, will prepare markets for a rate hike long in advance.
Before any rate hike the Federal Reserve FOMC will first prepare the population with plenty of “gaslighting” that the inflation really isn’t real after stripping out the necessities of modern survival.
Ah, memories of 2021.
Six months of ever-stronger statements and warnings of rate hikes, as inflation spiraled over 8%.
And they were still doing QE until March 2022.
It’s all intentional. The entity responsible for preventing inflation is actively stoking it. The fire department has been taken over by fire bugs.
On the positive side the cease-fire is holding and according to Truth Social the ink is almost dry on the peace deal and days away from energy crisis being back page news.
Was there supposed to be a sarc tag on that post?
Inflation driven by the Iranian war is just getting started. Most Americans are still in denial about this simple fact.
This aged well. Hope it was sarcasm, otherwise it’s delusional cope. 12 hours later:
“Trump warns the US will seize key Iranian oil export hub Kharg Island…[h]e also threatened to take control of Iran’s oil and gas markets, after Tehran and US traded strikes overnight”
“Trump announces more strikes against Iran, potential action to take over key Iranian stronghold”
XD
Houston we have a problem!
Like most problem this is transitory! :-)
As is life.
“In the long run, we are all dead” – John Maynard Keynes
Well, we all know that CPI follows the price of oil / gasoline. And that CPI Gasoline, Price Level graph certainly tells us what direction & how fast CPI is heading.
As oil prices may fall to a previous low(er) level, other prices almost never do. Most rises are sticky (insurance premiums never go down). That can be explained by either greed (sure), currency debasement (surer) or both (surest).
The many years of QE and ZIRP, financial repression without capital controls caused high inflation in stocks and housing. That inflation was not captured by official statistics. That latent inflation is not contained any more and is leaking out in to the wider economy.
This CPI here is “consumer” price inflation.
“Asset price” inflation is captured with different indices. For example, for “house price” inflation, you can look at my housing charts. For “stock price” inflation, you can look at a chart of the S&P 500, but that’s more complicated because earnings rose too, so which part is stock price inflation, and which part is to due to earnings isn’t always easy to sort out. For wage inflation, you can look at wage charts. For grade inflation, you can look at…. Everything in its place
Terrifying article. Categories different where I live, but gist is the same as rising energy costs and supply disruptions permeate everything. As I read through details/charts I realized that our household has always just sucked it up to mitigate reality. Screwed by returns, just save more. Spend less. Services expensive, then do more ourselves or postpone whatever. Gas prices rising? Drive only when necessary. Stuff like that.
And that is a recipe for stagflation.
Just bought my fishing licenses. Will fill freezer with salmon and cod next month. Garden looking good and will fill the other freezer with produce. Do some canning. Woodsheds full. Rural solutions. If we lived elsewhere I guess we would just cut back more. Downsize.
This is getting real. Thanks for the summation. It puts a picture to the headlines.
The other way of dealing with inflation is to spend more NOW before it gets even more expensive — which fuels demand and feeds inflation even more.
And there’s another way of dealing with higher prices: switch vendors when possible. Comcast just jacked up our broadband monthly fee from $40 to $90. But that won’t be inflation because I’m not paying it because I’m switching to a service that costs $35. We have fiber to the house (Sonic), co-ax to the house (Comcast), and two 5G suppliers (AT&T and Verizon). So I’m not a sitting duck. And I have switched twice before. But there are things that are difficult to switch.
I don’t have a TV. No cable. No Internet connection. I do have a smart phone. I live 2 blocks from Bart and work 2 blocks from Bart. I walk to the grocery store or to downtown where I live. I have to drive my car once every couple of weeks to make sure my battery does not die from lack of driving. No subscriptions of any kind. No social media. One credit card which I rarely use. I’m outside almost all of my non working hours. I feel like the luckiest guy in the world.
Where there is a will there is a way.
Another approach: Buy a car NOW before prices go up by thousands of dollars (and for those who finance, interest rates too!)
The Toyota Corolla hybrid is the most insane deal on the market for people who want to get or stay rich, IMO.
Trade $25k-$26k of your rapidly depreciating US dollars for something you can over-maintain and get the next 20 years or 300k miles relatively trouble free. One of the most reliable engines in history matched with the most reliable transmission in history, cheap little tires, and the assurance of spare parts being available well into the 2040s if you need them. Meanwhile, it gets 50mpg to insulate you from future energy price inflation. It’s worth bearing in mind that during the lifetime of this car you’ll eventually be paying $20/gallon.
Lock in your costs now because these prices will seem like something out of antiquity seven or eight years from now.
The only better non-paper asset you can spend your money on now is solar panels. They are dirt cheap compared to the price of electricity, which is about to triple due to data centers.
like health insurance.
Exactly. That’s one of the toughest nuts to crack for consumers.
Health insurance/health care isn’t a tough nut to crack at all. Just do like I do:
Don’t participate. Get sick? You either take some tussin and live or you take some tussin and die. I’ve started developing some severe health issues the past few months. I’m ignoring them as much as I can. I’m down 30lbs in 3 months time and have never looked better. I might actually expire leaving a (somewhat) pretty corpse. Maybe prettier is a better way of describing it. At least it’ll save me from living in the brave new world in store for us.
(I’m only kinda joking.)
Good going Paul,perhaps add a deer or two to the freezer,perhaps also some chickens for eggs?
“The core services CPI, which excludes energy services such as electricity”
Electricity has been near vertical. The utilities never lower the cost of electricity.
Electricity CPI has its own chart in this article.
Electricity is part of the energy CPI.
“The utilities never lower the cost of electricity.”
Correct. Read the article 🤣
Gulf action back on…bonds resume sell off overnight. Ten year at 4.66+ will hammer stocks if this war of choice continues.
Yes Wolf, I did read it. My point being “core” things should include electric. Electricity is the very definition of “But there are things that are difficult to switch.” And I live 100% off grid for electric and consume very little Propane but i feel for those that rely on grid electric like energy junkies.
I see.
So more rate cuts? Isn’t raging inflation the best way weaseling out the debt burden?
What are the bond buyers thinking? 30 year rate is still just 5%.
To sum up the Fed meeting next week. Core and Trim is the way we WIN. (Whip Inflation Now!).
G. Ford
Well yes if one assumes that the past is prolo0gue
This administration says they “love the inflation”.
In comparison, Gerald Ford was some kind of obsessive uber-hawk. Just imagine our future, if the late 70s were as bad as they were.
Expectation by 6/17/26
Rate Hike 16.5%
Steady ⚪81.5%
Rate Cut 2.1%
Source: Atlanta Fed 6/8/26
That’s for the June meeting. No one is expecting a rate change at the June meeting. What you’re citing is a calculated figure based on options prices. From the Atlanta Fed:
“The Market Probability Tracker estimates probability distributions implied by the prices of options from the Chicago Mercantile Exchange that reference the three-month compounded average Secured Overnight Financing Rate (SOFR). SOFR, published by the Federal Reserve Bank of New York, broadly measures the cost of overnight (one-day) loans collateralized with Treasury securities in the repurchase agreement, or repo, market. Because the New York Fed’s Open Market Trading Desk implements monetary policy through repo market transactions, we can use the estimated distributions to make inferences about the market’s assessment of future target ranges that the Federal Open Market Committee sets.”
I tend to use the CBOE’s Fedwatch tool, and look about 6-12 months out. This irons out the fluctuations in monthly estimates and tells us what is important anyway – the expected direction.
Perhaps the Fed will raise rates which seems like an absurd decisiom
Somehow I’m the irrational one because I think it’s better to put an extra 1.4K into a car payment (14% loan) than SpaceX IPO. It’s the only way to keep up with inflation, I’m told.
This is not hard. If you are not prepared, raise cash, pay off debt and/or split it on ultrashort tips and short treasuries to hedge between inflation, deflation, and interest rate risk. I hope they will have time to prepare to take a punch. Worst case, they’ll be prepared for when we do have declines, which is normal.
The goal is to not be forced to sell from income volatility. Do not expect COVID checks – either we have the guys who don’t believe in handouts in charge or the divided government with a pissed off and mercurial executive who can’t run for reelection and treats politics like professional wrestling. We FA because dude looked like a lady, now we FO.
Nate. Thanks. That comment gave me a moment of zen when I needed it.
Assets are nominal!!! Amazing that people haven’t connected that holding 100% USD denominated assets (bonds, stocks, whatever) at this point is a huge risk. No I’m not a crypto shill (own zero). There are global markets that are starting to look attractive (not just on valuation, but also net forex).
How are stocks nominal?
Stocks are probably the most inflation resistant asset (except specific inflation resistant assets like TIPS). The reason is that for businesses IN THE LONG RUN both the inputs (labor, raw materials) and outputs (finished goods and services) are subject to inflation. If the price of inputs rise, they raise the price of their outputs.
Sure this is the 40,000 foot view and is a generalization that can have all sorts of caveats when viewed closer (especially in the short term), but in general, no other asset handles high inflation better than stocks.
What businesses hate is disinflation. That is because it is hard for them to compete in a disinflationary environment when one of their primary inputs is labor wages. Labor generally doesn’t like wage cuts even it keeps up with (dis)inflation.
Over time, businesses handle inflation just fine. If their inputs increase by 5% per year, it is a good bet that over time their outputs will increase by 5% per year.
I get what you’re saying, but the issue is that when price increases outrun wage increases, consumers can only buy fewer goods and services. So in the 1970s for example, when consumers suddenly had to pay triple for energy, that came out of what they could spend on everybody else’s products and services, putting those industries into recession and putting people out of work.
There is always a lag in the time it takes various businesses to raise their prices to account for input costs, and the time it takes businesses to give their employees raises (or the employees to switch employers). Wage takers are always the last to see the price of what they sell, labor, increase when governments enact inflationary policies. If prices rise 5%, for example, and wages don’t rise 5% until a year later, then workers have to buy (or save) 5% less. An immediate jolt to the input costs of everything (energy) has the potential to create such a condition. And then it can compound year after year as inflation problems go unaddressed.
Try to start banking with a credit union.
I remember when rates on car loans were 2%! Sometimes 0%!
Could be a bold choice when they are not FDIC insured, and are lending your money out at low rates to borrowers, some of whom could not meet the mandated criteria banks are required to meet, which is how they ended up at the credit union.
Recall that the S&L crisis of the 1980s occurred after a run-up in interest rates, which is the scenario we can all foresee being likely in the future. Since the 1990s, the new name for Savings & Loan is Credit Union.
Bold? Lol
The have credit union insurance just like fdic.
Bold is sky diving or investing in a leveraged etf. It’s def not bold to be at the credit union.
I bought a house with an interest rate of 14.5 pct in the passionate throws of the nesting insrinct
The better question is how in the world does a secured loan run 14.5%. Is your credit rating even a positive number?
They are talking about the early to mid 1980s, a time when another Republican president let deficits run wild.
ROCKET FUEL!!
In this article you stated that the spike in OER in April corrected for PART of the distortions in September, October, and November last year. If you combined the remaining distortions from that, plus the under-reporting of the costs for healthcare, by approximately what percent would you say the current CPI inflation is being under-reported?
The fundamental issue with OER isn’t how much of the distortions of last fall remain uncorrected, but that it doesn’t represent the inflation homeowners face. OER should be replaced by CPIs for HOA fees, homeowners insurance costs, property taxes, and repair and maintenance costs (they’re now not included in CPI). And the combined weight of those four items should be reduced.
The health insurance CPI is a huge mess, and the method needs to be scuttled. But health insurance only weighs 0.8% in CPI, so it doesn’t have a big impact. But it has been negative year-over-year for the past five months, which is just a joke and a scandal at the same time.
When a homeowner is asked by the survey how much they would rent their home for, wouldn’t/shouldn’t that homeowner include all the expenses that rent would cover, which would include HOA fees, homeowners insurance costs, property taxes, and repair and maintenance costs? I would think anyone who owns rental properties always includes these expenses in calculating how much they need to rent the properties for.
That would have been my assumption too. But that’s not the case. OER tracks the rent CPI fairly closely. Seems, homeowners look at rents around them to figure out what their home could rent for. So it’s just sort of a rent figure.
People who rent properties rent for whatever the market will offer them.
Just because a landlord has a mortgage (vs no mortgage) or hires a handyman (instead of doing his own repairs) doesn’t magically make the house worth 5x as much to tenants.
Please explain Wolfe, how it is that health care costs 18% of GDP, yet health insurance only weighs 0.8% in CPI. Appreciate that gdp and cpi measure two entirely different facets of economy, and that other medical costs are surely included in other info inputs to cpi, but suggests….based on no research I admit…….that total consumer medical expenses as a % of cpi may be underloaded, possibly considerably so.
1. CPI only measures what CONSUMERS are paying for. Consumers are NOT paying for all of the healthcare spending. Businesses and governments are paying a lot too, especially for health insurance.
2. Medical care services, which includes health insurance, weighs 6.8% in CPI. And pharmaceutical products weigh another 1.4%, so combined 8.2% in CPI – but that’s only the part that consumers spend.
3. Health insurance spending is spread across consumers, governments, and businesses — and not just consumers. Only the consumer-paid part goes into CPI.
4. That figure you cited, “costs 18% of GDP,” represents the overall spending on the healthcare complex by businesses, governments, and consumers, on everything related to healthcare, including pharmaceutical products, medical care, medical care devices, hospitals, doctors, dentists, chiropractors, supplements, rehab, health insurance, etc.
Once we get that Iranian oil, prices are heading south, just you wait and see
Gasoline prices are already heading south, which will be reflected in June CPI. Services inflation is unlikely to head south.
I will take the other side of that bet (I already sort of am). Not that June reporting will show a drop because it will. Gas has been dropping for the past few weeks and probably will for a few more weeks. But I think that over the next 6-8 months the price of gas will increase, and if the Strait is still semi-closed next spring (if not sooner) then the price of gas will go vertical.
My reasoning is that due to past oil shocks and then the shock from the recovery from COVID, a lot of buffer has been built into the refining system. I think that when Trump decided to go to war in the ME the price of oil overreacted. Just like past oil shocks, people expected the price of oil to go through the roof so it rose quickly. Then people realized there was now lots of more slack built into the system. China had built a huge oil reserve. Many refineries went from operating on a near JIT basis to keeping higher levels of oil inventories. The world’s oil system was more awash in oil than most people realized. So the price has been gradually dropping from it’s panicked highs. Plus many counties have been taking extraordinary measures to conserve oil and gas.
However, there is a finite amount of excess in the system and it is being used up. Eventually the excess will be gone unless the Strait opens up soon (which according to the 57563rd announcement from Trump might only be in a few days). When the excess runs out, the oil market is going to have to face the reckoning that it has access to 10% less oil than it did before hostilities started.
Now obviously the wild card in all of this is a president with an extremely erratic decision making process. He might suddenly get bored with all of this and take his ball and go home, leaving Iran to do whatever they want and oil prices could easily moderate. He could sign a deal that is objectively worse than the one he ripped up in 2018 and his cultish followers will swallow it and oil prices will moderate. Or he could continue not to care and oil will stay higher than before hostilities and then go crazy when the excess inventories and emergency measures are used up.
Well if we listen to the CEO’s of EXXON and Chevron that we are about to experience an inflation caused by an oil supply shock
as Iran holds the fool our president hostage
Those manipulative bastards are just pimping their stocks (both are down) and trying to pump up their bonuses. They’re tying to manipulate people into accepting the ridiculous high price of gasoline. The US is awash in gasoline and is a huge exporter of gasoline — including the refineries of those two companies. And gasoline prices have been dropping for several weeks.
Yes, the U.S. is awash in gasoline, but the rest of the world isn’t and supplies for the rest of the world are going to get tighter. Gas is a fungible item so if the rest of the world pays more for it, U.S. consumers will as well because refiners will find it more profitable to export than sell domestically.
I don’t think you realize just how much of the rest of the world is stressed about the future of oil and gas supplies.
Now obviously this is all dependant upon an erratic president. If somehow an gasoline export ban finds its way into existence then that will probably keep gas prices low in the U.S. (depending upon the details of the ban), but I think there will be lots of oil CEOs whispering into the ear of the president about that.
Demand destruction for gasoline has already set in, as it invariably does when prices spike. That’s why the price of gasoline has been declining in recent weeks.
IDK, I feel like we retail investor peons are not getting the full story about whether or not there are petroleum shortages.
First of all, Trump, Netanyahu, and Iran are all saying different things at different times about whether the war is over with or not, and the terms of this deal we’ve been talking about for 2+ months now but nobody can see. Maybe it exists or maybe it doesn’t. By now, all 3 of them are fresh out of credibility.
Yet, if the war is still going on, why are crude prices down to the $90 level? How is a significant amount of oil still “leaking” out of the Persian Gulf without being interdicted or shot by either side? I guess it’s due to bribes to Iran and the US letting the ships pass. The failure of crude prices to escalate is evidence that the supposed oil shortage isn’t compounding, and maybe isn’t even real.
This whole episode confirms my vow to avoid any investment in anything making headline news on the internet. The headline news is usually wrong, and if you follow it you’ll just believe more incorrect things and make worse decisions. Today’s shoeshine boy with stock tips writes for Yahoo Finance and makes TikTok videos. Welcome to the (mis)information age.
You have stressed before that inflation was mostly in services. Looks like that has changed.
Only temporarily. Gasoline inflation won’t stick. Gasoline prices are already dropping (which will be reflected in June CPI). Dropped gasoline prices were a big reason CPI inflation came down starting in the second half of 2022 through 2025. Look at the gasoline price level chart. That’s the story of gasoline.
I wouldn’t be too optimistic about that.
Yes gasoline prices in the US may drop as there’s plenty of output for domestic purposes and we could relatively simply create policy to reduce prices, but global crude and NG prices will not continue to decrease to pre-Iran levels. Current global market is being tempered heavily by drawing on reserves (mostly China’s) and sharply reducing demand (again mostly China and SA Asia). China imported 11mb/d in Feb, it’s down to 9mb/d now and will likely be 7mb/d by end of the month according to Oxfort Institute of Energy Studies. Mostly managing that by prioritizing fuel over other petro products (which will start showing up elsewhere in CPI soon).
In addition, European gas reserves are drawn way down and are not refilling yet due to high prices. This creates a delayed demand for at least the rest of this year that will continue propping up prices long after the Strait opens. Add to that the renewed interest in strategic independence & increasing national reserves around the globe, and you have a big beautiful wave of delayed demand.
Meanwhile Russia’s oil industry is taking massive hits the past 6 months from new long-range strikes by Ukraine. Russia used to account for over 10% of global oil production, this will be hampered for years to come.
Demand destruction for gasoline has already set in, globally, as it invariably does when prices spike. That’s why the price of gasoline has been declining in recent weeks.
The world just keeps getting crazier.
At an ever increasing rate.
Let’s just keep getting our information from social media, to figure out how to deal with it. Never led us wrong yet… right?
We should get a deal in the next few days.
The deal is also transitory
You could have said that two months ago.
Is it transitory again??
Can they shrink the cereal boxes any more than what they’ve already done?
The mini boxes we use to take camping when I was a kid will soon be the new full size.
46oz orange juice is awesome too, should be down to 42 soon.
Maybe we’ll start measuring gasoline in liters soon. That’ll make it feel cheap!
Already there.. £1,79 a liter for diesel in the UK…
Oil leads to inflation leads to higher rates leads to pop goes the bubble and the bubble goes pop.
Thanks for the report. Its always the best inflation summary out there.
I didn’t see too many rosy takes out there in msm today though, which is kind of unusual.
MarketWatch gave it the ol’ college try:
Headline: “The 4.2% inflation rate is a bummer, but the worst might be over”
Lede: “What goes up must come down — including the rate of inflation. The recent surge in prices may have run its course.”
If you aren’t paying for your journalism, someone else is.
Team transitory is a political movement.
I pay for wsj, but not much longer. it’s a round the clock wall st advertisement. Cut rates, print money, inflation either transitory or great, etc. When you can guess what the articles are going to say before reading anything, that’s pretty bad. But once in a while there’s a good article like one about Chuck, the Telluride Ski area owner, and his drama with the local government.
I agree about the WSJ. Mostly useless but I maintain my subscription in order to read its special articles, such as about the Telluride guy, and its investigative reports, such as those into the scandal of the Medicare Advantage Plan insurers. Their series on that triggered a massive government investigation and some changes too. They have some good analyses of the private credit fund issues, etc. But there are days I just look at its headlines and shake my head in despair. And sometimes, when my head blows up, I lash out at it publicly.
Much of the market thinks that everything will get back to normal soon (as the president has proclaiming recently for months), but saying something over and over isn’t just going to make it happen.
If one looks into the actual reasons a deal hasn’t happened yet is because both sides think they are winning and need to concede more.
To date, Trump has yet to actually pay any sort of political price for high inflation. He is in a bubble where he can just dismiss inflation worries as reporting from “fake media”. All of the sycophants who talk to him butter him up and only mention worries in passing. He genuinely thinks things are fine. He still is banging the drums for rate cuts. He is still in his usual “pretend it doesn’t exist and it will go away” mode. That is the way he has led his whole political career due to having a cult following that will ignore any indiscresion and still support him. It has always worked for him and he thinks it will still work.
He doesn’t realize that hitting people in the pocketbook might have a different effect. The unwashed, uncaring, not paying close attention middle abandoned him long ago. Now even cultists are starting to rethink stuff. However none of this has yet to show up in a material way.
As for the Iranians, their economy is in shambles. There is no doubt that everyone there is hurting. However popular opinion matters much less in a severely repressed society. Furthermore, the hodtile actions of the U.S. and Israel have provided a common enemy for the Iranian people to rally around and accept some suffering. There is a reason that young people are no longer protesting in the streets in Iran. Getting attacked by a foreign cointry brings people together. It is the reason GW Bush had an 80%+ approval rating after 9/11. Furthermore, Iran has demonstrated to the world that they can disrupt shipping through the Strait and they can hurt other countries in the region. They have shown that being a friendly ally of the U.S. isn’t a guarantee of safety.
Sure, the fancy technology provided by the Americans can knock down 80 or 90% of Iranian drones and missiles, but 80 or 90% is not 100%.
Both sides think they are winning and therefore do not need to compromise. Therefore no deal is imminent. The market hasn’t yet figured this out yet. They still think a deal is a few days or a few weeks away.
I just wonder if Warsh is going to be able to keep the plates spinning as
well as Bernanke, albeit in the
opposite direction.
I think he’ll do as well as JPow, circa 2021.
Well at least my SS will be slated to go up by 4.7% next year… not that it will keep up with inflation at that point!
Philly guy here again. Brought in my nephews mdx to dealership for a courtesy inspection. Here in pa we need annual is inspection and emission stickers, it’s a racquet…. failed on a safety portion and need $2650 in suspension work before it would pass. Went to our local friends car shop and the total was 1650 total with tax. Shop around, downsize, or even investing in one of those electric e bicycles that all the youngins are blazing around in my be in all our futures. We also booked a little space in Mexico for five nights four days. Little less than 535 per person two adults and two kids all food and board. Cannot get that at the Jersey shore… it was almost 35 percent higher just a month ago when air fuel was spiking so we waited it out. Good luck out there all
In my opinion, these energy prices will completely screw up the P&L of many energy intensive companies and … the AI companies are on the front seat.
Especially when the people push back due to high power bills.
People hate high power bills.
Well, with data centers driving up demand for electricity, it’s good that the current government administration is doing everything they can to bring online additional energy sources. Oh wait, that’s not really what’s happening.
While they are working to bring online new pollution and acid rain generating coal power plants, they’re also spending billions to kill off renewable energy projects because our president (Don Quixote) gets triggered by windmills.
“Remember a windmill cannot grease a palm.”
-from Windmill 101, written by Jack handy
Now I know why my crazy friends think 10 to 20 million is not enough to retire on.
Fun fact
In the late 90’s most households were not even close to $25,000 in retirement savings.
This was the era when CEOs started picking the pockets of companies by taking stock options and cooking the books to get more of them.
The little guy did not prosper in this era, but CEOs did! To the tune of 100’s of millions of dollars.
Now we’re in an era of CEOs taking 100’s of billions.
CEO playbook, inflate the take, give the crumbs.
Are they crazy? Or just crazy spenders? That makes all the difference.
Let me guess – they pick up their groceries in a cyber truck?
but clip coupons
I have spent far too much time becoming more knowledgeable about the oil market than I ever wanted to recently. This is because during COVID, the price of oil plummeted (turned negative in certain markets) and the stocks of oil companies dropped as well. There was a huge sale on oil stocks. I figured the price drop was either a temporary thing or we were heading for an apocalyptic wasteland world where my investment wealth would not matter anyway, so I loaded up on oil stocks.
Turns out I was right and it was temporary. Oil recovered and so did the stock price of the oil companies. I was going to sell, but I never got around to it (laziness and a lack of other investment options). Then came the IRA under Biden and the huge turn to green energy. Many people seemed to think that oil was going to be come obsolete (I distinctly remember a guest on one the talking head shows saying gas power cars would not be sold in 2027 or 2028 because no one would buy them). So many of the oil major stocks were priced as though the price of oil was $20 cheaper than the actual price of oil because lots of people thought oil was going to be obsolete.
So I didn’t sell and instead bought more. The stocks of oil companies recovered just before the war. I still hadn’t sold because I still didn’t know where else to invest the money. By then oil stock had become a larger percentage of my portfolio than I was really comfortable with, but I already had a ton of cash (as t-bills were providing a good return compared to inflation) so I just continued to hold oil stocks.
Then our president thought Bibi was a smart man and decided to follow him into a war of choice. Oil prices then took another leap and I got lucky and benefited because I was lazy and didn’t know where else to invest.
A month ago, oil stocks made up a very uncomfortable large portion of my wealth. I sold some of it, and invested the proceeds in some mediocre stocks that I am not excited about but consider the least dirty shirts in the basket. However I still have far more money in oil stocks than I would have imagined 5 years ago.
So I have spent far too much time obsessing of the price of oil and figuring out what drives it. After doing so, I really think if the current situation holds (Strait mostly closed) then oil will be much higher in a few months. I am ok with being wrong on this. If oil returns to $50 – $60ish per barrel I will lose some money on oil stocks, but it will be an acceptable amount and far, far less than the downsides of other stocks.
If anything, my biggest fear is that higher oil prices tip the whole world into a severe recession and it results in a lot of demand destruction.
Again, just my 2 cents, but it isn’t without some work and thought behind it. YMMV and that is what makes a market.
With inflation “above target” for 5 years, no, I don’t believe it’s transitory, nor do I believe that the Fed cares to solve it.
We had about a year of adequate rates before J-Pow caved to his friends on Wall Street and lowered rates again.
I stand by my statement that Powell has been a disaster. I hope Warsh will do a better job but I am not optimistic.
It’s not that the Fed doesn’t care to solve it in the abstract, but that they’re not willing to do what it would take. If their choices are 4% inflation or sub-2% inflation and popping the stock bubble and increasing unemployment to 6-7%, they’ll take the former every single time.
Thing is, if somehow they popped the bubble, and housing and stocks corrected, crypto went south for good, etc, they could actually wind up with those low rates they are dying to get their hands on.
Yes. Inflation has been out of control for many years. Powell failed his #1 job, miserably.
Warsh won’t do any better if he “looks through” (disregards) energy and food inflation when setting interest rates. We all know this idea is an inflationary scam.
Would they also look through food and energy inflation if it turns around and dampens total inflation? Not a chance. They’d use the lower food and energy inflation as an excuse to lower rates.
And the media celebrates him for purportedly doing a great job.
Since Mar 30 low SPY vol accumulation is high. It spiked, before a
minimal correction with a min vol accumulation. The stock markets
protect investors from inflation.
Yesterday NVDA was 4.89T, AAPL: 4.3T, Googl: 4.22T, MSFT: 2.90T
AMZN: 2.55T, Meta: 1.43T and TSLA: 1.44T for a total of: $21.73T.
If this correction is over Spy next stop: 800 area
What’s R * now? R * is a moving target. The money supply can never be properly managed by any attempt to control the cost of credit
Monetarism has never been tried.
Oh we’re trying it.
Fun observation:
1) Look at M1 money supply here:
https://fred.stlouisfed.org/series/WM1NS#
2) Switch the view to “Percent Change from a Year Ago” (Edit Graph > Units)
3) Observe that the percent increase in M1 one year ago (e.g. June 2025) corresponds to the rate of CPI inflation we are seeing today, about 4%.
4) Note that the annual rate of M1 growth today is 5.4%. Place your wagers for the future accordingly.
One may object and say I should be using M2. The numbers are about the same either way.
Your conclusion is fantasy. The year-over-year change of M1 (the chart that you linked) was NEGATIVE from Oct 2022 to Sep 2024, including -10.7% yoy in August 2023. During the time that M1 yoy change was negative, CPI inflation was as high as 7% and PPI inflation was as high as 8%. There is no correlation between yoy change of M1 and CPI.
The second wave of inflation is just getting started. Go ahead Mr. Warsh, raise those rates! I triple dog dare you!
Isn’t the FED just doing what it was designed to do, asset accumulation for its member Institutions? Designed to outlive its administrators, survival at all costs…by not allowing normally designed resets…it’s a new ledger, all interconnected and unable to pivot as the math reality starts to set in…. fiscal Dominance…don’t all institutions behave the same way incapable of change outside it’s design…I guess the French nobility and church didn’t see it coming or simply paralyzed by the institution itself…looks like long term managed decline in the cards…it cycles out every time…