
The CPI headline does not provide political backing for a politically unpopular rate hike at the July FOMC meeting. Details – such as outliers reverting in a month or two – don’t matter today.
By Wolf Richter for WOLF STREET.
The Consumer Price Index for gasoline prices plunged in June from the spike in the prior months, roughly as expected as prices at the pump started dropping in May.
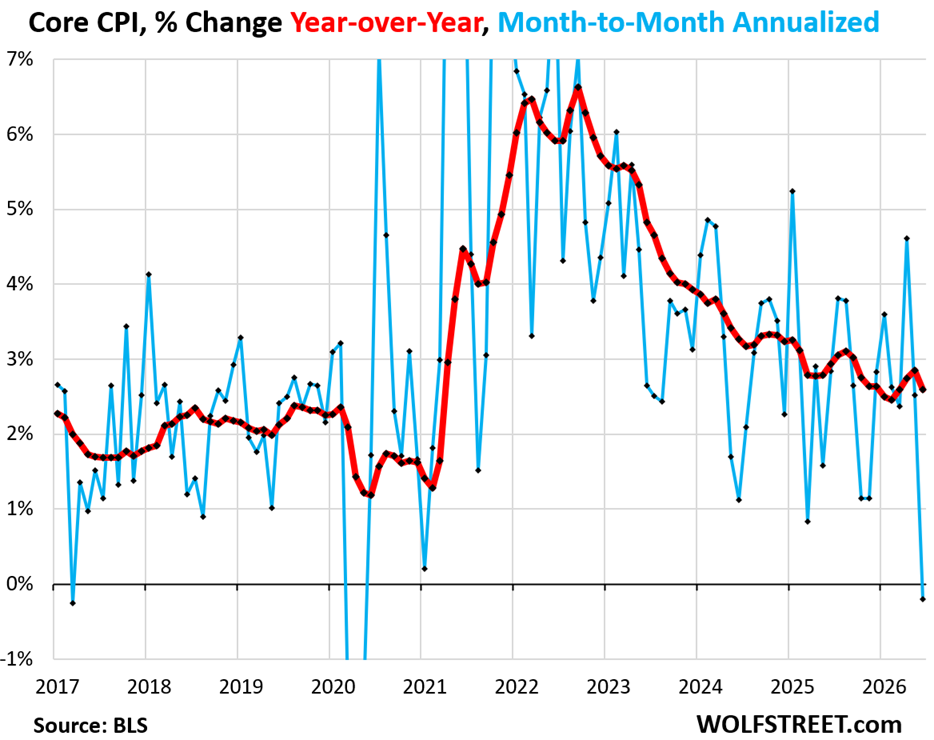
But June was also one of those rare months when the month-to-month squiggles – represented by the blue lines in the charts below – in many major categories either were negative or nearly unchanged at the same time, reflected in the “core” CPI, which excludes energy and food, and thereby excludes the plunge in gasoline prices.
Core CPI (excludes energy and food) fell by 0.02% in June from May, or annualized -0.20% (blue line in the chart), according to data from the Bureau of Labor Statistics today. The last time it fell month-to-month was in 2020, before it bounced back violently.
As the blue line in the chart shows, big outlier month-to-month moves like this are followed in a month or two by big moves in the opposite direction. That’s how the month-to-month squiggles work.
The negative month-to-month reading of core CPI occurred because of the outlier near-0% month-to-month reading of the “core services” CPI (accounts for about three-quarters of core CPI), and negative month-to-month readings in the big categories of non-food-and-energy goods, such as new and used vehicles; apparel, footwear, and jewelry; and household furnishings and supplies.
The month-to-month drop of core CPI pushed down the year-over-year increase to +2.59% (red line).
Since January 2020, the core CPI has soared by 27%.
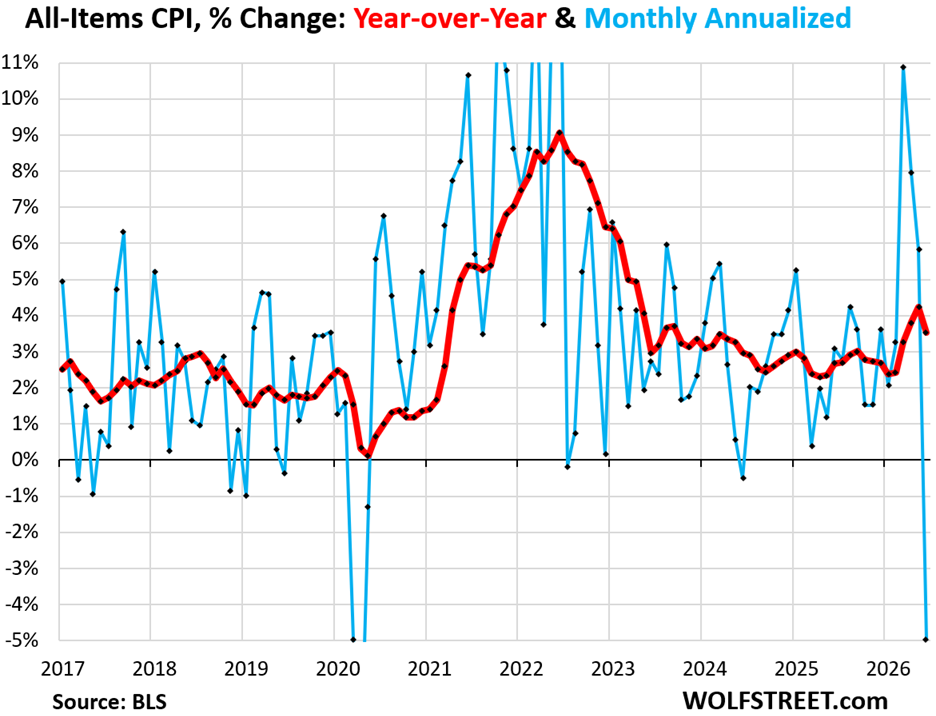
The all-items CPI (which includes energy and food) dropped by 0.42% in June from May (-5.0% annualized, blue line), hammered down by the month-to-month plunge in energy prices.
This month-to-month drop of the all-items CPI caused the year-over-year reading to decelerate to a still very high +3.53% (red in the chart).
Since January 2020, the all-items CPI has soared by 30%.
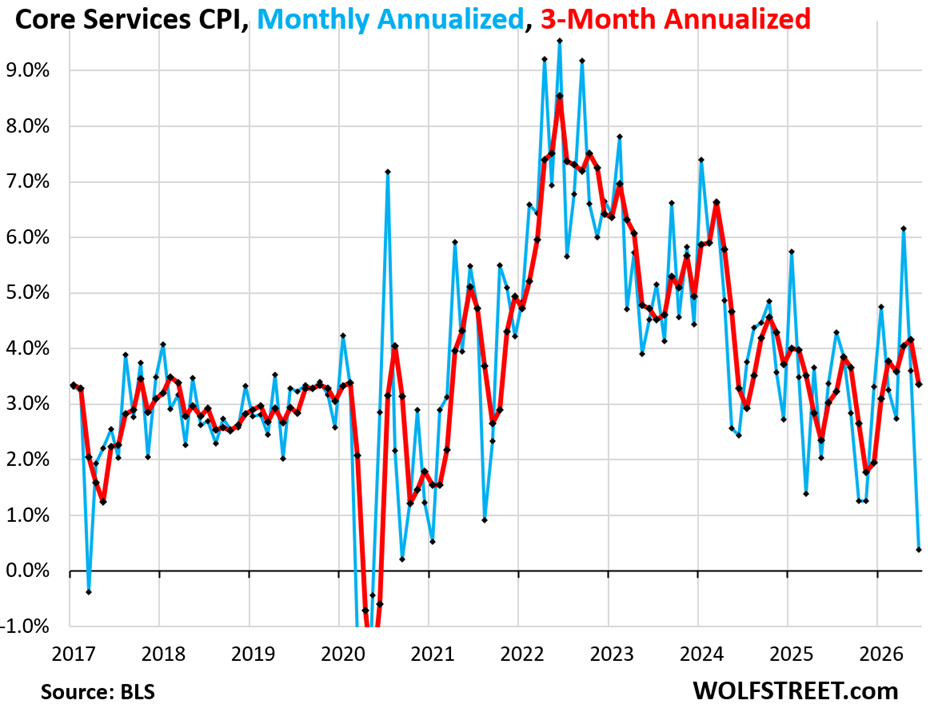
The core services CPI, which excludes energy services such as electricity, inched up by only 0.03% in June from May, so nearly unchanged (blue line).
It was pushed down by a month-to-month plunge in motor vehicle insurance (-2.0%, or -21.6% annualized) and month-to-month drops in many categories, including health insurance (-0.46%, or -5.4% annualized).
The housing CPIs rose only modestly month-to-month: Rent +0.15% and Owners Equivalent of Rent +0.24%.
But the CPI for motor vehicle maintenance continued to soar, in June by 1.09% from May (+13.9% annualized). It is up by 50% since January 2020.
This outlier near-0% month-to-month increase of the core services CPI caused the year-over-year increase to decelerate to a still high +3.47% (red line).
Since January 2020, the core services CPI has soared by 30%.
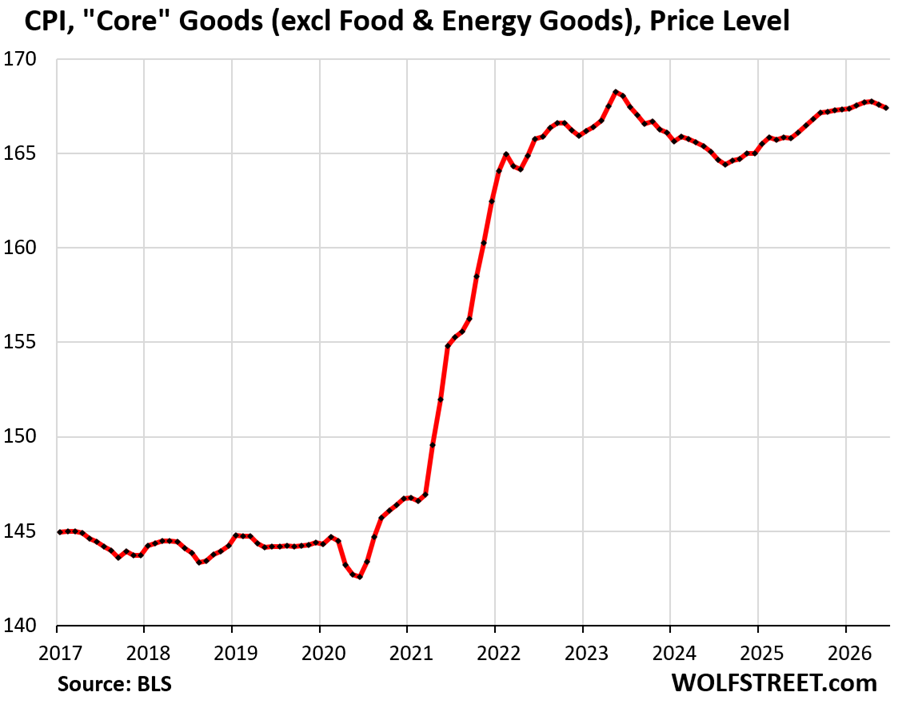
The “core goods” CPI (all goods except food & energy goods) dipped by 0.09% in June from May, the second month in a row of negative readings.
The dip was driven by the CPIs for used vehicles and new vehicles (which dominate this category) both of which dipped in June from May. Also the CPI for apparel, footwear, jewelry, and watches fell month-to-month, as did the CPI for household furnishings and supplies.
Year-over-year, the core goods CPI was up by 0.8%. Since January 2020, the core goods CPI has risen by 16%.
This chart shows the price level of the CPI for “core” goods, not the percentage changes.
Food inflation.
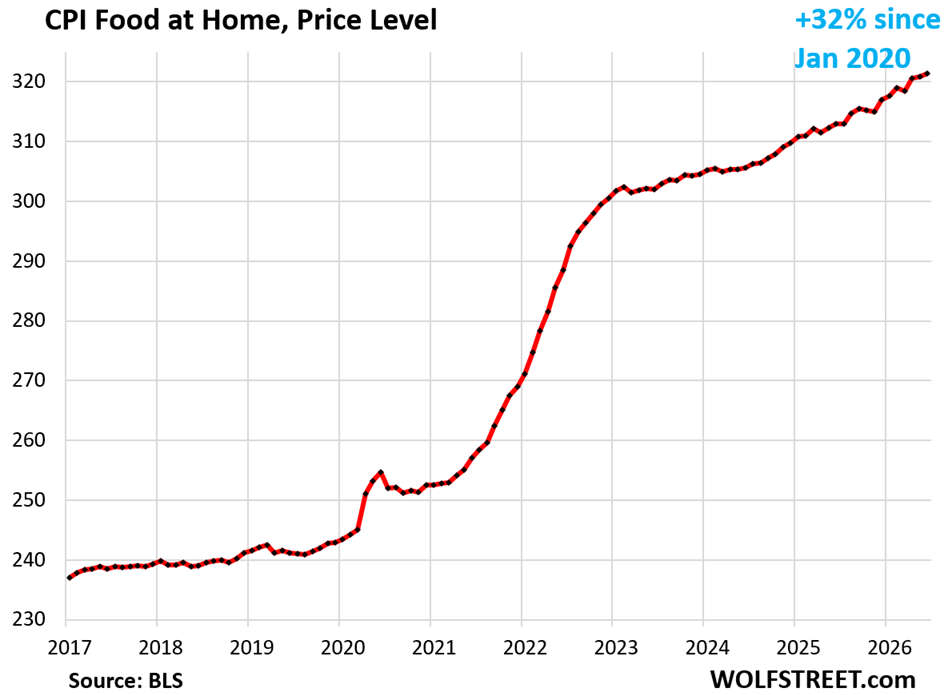
The CPI for food at home ticked up by 0.23% in June from May (+2.8% annualized). This index tracks food bought at grocery stores and markets to be consumed off premise.
Year-over-year, the CPI for food at home rose by 2.6%, a slight deceleration from the prior two months (red line).
This chart shows the price level of the CPI for food at home, not the percentage changes. Since January 2020, it has risen by 32%:
Energy inflation.
The CPI for energy plunged by 5.7% in June from May (-50.6% annualized), driven by the plunge in the CPI for gasoline and the drop in the CPI for electricity.
But year-over-year, the energy CPI was still up by 45%. The CPI for energy weighs 7.8% in the all-items CPI.
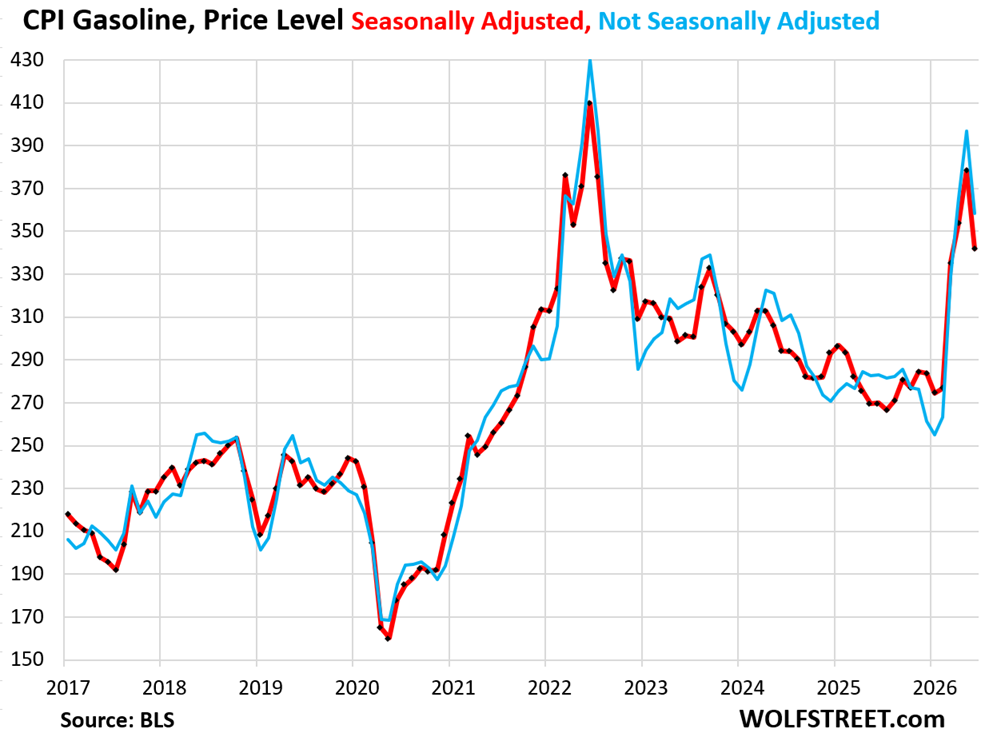
The CPI for gasoline plunged by 9.7% month-to-month, seasonally adjusted.
But year-over-year, it was still up by 26.7%. And since January 2020, it was up by 41%.
The CPI for gasoline fuel weighs 4.3% in the all-items CPI.
The chart shows the price level of the gasoline CPI, and not the percentage change, seasonally adjusted (red) and not seasonally adjusted (blue).
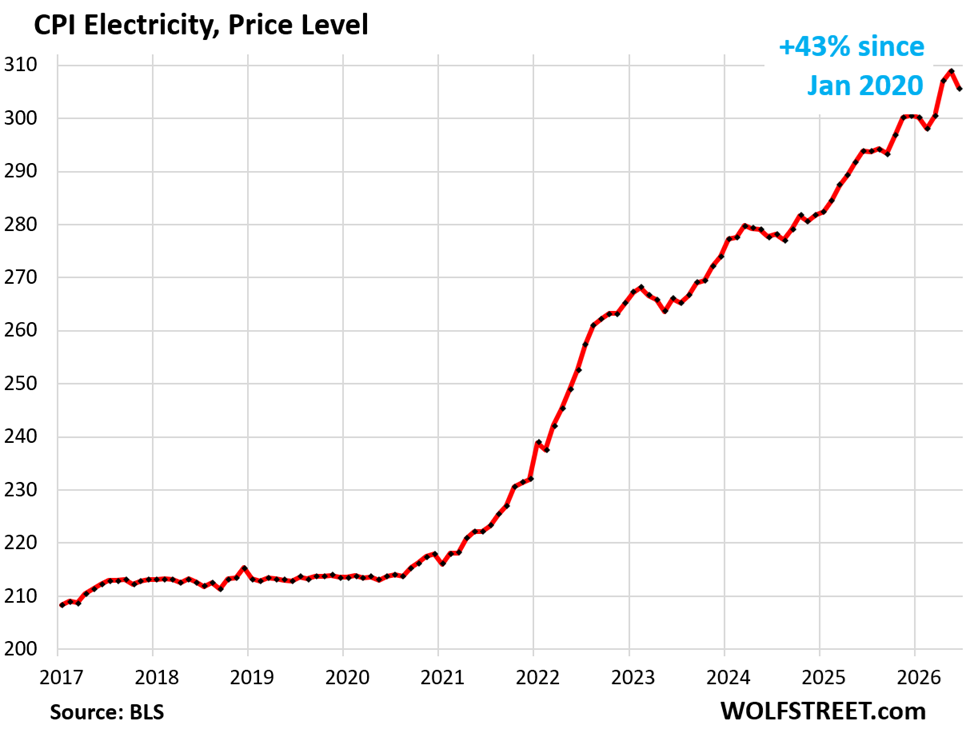
The CPI for electricity fell by 1.04% in June from May. This reduced the year-over-year increase to 4.0%.
Data center demand has been pressuring electricity prices for years. Since the beginning of 2021, the CPI for electricity has surged by 43%.
The CPI for electricity weighs 2.5% in the all-items CPI.
As far as rate hikes is concerned.
This report does not provide political backing for a rate hike at the July FOMC meeting. Rate hikes are highly unpopular in any White House, particularly in this White House. And they’re unpopular in Congress. Politicians love free money. And so rate hikes need to have the backing immediately beforehand from the headline inflation data. The details – such as outliers reverting in future months – don’t matter. No one up there has any patience with details. And this report’s headline data doesn’t provide that backing in the headline data.
The September FOMC meeting takes place after the CPI report for July and August are released, and after the reports for the Fed-favored PCE price index for June and July are released. And if today’s outliers revert by then, those reports may provide backing for a rate hike at the September meeting. But that didn’t happen today.
Enjoy reading WOLF STREET and want to support it? You can donate. I appreciate it immensely. Click on the mug to find out how:


The day is not over, but the markets don’t seem to be over-celebrating it in any way
IBM’s stock is having its worst day ever after the surprise release of an earnings miss
The only thing that is newsworthy here is that despite the 25% plunge, IBM shares aren’t even back where they’d been on May 13. Why did these morons pump up IBM shares so high in two months? The stock market has become a collection of lunatics.
It has a P/E below 20 and pays a 2% dividend. The March low was a drop from much higher prices. It’s one of the few stocks that seems reasonably valued imo.
What’s ridiculous is the volatility and extreme swings. I can’t remember a time when were seeing so many 10%+ daily swings.
you get 4% from T-bills and that’s free from state income taxes… that’s over double the IBM dividend, and it’s guaranteed, while the IBM dividend can be cut or eliminated without prior notice.
IBM is now at $217. It was in that range two months ago, then spiked then plunged again. It was in that range in April 2025, and then spiked and then plunged again. It was in that range in January 2025, the spiked then fell again.
Technically, the divvy is back to 3.2% now that the stock price got a substantial haircut.
Still not as good as T-bills, though.
People who owned IBM got cooked.
They’ll never admit it.
They’ll just hold till it is 50% less and sell.
Haha
The Intel madness may unwind next.
Unless your cost basis is like $60, I know that’s nominal not real but just saying. It also means yield is good too
Brace for $4 gas again: How U.S.-Iran tensions are threatening to end the price break at the pump
Just paid over $4 a gallon for midgrade. Doesn’t seem to affect the straight 6 as much as a V8.
I see so many people around here that haul and burn a lot of stupid.
It’s really popular!
/s
The price of WTI crude is less than 2% higher than when Trump took over from Biden. Yet the price of gasoline is 50% higher…
Jawboning the market through social media posts seems to work.
If only all our refineries use WTI that might be relevant. Oil is a global market.
“a swallow does not make a spring”
War is inflationary and we are in two.
Thanks for another great report. Your data and perspective are greatly appreciated.
“ And if today’s outliers revert by then, those reports may provide backing for a rate hike at the September meeting. But that didn’t happen today.” Really? What backing does he need? If he wants to win back credibility and independence then he has 63mos worth of data points to do so. If Warsh is as transformational as I think he is, he will begin reversing the 75bps of insurance cuts the last regime took out battle a deteriorating labor market that never materialized, on July 29th. This number changes nothing.
You understand nada. There are 12 voting members on the FOMC. The Fed chair has only one vote. If a Fed chair dissents from the majority during the first meeting or any early meeting, it would instantly destroys his credibility as a majority builder, and he would not be able to accomplish anything. The Fed chair’s role is to build a majority of the voting members at the FOMC for his views, and that’s a slow process.
Only one Fed chair ever dissented from the majority: Marriner Eccles dissented three times between 1938 and 1939.
Perhaps gasoline siphoning will re-emerge.
A kind of nostalgic homage to the early 1970s.
Can be done while also removing the catalytic converter!
Well that would suck!!!
Re-emerge? It’s been a thing for a while now. Much preferred over the hole drilled in the gas tank maneuver. Yes, that’s been a thing for a while now too. This is in Seattle.
I damn near stopped reading when the report said “health insurance dropped by 2%”
C’mon, pull the other one. These numbers are really failing to even pretend to have anything to do with reality anymore, like they aren’t even trying. Imagine if we measured inflation like we used to the one and only time in history we managed to stop it with high rates. It’s probably not 10%, but it certainly isn’t 3%.
And pretending that that are not running wide, free and open money spigots when the Federal government is emitting 7% of the monetary base (deficit) every year and rates are 4%………………..
The health insurance CPI is something that I have lambasted as “chickenshit” for about 3 years. The methodology blew up during the pandemic. They tried to patch it afterwards but that didn’t change much. you should see my articles right on top when google: health insurance CPI chickenshit.
Thankfully, it weighs less than 1% in CPI. So by itself, it’s not a huge issue.
The other methodological problem I have with CPI is QER (Owners Equivalent of Rent). But unlike health insurance, it weighs 25% of CPI. It’s huge. It’s a stand-in for the expenses that homeowners face, such as homeowners insurance, property taxes, maintenance and repairs, HOA fees, etc. And it’s doing a lousy job tracking those. But it’s up 3.25% yoy.
Many of the other CPIs are very good, including the new and used vehicle data (purchased from JD Power which has been the industry data-gatherer for decades and gets its data via automatic electronic submissions from dealers in real time, based on actual transactions), energy data (obtained from the EIA), some of the food data (obtained via cash-register data from collaboration with the industry), etc.
The more the survey-based data can be replaced with industry transaction-based data, the better. But it’s complicated, and there are privacy law issues, and all kinds of legal issues that have to be sorted through painstakingly when the government uses industry data. Surveys are just easier.
So I’ve lost all my remaining patience with goofballs who are clueless about the complexity of inflation tracking and who go around the internet spreading BS… that their strawberry jam went up 20%, after not having budged at all for 15 years, so inflation must be 20%. I block those after a while as part of my house-cleaning. Tired of this BS. Not wasting anymore of my remaining time on their BS.
Here’s my real numbers.
Family of 4
Annual cost for major medical. United Healthcare. $10,000 deductible.
Never made a claim.
2015 -> $7800
2016 -> $8800 (13% increase)
2017 -> $9700 (10% increase)
2018 -> $10,433 (6% increase)
2019 -> $12,000 (15% increase)
2020 -> $12,400 (4% increase)
2021 -> $13,600 (9% increase)
2022 -> $16,800 (24% increase)
2023 -> $18,300 (8% increase)
2024 -> $20,100 (10% increase)
2025 -> $25,300 (25% increase)
2026 -> $29,700 (17% increase)
I am self-employed. At some point this is not sustainable.
Yeah, it’s my single largest expense yet it’s only 1% of the cpi. I must be an outlier.
Haven”t you heard of Owner’s Equivalent Healthcare? The FED interviews LA unhoused street folks on how much they pay for healthcare then extrapolate that as needed.
Waiono-
That wouldn’t surprise me. From what I recall their convoluted method broke out what you pay. For example if you pay 10k in annual premiums then some small component say 500bucks of that is insurance expense and the other 9500 go into a medical expense bucket. So if the 500 buck slice drops a few bucks then magically the cpi for health insurance drops. This could be total BS but whatever. It’s not straightforward like it needs to be.
That health insurance cost history is mind blowing. And think about it from an employer’s perspective. They typically cover a majority or all of that for the employees. That’s a pay raise that those employees won’t see. I’m recently retired and not yet eligible for Medicare. Health insurance is my largest monthly expense. No effin way we’re seeing an increase in services or quality healthcare either. America’s medical industrial complex is totally FUBAR.
Icebox
Correct, your figures are not sustainable. Move to California. Health insurance is a lot cheaper here. I know because when we moved from Texas to California, the premium of our high-deductible BC plan (similar in both states) back then dropped by about half.
My wife’s and my insurance costs combined now are less than $10,000 a year. And salaries are higher here than in Texas.
Healthcare in America is not sustainable. It is just a matter of how much pain people are willing to put up with before they wake up and want something different.
Unfortunately they keep electing people who want to make healthcare worse simply because those politicians are willing to hurt the brown man. It sucks, but at some point it will change. It has to.
These numbers are plausible. There is a good, well established and long running survey of employer sponsored health benefits costs conducted by the Kaiser Family Foundation, and these numbers for individual health benefits match pretty well.
Even though employers ostensibly “pay for” much of the premium for these employee health benefits, their cost is ultimately borne by employees, via foregone wages and salaries. Employee total compensation is based more or less on expected productivity and other market forces, These higher benefit costs eat into potential wage and salary gains, and they are a large reason why median salary people’s take home pay isn’t matching inflation.
Even the employer “paid” portion of employee health premiums should be factored into the cost of living indexes for consumers. The CPI for health insurance is effectively underweighted in addition to being absurdly calculated.
Ha move to a state that is unsustainable to escape your unsustainable healthcare expense. This is the world we live in.
@Wolf
Health insurance rates for most who receive through employer are going to be much more firm dependent (BMI distribution, age distribution, dependent characteristics, etc) than state dependent.
Some difference between same tech company in TX and tech company in CA, but mostly it’s much less than tech company vs oil driller, as an extreme example.
William McDonald
So when we moved from TX to CA and switched BC insurance policies, we were both independent, paying for our own insurance, same as Icebox, which is why I used that example.
There are some big differences between TX and CA. TX is much more corporate-friendly, including much more insurance-company friendly, than CA, which is confirmed by the constant drumbeat in the media about companies and billionaires bailing out of CA and moving to TX. As a business you face some hassles in CA that you don’t face in TX, I can confirm that. You face the CA Franchise Tax Board that is trying to clean out all businesses via income taxes. Etc., etc. I have a laundry list of complaints and grievances as a business owner.
Well, the side effect is that for consumers, a lot of things are better in CA, including health insurance, minimum wages (we have state and city minimum wages), general wages, life expectancy (CA: 79.3 years; vs. TX 77.1 years), and other stuff. Health insurance is bad enough in CA. But what TX is doing to consumers by giving insurance companies free rein to do whatever is terrible.
@Wolf
It’s a mixed bag. I work in operations management for a medium sized business (~250 employees) with operations in CA, NJ, and TX. Agree 100% that Texas has essentially no regulations for consumers or workers, but at the same time I clearly see that regulation in CA definitely adds to producer costs, both directly and due to the compliance burden.
The divergent regulations at the local level in particular are a huge burden to simply calculate. For example, we employ delivery drivers, and the city of SF requires us to use an entirely different pay structure to calculate pay for time spent driving within the city limits. The regs aren’t even clear on how the calculations should be done, so had to hire a lawyer to give us his opinion of the safest algorithm from a risk perspective. Uber-sized companies have no problem with their in-house counsel and IT army, but tough for a quasi-startup.
Somewhat unlikely we see a raise before midterms in November.
Warsh does not want to get blamed for the shellacking that is coming over gas prices, etc. After that, he won’t care because the white house is a lame duck and the Dems won’t be looking to own trumpflation. So warsh can tighten then.
Warsh can’t do anything with Federal Reserve interest rater policy unless he gets a majority vote from the 12 FOMC (Federal Open Market Committee) members. Warsh has no power at all by himself and is just one of the 12 votes on the FOMC.
There is no FOMC meeting in August. The October meeting is 27-28, immediately before the 3 Nov. elections. So, the September meeting is the only realistic chance for a rate rise. Unlike Pres. Trump, Mr. Warsh cannot deny the undeniable. The data will decide.
The highest interest rates in U.S. history occurred in 1980 and 1981, when the Federal Reserve aggressively hiked the benchmark federal funds rate to a record peak of 20.00% to combat rampant double-digit inflation. This resulted in 30-year fixed mortgage rates averaging an astronomical annual peak of 16.64% in 1981, with some daily rates briefly exceeding 18%. Maybe we will lucky enough to see FFR rise to 10.00%. There needs to be a reckoning, gigantic sell off in markets. Kill inflation before the 2028 elections, when the borders will reopen and America returns to chaos.
Inflation was 15% back then. Now it’s 3-4%.
3 to 4% on much much larger numbers. Makes a difference.
Well you can say the same for salary increases.
But again, IT’S NOT MEASURED THE SAME anymore
The only time in history raising the rates above the rate of inflation worked was that one time in 79-81. But we don’t measure the rate of inflation the same (and everyone would agree the new measurements are lower than the old measurements) so saying inflation is 3-4% measured the new way and thus rates are neither restrictive nor lax at 4% might be true, but it isn’t going to fix the inflationary problem.
We are measuring one side of the equation the same way as 45 years ago (interest rates), we are not measuring the other side of the equation the same way.
Yeah, back in ’79-81, we didn’t have smartphones, laptops, Windows, Microsoft 365, flat-panel TVs, laptops, internet, broadband, streaming, wireless subscriptions, online banking, online brokerages, Netflix, online subscriptions to everything, a gazillion healthcare treatments and medications that are common today, they didn’t have self-driving features in their cars, pickups with 10-speed automatic transmissions, EVs, hybrids, four-wheel disk brakes, antilock brakes, air bags, 600hp passenger cars and pickups… back then life was slow and primitive compared to today. So the basket of goods and services that CPI tracks has to change with the times, and it does change with the times, and I’m so sick and tired of seeing this goofball BS from YouTube here.
“back then life was slow and primitive compared to today. ”
I’d take the life back then to the chaos of today any day.
Swamp Creature
This site couldn’t exist back then because there was no internet, and I wouldn’t have had access to the data I have access to now, and you wouldn’t have been able to post this comment. You would have had to find something else to do with your time, such as breathing down the neck of your wife to drive her nuts 🤣
What is strange is that in a rational world, this should be one of rare times the White House might not mind a few rate hikes.
The White House is taking a beating on inflation (some of it self inflicted), with all of the nutty deportations it is pretty clear that employment is in a good spot and can handle some rate hikes. Rate hikes might actually lower stuff like mortgages.
Unfortunately this is a president who has made his whole career on debt. That means he always wants lower rates. He cannot help himself.
So we have a FED that is locked up by inaction because they are afraid of the president.
I think he’s doing the rational thing politically. As much as everyday Joe complains about inflation, they would also be happy to receive another check from the govt.
I had noticed that PPI index for construction material jumped the past 6 months. This metric had been flat for 4 years.
The cost to build a new house is going up if this is true. Not sure how that effects affordability but it cannot be good for the new home builders who are already seeing low sales because of prices.
Homebuilders are having to lower prices and throw incentives at their homes in order to sell them. They have lots of inventory, and they need to keep building to keep their revenues flowing. They have been eating the cost increases. You can see that by their profit margins which have dropped. Lennar (shooting to be #1 in the US) has cut its gross margin by half since the pandemic, to 15.6% in Q2 2026, from 29.5% in Q2 2022.
https://wolfstreet.com/2026/06/11/what-homebuilder-lennar-said-about-the-tough-housing-market-average-sales-price-down-24-from-peak-back-to-2017/
The vehicle maintenance cost trend is interesting.
I’m curious how much is driven by people keeping vehicles longer such that they need major work vs newer cars more expensive to repair vs lack of manpower due to boomer retirement/immigration crackdown.
Vehicle maintenance inflation is largely driven by 3 factors: 1. wages in that sector, auto technicians are in short supply and the good ones make a lot of money (they’re paid the time for a repair set by a labor time guide, times a portion of the shop’s flat rate). 2. The cost of the parts used in the maintenance job (such as fluids) that the consumer pays for; And 3. profits.
Repair shops generally operate on a flat rate system. When the shop raises its flat rate, the techs get paid more (they get a portion of it), and the profit of the shop goes up, automatically. And the consumer pays for it.
In terms of cars getting driven for longer, that should not have any impact on inflation because inflation tracks changes in the amount a consumer pays per each specific maintenance operation, for example, battery replacement, or front-end alignment. For inflation calculations, it doesn’t matter how many of these jobs the industry sold; what matters is how much the consumer paid in June for a front-end alignment.
Wow I didn’t realize the CPI data would get all the way down to the job level. Seems difficult as they aren’t “coded” in a universal way like health procedures.
Thanks for the insight.