
Warsh wants the bond market to do its job and look at inflation and the economy — and not at the Fed — and it’s finally doing it.
By Wolf Richter for WOLF STREET.
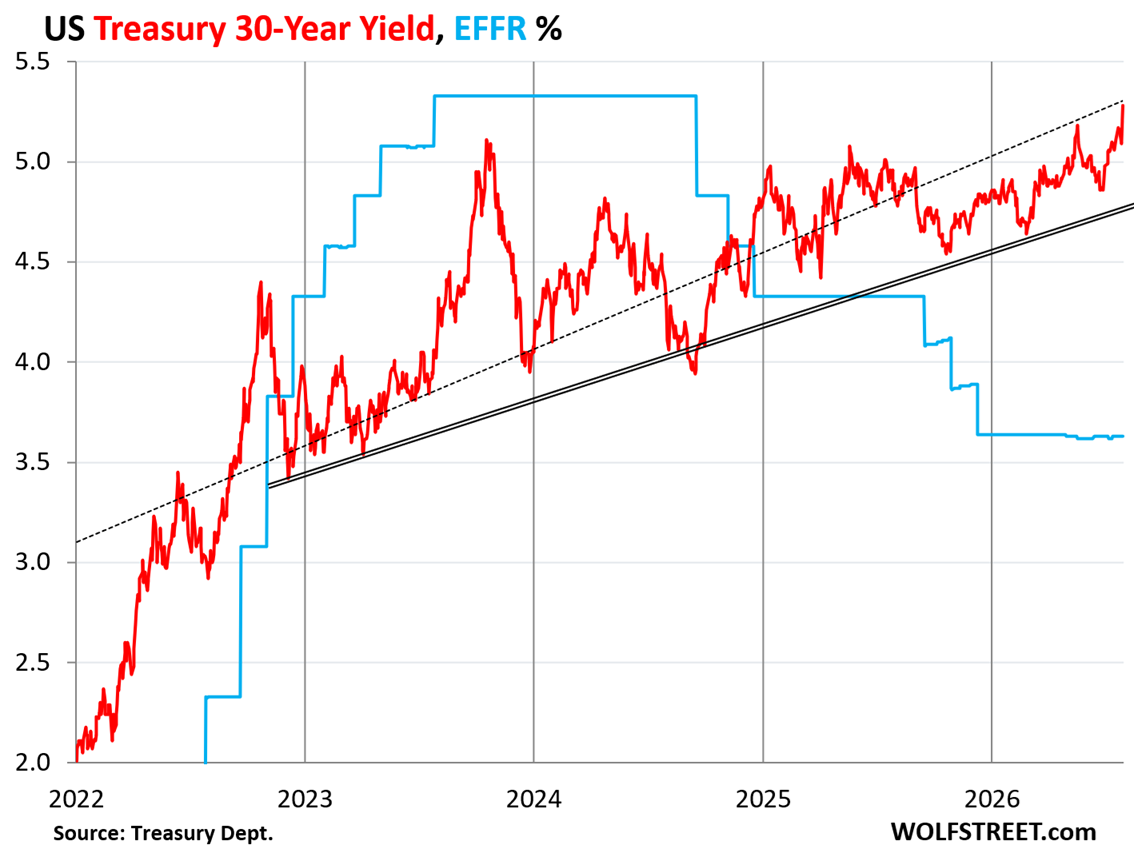
The 30-year Treasury yield jumped by 7 basis points on Friday, and by 12 basis points during the week, to 5.28%, the highest since July 2006, now 165 basis points above the Effective Federal Funds Rate (EFFR, blue in the chart below), which the Fed targets with its policy rates.
During the FOMC press conference on Wednesday, Fed Chair Warsh repeatedly said that ending “forward guidance” by the Fed was already working, that Treasury yields had already surged since the FOMC meeting in June when he’d scuttled forward guidance, as markets had begun to look at the inflation and economic data, and not at the Fed. Buyers and sellers were doing the hard work, and raised rates and tightened financial conditions, and this “has provided us some comfort that we’ve got the ability and capability to deliver.” In other words, the bond market was finally doing its job.
The dotted line reflects the linear trend for the data in the chart. The double line traces the higher lows since late 2023.
Buyers of long-dated Treasury securities are primarily concerned about two things:
- Inflation, which eats up the purchasing power of their principal, and they want to be compensated via a higher yield for that loss of purchasing power.
- The onslaught of supply that will require new buyers to get pulled into the market, and it may take higher yields to pull these fence-sitters to the Treasury auctions. But rising yields mean lower market prices for bondholders that had previously bought that debt at a lower yield. And new buyers want to be compensated via a higher yield for taking that risk that yields will rise further.
And those risks have been growing, and the Fed has done nothing but cut rates since the fall of 2024, though inflation has been accelerating for over a year, which has spooked the bond market.
The two-decade view shows the last 14 years of the 40-year bond bull market during which the 30-year Treasury yield fell from over 15% in September 1981 to about 1% in mid-2020, when it flipped to the bond bear market that is now wrapping up its sixth year.
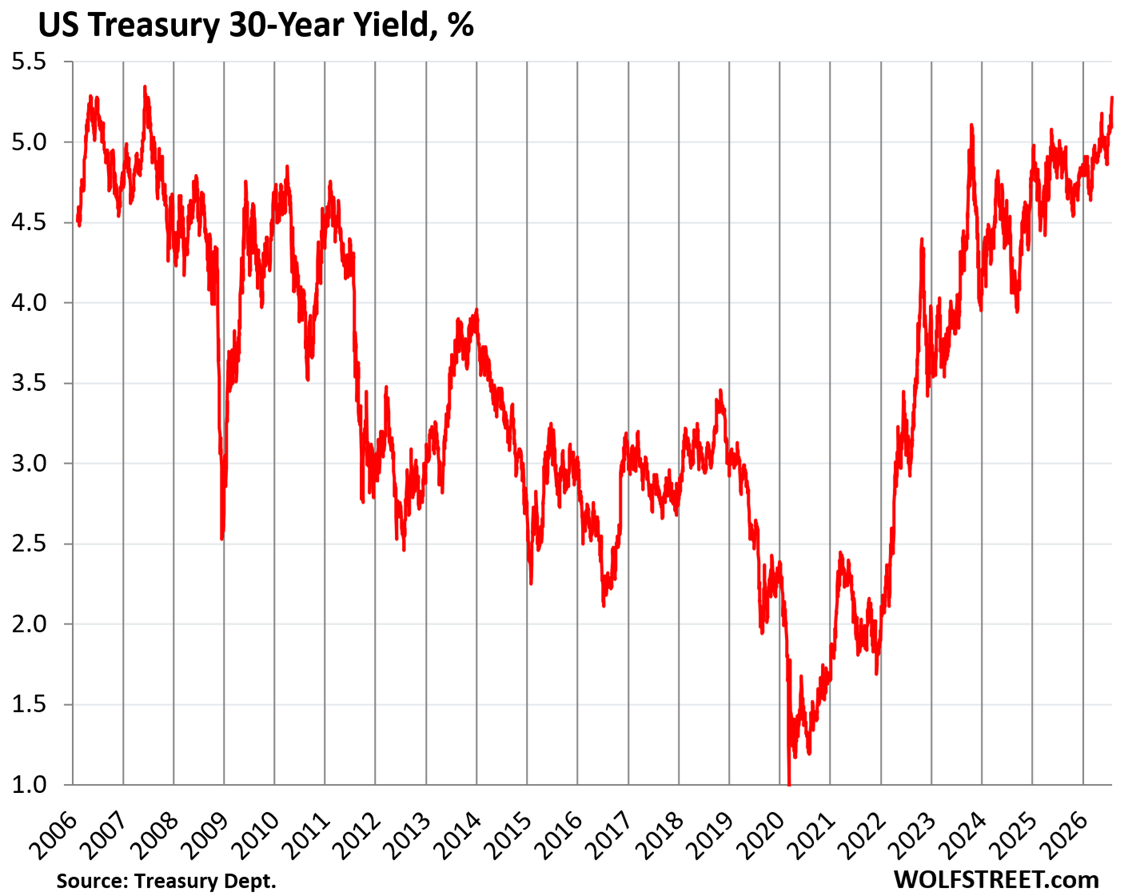
The current bond bear market has been a bloodbath, triggering the collapse of several regional banks in 2023 that had loaded up on long-term Treasuries and government-guaranteed MBS in 2020 and 2021. They had believed the Fed’s forward guidance that interest-rate repression would continue for a long time. But the forward guidance was a lie. The Fed ended QE, hiked rates, and started QT in 2022, and long-term yields soared and the market prices of the long-term bonds that the banks had purchased a couple of years earlier collapsed.
The market value of 30-year Treasury bonds that the government sold at auction in mid-2020 has plunged by about 50%.
Of course, investors that bought at the auction can hold those bonds for another 24 years to maturity to get all their money back, but along the way, they’ll collect only 1.3% or so of interest per year for another 24 years, while current buyers would earn 5.28% a year, and when they get their money back in 24 years, inflation will have eaten up a big chunk of its purchasing power. Those bonds purchased in 2020 were horrible deals for the original buyers.
Before Warsh became Fed chair, he blasted the Fed for its forward guidance: Forward guidance had locked in the Fed as inflation was surging in 2021 while the Fed was still at 0% and still doing massive QE – and I called it “the most reckless Fed ever.”
And then when it finally broke loose from its forward guidance and began tightening, it was too late, inflation was out of the bottle, and wasn’t going back in, and some of the banks that had believed its forward guidance in 2020 and 2021 then collapsed in 2023.
Warsh scuttled forward guidance as one of his first moves at the FOMC and told the bond market to figure things out on its own. And the buyers and sellers in the bond market are now doing their jobs, reacting to economic data, to inflation and supply data, and not to the Fed.

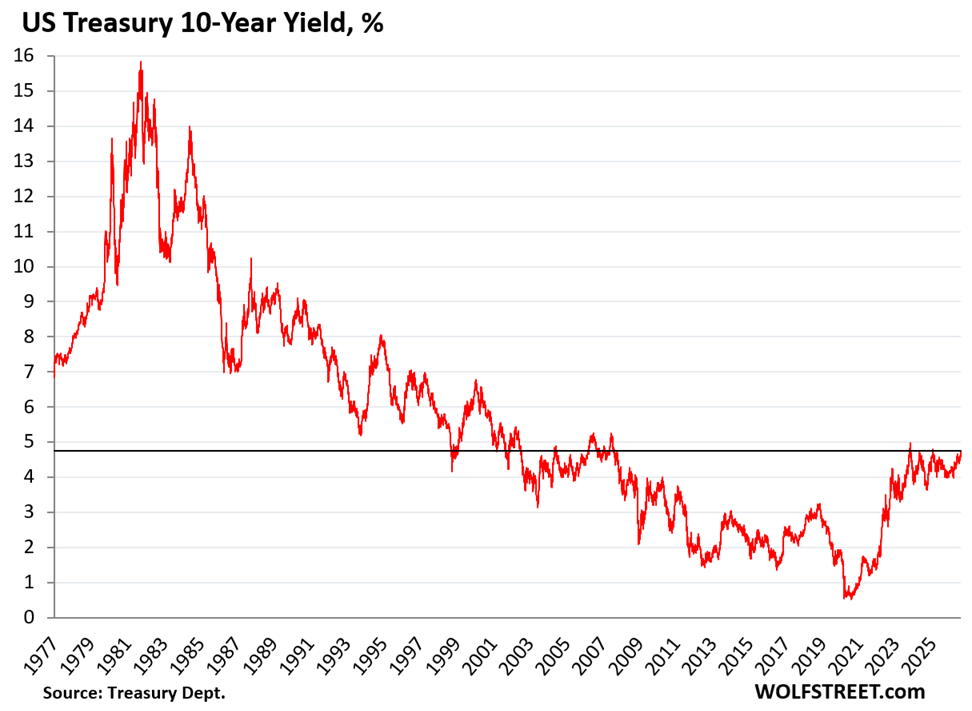
The 10-year Treasury yield rose 7 basis points on Friday to 4.75%. It had briefly hit 5% during the debt-scare in October 2023, and that 5% had opened the floodgates of demand, and this massive demand pushed the yield back down.
But there is no guarantee that the floodgates of demand will re-open at 5% the next time around.
The 10-year yield at this level is not high from a historical perspective. The Fed started its interest-rate repression, including QE, in 2008. That’s what pushed down the 10-year yield to these very low levels.
Now inflation is out of the bottle, and it doesn’t want to go back in on its own, and the Fed cannot do QE in this environment.
In addition, Warsh wants to reduce the Fed’s balance sheet further as one of the ways to bring down inflation, which is the opposite of QE and could put upward pressure on long-term yields. He needs a majority at the FOMC to do that, and at the Wednesday meeting, he didn’t have a majority for anything other than maintaining status quo.
This chart shows the 40-year bond bull market from September 1981 to mid-2020, followed by the six years so far of the bond bear market:
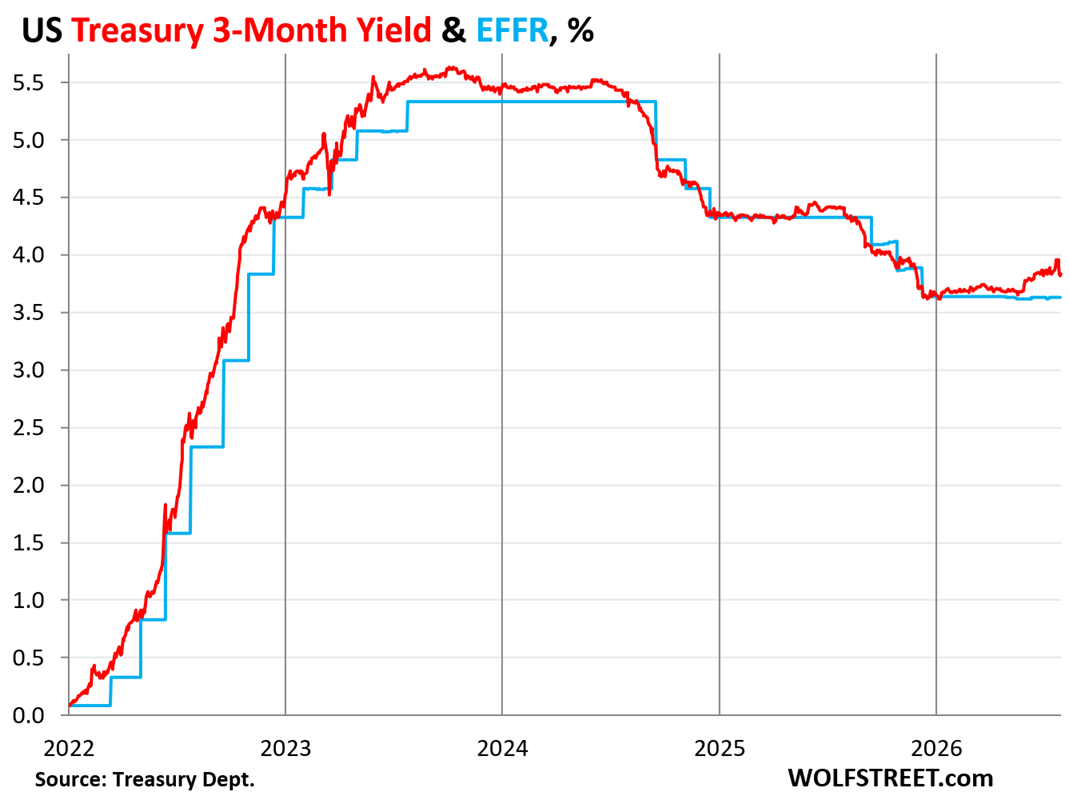
Short-term Treasury yields of 1 year and less declined since the FOMC meeting. They’d already priced in a rate hike either at the July meeting or at the September meeting. The July rate hike didn’t come, and they’re still counting on a September rate hike, but with less conviction.
The three-month Treasury yield fell by 13 basis points during the week, to 3.83%, per Treasury Department calculations, so about 20 basis points above the EFFR (blue line). The September FOMC meeting is in its three-month window.
Treasury Yield Curve has steepened and is starting to look healthy. The chart below shows the yield curve of Treasury yields across the maturity spectrum, from 1 month to 30 years, on three key dates in 2025 and 2026:
- Red line: Friday, July 31, 2026.
- Gold dotted line: July 28, 2026, day before the FOMC meeting.
- Blue dotted line: September 16, 2025, before last three rate cuts.
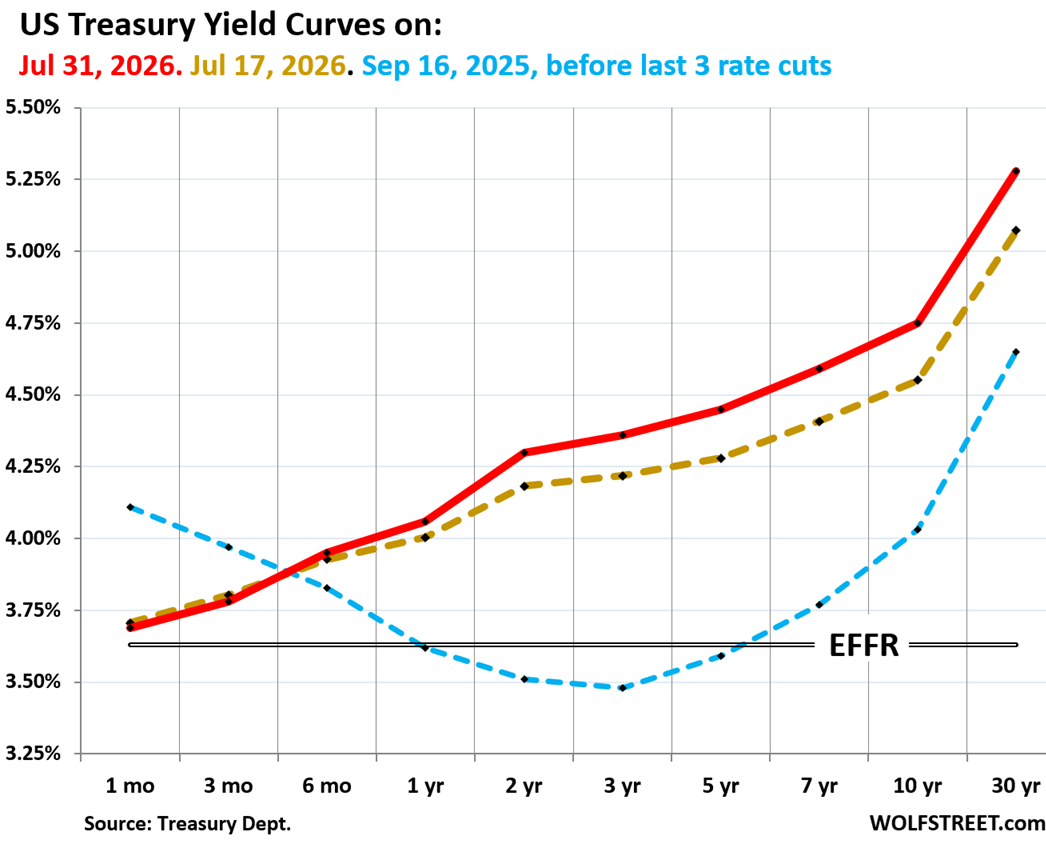
The yield curve inverted in mid-2022 as the Fed had begun hiking its policy rates, which pushed up short-term Treasury yields, but long-term yields were slower in coming up and were lower than short-term yields. The inversion had triggered endless recession calls because prior yield-curve inversions had been followed by recessions.
And then, when long-term yields caught up, the yield curve developed a big sag in the middle, with yields between 1 year and 7 years lower than both short-term yields and long-term yields.
And then when the yield curve un-inverted temporarily in early 2025, it triggered more recession calls on the theory that it’s the un-inversion of the yield curve that actually predicts a recession.
And then in the second half of 2025, it developed another big sag in the middle on a new bout of rate-cut mania that was pushing down yields one to three years out (blue line in the chart above).
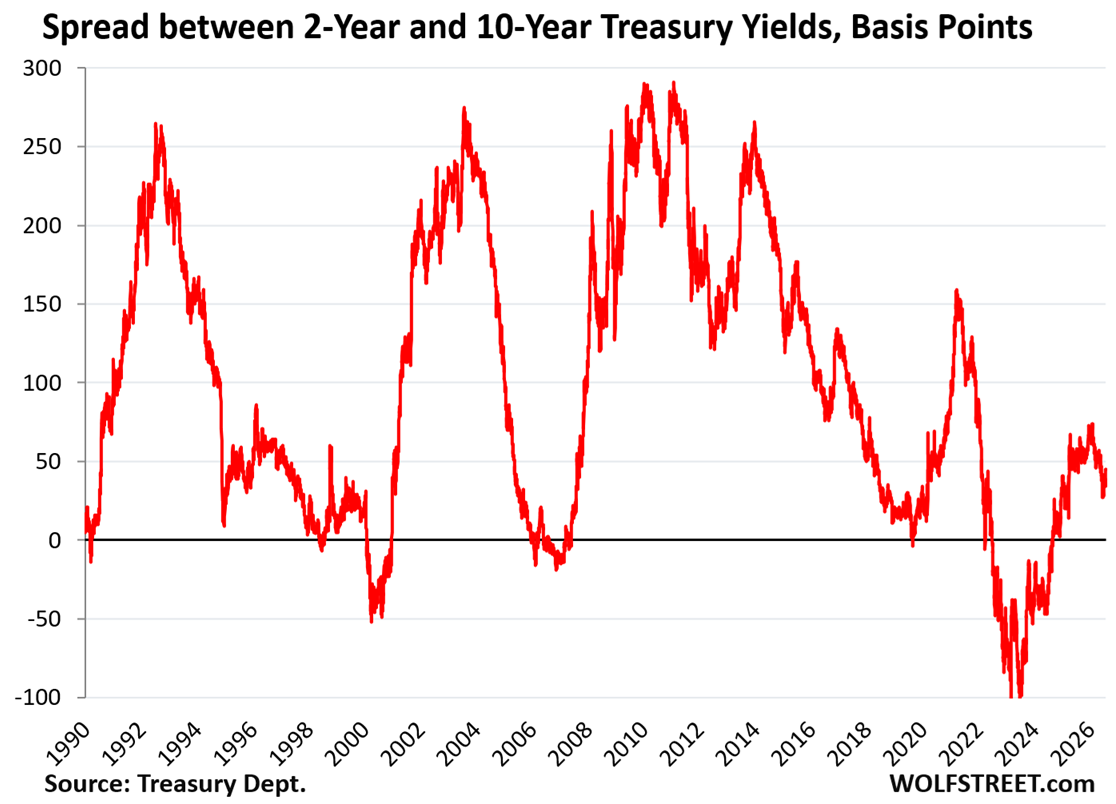
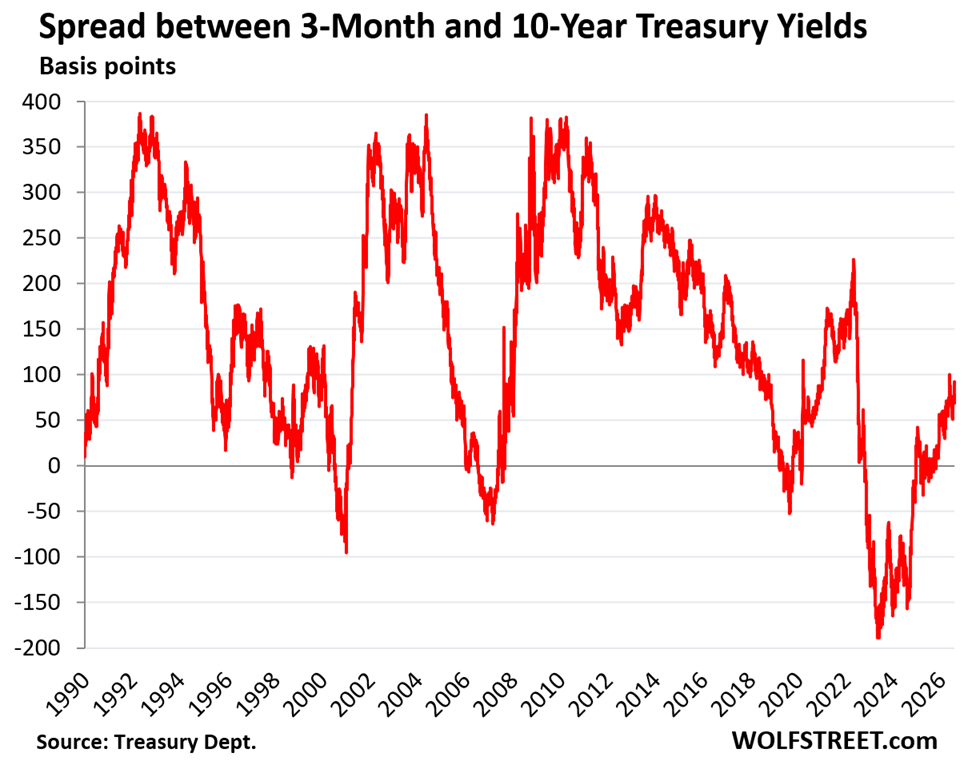
So now all this is behind. The yield curve finally looks healthy, but not steep – and it could be a lot steeper. Here are measures of the steepness of the yield curve:
The spread between the 2-year and 10-year yield is only 45 basis points. During periods of economic growth, that spread spent lots of time in the range of 100 to 250 basis points, indicating that the 10-year Treasury yield at today’s level is well below where it might end up going.
When the spread was negative, the yield curve was “inverted.”
The spread between the 3-month and 10-year yield is only 92 basis points. This is low for periods of economic growth, also indicating that the 10-year Treasury yield at today’s level is well below where it might end up going.
Enjoy reading WOLF STREET and want to support it? You can donate. I appreciate it immensely. Click on the mug to find out how:


Might be time to “buy the dip” in the bond market soon. Once the AI bubble collapses, bonds might finally regain their luster and serve as a viable alternative to an imploding stock market. Hot take.
In an economy where you can get a loan to buy five-and-a-quarter 30 years for effective 3% OID, I don’t think that’s a hot take…
When the yields fall sometime over the 🤷♂️ next few decades, you can sell those bonds as if they were 3’s, 2’s, or 🙏 1’s and stash a profit.
Markets are doing the Fed’s work, most won’t admit it because “Trump puppet bad!”, and everyone was all on board 4x leveraged AI plays 🤔 this ain’t right.
If ppl are fire selling bonds because they don’t like Warsh, I’m on the other side of that bet.
“If ppl are fire selling bonds because they don’t like Warsh, I’m on the other side of that bet.”
No one is “fire selling” these bonds at the moment; but BUYERS are demanding a higher yield (lower price), and they’re getting it.
I guess it’s not a fire sale if you do it every week.
With debt to GDP at 125ish percent, I wouldn’t be suprised if the 30 gets to 6 maybe 7%. Funds rate most likely will get a hike next meeting. The reason question is what kind of recession will we see next? Will there be QE infinity because if so, then 10% isn’t impossible.
And let’s not forget I believe Warsh saying the Fed is done with buying MBS. I’ll believe that, when I see it. I have zero confidence that promise will hold.
We now live in a Fed / Congressional / WH environment that will do everything they can to keep people in their homes, and buying MBS will be part of that. It might not be as big as 2009, but I don’t believe it’s been fully retired.
It is this kind of propaganda that keeps people stuck in consensual hallucination until it’s too late.
Wolf’s response keeps me convinced: Some folks don’t grasp that US Politics is a BUSINESS and that makes Homeownership a Politician’s BUSINESS. For the unconvinced, take a job in DC. I did.
@Wolf – Why do you think that the FED will not continue buying MBS?
My reasons for why the FED will continue to buy MBS –
1 – FED is quasi government. Its independence is fake (See Arthur Burns vs Richard Nixon). The FED will have to bow to politicians who want their homeowner voters to be happy. Print money to buy MBS.
2 – How can the govt fight the Iran war confidently if there are massive drops in home prices and job losses? People will complain.
3 – Kevin Warsh is related to Ronald Lauder of Epsstein files. No evidence against Kevin so far, but there is likely to be some compromat on Kevin either directly or indirectly.
The Fed stopped buying in Sep 2022, and then started shedding them as part of QT, and has continued SHEDDING them month after month to this day. Fabricate your fantasies in the privacy of your own home.
Lol. They can’t keep doing something they aren’t actually doing. Why do so many people clown themselves in your comments sections, Wolf?
Good, the Fed needs to quit meddling. Let the markets work and stop kowtowing to Wall Street. There has been enough of Fed policies that served only one master starting with ZIRP and QE. The most massive transfer of wealth in American history.
And great, the market leading comments need to end.
2027 will be an interesting year imo. While AI is not nothing, it is also not anywhere close to the valuations it has, combined with of course Chinese competition. If OpenAI and Anthropic can’t go public I think there only hope is more circular financing from Nvidia but that may also fall through. I think OpenAI is dead man walking, I’m less certain about Anthropic. Grok anyone!?
Once a domino falls people might run to the exits and pile it into treasuries, perhaps driving yields lower. So I’m not convinced yields are necessarily going to go up.
My dad “backed up the truck” back in the day when long yields hit 6% on their way down and he did very well. I’d be too nervous even if they hit 6% this time around since inflation seems uncontrolled esp with the massive govt debt overhang, however 30 year TIPS are at 3% real so holding to maturity sounds like the perfect investment that fosters a good nights sleep. Other than FOMO if real rates continue upward, does anyone see any real risks in the 30 TIPS held to maturity?
I too have been getting very tempted by 20- and 30-year TIPS.
The risk that has been discussed on this site in previous threads is the dependence on consistency in the calculation of CPI by the Bureau of Labor Statistics. If BLS is directed to start taking liberties with the data that goes into CPI then TIPS are no longer tracking inflation.
I have no idea how assess that risk, but my hunch is that it’s higher than a few years ago. Thirty years is a long time for a debt-soaked government to avoid the temptation of debasing inflation calculations as the interest expense gets ever bigger.
Couldn’t help myself and started buttressing my “40”-side of the 60/40 with a 1:2 allocation of TIPs to 20/30’s. The tips definitely collapsed further and were looking offloaded hot to me 🤔 Despite continued inflation talk the actual market seems over it 🤷♂️
Seemed like the perfect opportunity to me… if rates go to 6 or 7% I guess I’ll have to buy more 😆 oh darn
“Despite continued inflation talk the actual market seems over it”
🤣 the actual market just ran up the 30-year yield to 5.28% out of inflation fears.
But this seems more a demand/supply issue than an inflation expectation issue. Else the 10y breakeven rate wouldn’t still be at 2.3%. I’m in the same boat as Kirk, I own TIPS and would have expected breakevens to increase with the next bout of inflation, thus adding to TIPS outperformance over nominal treasuries, but so far that’s not what the market did.
By “market” many believe Yahoo Finance headlines.
It’s not an inflation fear if it’s an inflation reality. I think between KevWar’s stalling committees and the last couple of press conferences, the message is clear:
We’re not raising rates no matter how high inflation goes.
And KevWar is right in a way when he says the markets are pricing in the economic reality. 10-30y rates should be 2% higher and the market is slowly catching on to that.
I am partially invested in TIPS and can see three possible problems in the future:
* CPI statistics meddling.
* After tax you may still get a negative real yield. Depends on your tax bracket and rate of inflation. Ironically, TIPS are best at low inflation. The higher the rate of inflation, the more you get taxed on ‘phantom income’ rather than just on your real yield which will eventually turn your after tax real yield negative. I made the calculation and for me, at current real yields and with my tax bracket, the loss zone starts with an inflation rate>5.5. This applies however to most investments. A stock you bought that rose with inflation but inflation adjusted earnings stagnated will have similar consequences once you sell and your phantom capital gains get taxed. Inflation is an awesome all around confiscation lever.
* If you are a non US-person: Capital controls through the tax backdoor. While it may sounds Argentina-like crazy, we just had a proposal floating around last year with the ‘revenge tax’. Desperate governments will do desperate things.
+1 to this list of risks.
I suppose if the Ruling Party starts falsifying inflation statistics, or if currency controls are enacted, it was time to get out of the US dollar a long time earlier.
My small emergency fund is in Euros, because there are some kinds of emergencies where you need a different currency to solve the problems.
TIPS are – in concept – a decent bond bet for the amount of wealth you choose to keep invested in USD’s. But at some point in the transition to a Russia-style political-economic system, the right answer is to get out all together.
In this broader sense, I’ll add another risk:
-Separately from inflation, the US dollar loses 40% of its value against an international basket of currencies, over the next 10 years. Consumption (and the CPI basket) might move toward domestically produced items in that scenario where nobody could afford imports, but your wealth would still have taken a hit.
Forward guidance was a central planners dream – distorting the market feedback loop. Credit to Warsh for not messing around and axing it on day 1.
Now Warsh needs the rest of the foot dragging fed voting board (who are obviously clinging to team transitory) to begin listening to the bond market. It is telling them something; they need to listen and act.
Agree the FED board needs to listen to the market. Also needs to follow Warsh lead and quit talking. But, the reader then said the Board needs to act. I disagree. It needs to get the hell out of the way.
With the 10-year strapping on its rocket pack, fueling up, tying its shoelaces, and eating a hearty breakfast, I bet real-estate agents are having panic diarrhea; the foreseeable future looks very ugly indeed.
RE Agents are quitting in droves. The market is frozen solid. No one is buying or selling. I see a lot of home improvements going on. Maryland lost 3,000 RE sales jobs last year alone out of 43,000 total. There are jobs up I95 in NJ, the only state in the USA that doesn’t allow you to pump your own gas w/o getting a $100 fine. Jobs, pumping gas, and cleaning windshields for tips are being advertised at $18/hour + benefits.
Can’t pump gas in Oregon, either. And mortgage brokers have been chopped, diced and spit out, too. I don’t have much feeling for RE agents that jumped on the rising prices bandwagon, but many are very good people doing their best. Stuck, for now. In fact, looking at buying a property next week. Seller (who are very close friends) and I have hired an agent we both know (and who has actually lived in this area) to work as a consultant. We are splitting the tab and will both show her the property separately and she will work as a non-partisan consultant. An intermediary. Will pay cash for travel and for one or two hours work based on her experience. It is a joint effort striving to find fairness. Never done it this way so we’ll see how it goes? It takes away personal conflict and awkwardness and hopefully it will be positive. Because she is not getting a percentage cut she will be paid just for her experience and has no reason to play dishonest games.
I told her to not bother with the big marketing perspective nonsense with the binder blah blah blah. There will be no listing. I will show her around first and then the seller will do the same. Then the seller will simply give me a call and we’ll talk price details. Any agent with experience can walk onto a site and know what it will fetch within minutes. Any carpenter can look at a structure and see problems. A good car salesman can do the same and probably knows if a buyer is serious within a minute or two. We don’t need any sales pitch fog to make this work and want to remain friends when it is over.
Oregon has left New Jersey in the dust.
We pumped our own gas all over Oregon during a recent vacation.
By the way, make sure you tip the gas station attendant. The last time I was in NJ I didn’t tip the dude, and he kicked the tires. The hub cap almost fell off.
A frozen market that could be easily fixed if prices were appropriate. Not 2022-level.
Markets will test Warsh when 10 yr will hit 5%.
Will he intervene directly or indirectly or let Markets decide fair price. Talk is cheap. Last time in Oct 2023, all FED doves came out and started all non-sense talk about how rates will come down soon etc.
So far Warsh is very promising. He is hammering down on FED will bring back price stability in both of his press conference. No forward guidance is already showing results.
Sad to see three-month Treasury yield fell by 13 basis points. Markets should have been sending signals Sep hike is a must.
the 3-month yield fell because there was no July rate hike.
“the 3-month yield fell because there was no July rate hike.”
I was wondering if you could elaborate on the mechanics of that. Thanks.
The “mechanics” boils down to buyers and sellers in the bond market and buyers at the Treasury auctions. The 10 days or so before the FOMC meeting, buyers in the bond market demanded to be paid for a rate hike in July, or else they wouldn’t buy. They weren’t buying without it. You saw that at the Treasury auction on July 27, two days before the FOMC rate announcement. The 13-week T-bills sold at an investment rate of 3.91%. That’s 28 basis points above the EFFR. That is what the government had to pay in yield to sell $92 billion of 13-week T-bills. It was the highest investment rate since before the last rate cut in December. That yield compensated buyers for a rate hike in July. The week before they sold at 3.82%, when a rate hike in July seemed less likely. As soon as the July rate hike went off the table, those yields dropped in the secondary market. Watch this week’s auction of 13-week T-bills. The investment rate will be substantially below 3.91%.
My crystal ball says the yield curve will wabble back toward it’s average dispersion and shape experienced in the post WWII years.
– Dispersion: Short end 1-12% (average 4%); Long end 2-20% (average 7%)
– Shape: sloped up to the right by about 3-4%
As usual, the various rates will move in fits and starts, including temporary inversions.
I agree with other posters who’ve expressed relief with Warsh decision to pause on the forward guidance, and the assumption that the FOMC “has the market’s back.” Hopefully that form of market subsidization is history.
PS- I bought the crystal ball at a garage sale about 35 years ago for a buck…
Okay, the market is doing its job of reflecting data. When will the FOMC start doing its job of fighting inflation?
Monetary policy (the Fed’s policy rates) has to be transmitted via the markets to the economy to create tighter financial conditions. Markets creates higher interest rates and tighter financial conditions for borrowers in the economy. So whatever the FOMC does that creates higher interest rates, including mortgage rages, is fighting inflation. And by letting the bond market run loose and look at inflation data on its own, and thereby raise interest rates on its own, is what the FOMC has done to fight inflation. Obviously, it can and should do a lot more. But it’s a start.
At some point the narrative “rising long-term rates prove Warsh was right to let the market price the risks of higher rates and inflation” shifts to “why is the market for long-term rates saying it has no confidence in this Fed to control inflation and prevent another 1970s?”
And no amount of tough talk – all we’ve seen so far – will change that.
i have always enjoyed the economist publishing big mac index.The purchasing power of a U.S. federal minimum wage worker has dropped drastically over the last several decades, as the federal minimum wage remained frozen at $7.25 since 2009 while the national average Big Mac price climbed to $6.22.In 1980, an hour of minimum-wage work could purchase nearly two Big Macs; by 2026, it buys barely one. i’m a boomer who pumped gas in 1982 while going to grad school. life was much easier back then for working class folks in usa, to sit on couch watching idiot box sportsball and go to sportsball games while not working too many hours. the young college folks and working class have it much harder today, to do the same. we will end up like argentina, lagging them by 70 years.
1. Measuring broad inflation by the cost of a single product is for silly-fun only. If you take it seriously, you identify yourself as card-carrying goofball.
2. The federal minimum wage … 30 states plus DC have their own minimum wages, and lots of cities have even higher minimum wages. San Francisco is at $19.61. California is at $16.90.
3. Even employers in states without a minimum wage are forced to pay above $7.25/hr because they cannot hire and keep good workers for $7.25/hr.
4. The average hourly earnings of “Production and Nonsupervisory Employees” (excludes management, executives, and supervisors) has risen by 36% since Jan 2020, to $32.68/hour… that’s 4.5 TIMES the federal min wage.
5. Post that BS somewhere else. The BS stops here.
Here in Tucson, not a HCOL area, you can make $22.00/hr flipping burgers at in-N-out. A couple working 40 hours/week at that rate would bring in $88,000/ year. The poverty level here for a family of four is $33,000/ year.
what is ‘sportsball’?
It’s a term that encompasses any sports game televised for the consumption of people who sit on their $100,000 easy chair with a beer in one hand and a bag of chips on the table to their left.
Probably his way of talking about sports in general, interchangeably, for the purposes of his discussion.
Usually dismissively to be sure everyone understands how much he looks down on them (does not apply to his favorites from of entertainment, natch)
“They had believed the Fed’s forward guidance that interest-rate repression would continue for a long time.”
Did SVB et al really think the Fed would repress long-term rates anywhere near for a long-time?
March 9, 2020 the 20Y hit 0.87%. Outside of the Fed, who in their right mind would purchase that?
It didn’t pop up to 2% until almost a year later. And again, who in their right mind would buy a 20Y treasury at 2%? And there was certainly a ton on treasury issuance during that 12 months.
A 5th grader with a decent understanding of M2 / Inflation / Bonds could have called what was going to happen a whole lot sooner than a long time.
Silly Ben, The rich get richer. The top echelon always skate.
On February 27, 2023, Becker sold 12,451 shares of company stock, worth a total of $3.6 million. The sale was made through an executive trading plan filed with the U.S. Securities and Exchange Commission on January 26, 2023.[13] Following news of SVB’s dire financial circumstances on March 9, 2023, Becker urged venture capitalist firms to avoid panic in order to stave off a collapse.[14]
Following news of SVB’s failure on March 10, 2023, Becker was reportedly no longer on the board of the Federal Reserve Bank of San Francisco.[15] In the aftermath of SVB’s collapse, Becker received criticism from Senator Elizabeth Warren,[16] Representative Ro Khanna of California, and Mayor Matt Mahan of San Jose, who called for money from the stock sale to be clawed back and given to depositors.[17][18] Reports and photos show that immediately after the SVB collapse, Becker flew first class to his $3.1 million cottage in Hawaii, leaving his colleagues to deal with the failure.[19] Becker stated during his Senate testimony that, “We decided we were going to go to one of two places to be with family. Either we would be with my family in Indiana or her family in Hawaii.”[20]
From looking at the 10 year yield chart, it might be finishing 5 waves up. If so a yield drop to 3.5/4 could occur over the next year or 2 before yields go much higher
A couple of monthly closes above 5% probably means yields are headed much higher already
The TLT chart also looks to be ending a move down but getting to do or die time
UST debt is almost $40T, isn’t it? Is the UST debt the only government traded on the world’s markets?
What percent of the world’s public sector government issued debt is UST debt?
Does public sector government issued debt including UST debt trade in a vacuum or does it in effect ‘compete’ against debt issued by the private sector?
Which market is larger, the global government debt market or the Forex market?
Yes
No
Not that much but still too much
Competes. Credit supply impulses anywhere become credit everywhere.
Irrelevant because of stocks vs flows. It’s the stock of debt that matters, not the daily trading volume.
Bagehot’s Ghost,
Appreciate your answers. Here’s mine.
Almost every country issues government debt.
UST (marketable) debt is about 25% of the $120T traded.
Both public and private sector debt are assets and ‘compete’ amongst themselves and against each other in the marketplace.
In the globalized marketplace eventually the tidal ebb and flows of Forex and its carry trade ocean are where, in Buffett’s words, eventually you’ll find who’s been skinny dipping.
OT: Eventually the production of the Earth’s natgas, coal and crude fossil energy will peak shortly before the peak of the Earth’s human population.
So we disagree about Forex vs Bond market, ok.
But you should also realize that humanity’s future rests on nuclear power, for which there’s fuel for millions of years. And the maxing out of fossil fuels is a long ways off too.
In the meantime, more damage will be done to the world population by misguided idiots-in-power than by energy shortages.
@Bagehot’s Ghost
Hm, that’s only relevant if gen IV reactors can be produced at a rate low enough to compete with MW/h prices of wind and solar on land (+storage). That’s a big if, and it has been since 1950’s. New gen III reactors are not competitive atm, which is the reason why nuclear has stagnated, it’s just not economically feasible. And gen IV’s require a hell of a lot more difficult engineering.
Not since the 1951 Treasury – Reserve Accord has the FED done the right thing – ignoring interest rates. Kudos for Warsh. And Reserve balances with Federal Reserve Banks are down from July 3, 2025 by 241,410b, a tightening from the prior week.
The DIDMCA of March 31st 1980 was the primary driver of the bull market in bonds. The Emergency Economic Stabilization Act (EESA) of 2008 helped with its LSAPs with the acceleration of the payment of interest on interbank demand deposits from the FINANCIAL SERVICES REGULATORY RELIEF ACT OF 2006.
Professor emeritus Leland James Pritchard (Ph.D., Chicago Economics 1933, M.S. Statistics) never minced his words, and in May 1980 pontificated that:
“The Depository Institutions Deregulation and Monetary Control Act will have a pronounced effect in reducing money velocity”.
see: Was the 1982 Velocity Decline Unusual? John Tatom
see: See Fed Paying Interest on Reserves: “An Old Idea with a New Urgency”
https://www.wsj.com/articles/BL-REB-1411
April 29, 2008 11:02 am ET
Except the M2 velocity didn’t change for a decade afterwards. And then when it did change in 1991, it increased.
So is Warsh using the old pass the blame game and throwing Bessent under the bus? He says like magic, he does nothing and rates are tightening.
Bessent bails out the yen and Japan to calm the markets. Keep them from selling treasuries?
A little less treasuries bought. A little more selling. And more debt to issue and finance ? And the man said no more QE! Oh no.
Didn’t there used to be a guy posting here under the handle “ShortTLT” or something like that? Haven’t seen in a while. He must be making bank on these yield curve movements.
He may have changed his name again. He’d started posting under a different name, and then somewhere along the line, he changed it to ShortTLT.
This is how the internet comments work. When somebody is right about something, they use that knowledge to go off and be successful. Then they get rich and have much better things to do than to comment on the internet. A filtering process occurs where the only remaining commenters have all the wrong ideas.
As a non-financial example: Incels can comment on the internet all day long because they won’t be getting dates (due to commenting on the internet all day long).
Shorting TLT, if you timed it exactly right starting in 2020, would have doubled your money over 6 years, or an annual rate of 12%. That’s nothing to sniff at, but SPX tripled in that exact same time period, so it’s not exactly “quit your job” results.
The daily interest on the U.S. national debt is approximately $2.6 billion to $3 billion per day, driven by a total national debt nearing $40 trillion and average interest rates of about 3.4%.Breakdown of Interest CostsPer Second: ~ $30,188Per Minute: ~ $1.8 millionPer Hour: ~ $109 millionPer Year (Projected): ~ $1.2 trillion
When I look at the interest per second being paid by the USA, I’ll continue to swallow my Money Market Fund. The Fed really can’t afford to raise rates. I’ve lost 23% purchasing power of my dollar since 2020. Not very often you see termites being invited into your home to destroy what you have built. Inflation continues to the bull in the China shop. I trust Warsh and I’m really impressed with the Treasury Secretary. We need their Relentless Leadership.
All this stuff is fun goofball stuff. What you really need to look at is interest expense in relationship to tax receipts that are available to pay for it. I track this quarterly, last one on June 30:
https://wolfstreet.com/2026/06/30/inflation-nominal-economic-growth-to-the-rescue-the-us-governments-ugly-fiscal-mess/
this is why I take issue with folks who say that any increase (like 25bps) in the fed funds rate will cause unthinkable damage – and there are a lot of those doomsayers out there and I know you don’t want any of that stuff brought in here.. the economy is strong, it withstood huge rate increases a few years ago with little to no damage to show for it. If rates go up temporarily it only affects a small part of the total debt; whatever is new or being “refinanced”; as most of the debt is locked in at rates and rollover in an average term of like 5-7 years. If the fed really snuffed out inflation, then the government might even get a window where there could refinance the debt at low rates again. But nobody is going to get to borrow at low rates while inflation is our of the bottle. Sorry if this is goofball or braindead stuff. Great chart.
Thanks for posting the real data.
Grimp,
If rates go up (or down for that matter), doesn’t it affect the whole US and by extension the entire global economy? Even if the FOMC keeps the FFR unchanged, it affects the economy, doesn’t it? How much or how little is the question, isn’t it? Your own words reflect that, don’t they?
As for the folks saying any rate change can cause ‘unthinkable’ damage, just exactly who are you talking about? Me? You? Some dude wearing flashy clothes with a toothy smile selling gold on TV? Even the folks with $3.08T stashed in MMFs? What’s .0025 times $3.08, anyway? $7.7B? $2500 per million?
Debt, for the holder is considered an asset. If rates are changed the value of any issued and outstanding debt is changed, isn’t it? So if rates are raised bills, notes and bonds lose value. Sure that’s only paper loss, or deferred assets; unless or until you sell it, or hold it maturity.
Of course some folks think paper losses don’t matter. For those braindead goofballs I suggest they repeat that mantra as they use a handful of Franklins to light their wood stove. After all, firewood is renewable energy and bills are just paper.
Let’s call it a night with the words of the immortal bard, Warren’s ‘cousin’ Jimmy. “It’s a jungle out there kiddies, have a very fruitful day.”
P.S. Wolf, thanks for sharing your thoughtful and thought provoking offering and your forbearance with my observations. They’ll be another envelope headed your way tomorrow. Same as before, discount for cash, right?
How probable is it that Japan still has to repatriate their funds by selling their treasuries? Apparently the Fed intervened on Friday offering them a loan to support the falling yen. Bessent is signalling they need to allow bigger loans.
If those don’t work, Japan has to sell off their treasury holdings right?
So what they actually said was that the Bank of Japan, like other approved central banks, can use the Fed’s FIMA standing repo facility (SRF), where it can put its Treasuries up as collateral for USD cash. This replaces the need to sell those Treasuries to get the cash.
https://wolfstreet.com/2026/08/03/why-the-us-japan-joint-intervention-to-prop-up-the-yen-fear-of-treasury-yields-blowing-out-if-japan-becomes-a-forced-seller/
Remove the references to Japan and the USA and this sounds like a scheme thought up in Turkyie or Russia.
Interest rates on GICs,bonds etc. should be much higher at least in the mid 5’s to 6’s, 6%+. In Canada we are getting ripped off even more with lower interest rates than the US and no despite what the stats and government and their buddies say inflation is not lower in Canada than the US.
I have for years waited for higher long term interest rates and have been sitting on my TFSA room which is similar but better than the US roth IRA in terms of it’s conditions,laws etc.
I am thinking of putting my $109,000 in some long term provincial strip bonds at 4.9% and generate an average $10,000 a year tax free compound interest but think inflation and interest rates will be higher in the next 12 months.
“Robin Brooks, a senior fellow in economic studies at the Brookings Institution, said the coordinated intervention could ultimately weaken rather than strengthen confidence in the yen in his Substack post.
If Washington sold euros instead of dollars to buy yen, investors may infer U.S. officials were trying to spare Japan from selling U.S. Treasurys to finance intervention, he added.
Reports that the U.S. sold euros rather than dollars to buy yen surprised markets because coordinated intervention has traditionally been funded with dollar assets
“This kind of twist in my opinion undercuts the efficacy of U.S. participation, because it invariably will have markets wondering why the US didn’t just fund Yen buying out of Dollars,” said Brooks.
https://wolfstreet.com/2026/08/03/why-the-us-japan-joint-intervention-to-prop-up-the-yen-fear-of-treasury-yields-blowing-out-if-japan-becomes-a-forced-seller/
Yes…
From my article:
“The prior interventions by Japan failed to turn around the downward spiral of the yen; they just provided temporary reprieve before the yet started spiraling down again.
“Much tighter monetary policies by the BOJ – including lots of QT and much higher rates much faster – need to happen to permanently end the plunge of the yen. The yen is getting crushed by the BOJ’s crazed monetary policies from 2012 to 2022. That’s the root cause. What’s amazing is that they got away with it for so long. All monetary sins ultimately lead to the currency.
“Interventions are just temporary window dressing. And the big kahuna of interventions will be tested again.”
Mahalo!
The TLT bond ETF has never fallen below $80 since it began trading in 2002.
Not making any predictions, just an observation. It’s probably one more thing that’s rigged/controlled by the government.😁
Interest rates are still so low compared to when i was a young adult in the 70’s,80’s.Mortgage rates of 11% to as high as 23%. Today’s inflation,cost of living is crazy,out of control we should have 10%+ mortgage rates and CD rates in the 8% to 8.5% at the minimum.
I think I figured out the Warsh Game. Let the market do all the heavy lifting UNTIL something snaps. The FED’s toolbox is ginormous in terms of monetary measures. He is going to keep the FED governors “on ICE” as long as he can and only do something if necessary.
Might be a good strategy especially if you want to prove the FED is a useless entity and/or want to let it run as hot as the market can take – probably his orders from Trump.