
The gap between single-family rents and multifamily rents has widened massively. A look at 14 big markets.
By Wolf Richter for WOLF STREET.
The surge of inflation in 2021 and 2022 that would eventually reach a pace of 9% year-over-year was in part driven by spiking rents, both for single-family and multifamily rental units. These spiking rents accelerated an ongoing surge of new construction both of big multifamily rental developments, often towers with hundreds of units each, and single-family build-to-rent developments, where corporate money was invested to create large amounts of single-family rental supply, entire suburban developments of often hundreds of purpose-built single-family rental homes each.
Those rent increases fired up the construction machinery: From January 2020 through June 2026, multifamily mid-tier asking rents across the US surged by 33%, led by the metropolitan areas of Denver, CO (+69%); Seattle, WA (67%); Salt Lake City, UT (+67%); Los Angeles, CA (+65%); Portland, OR (+57%); and Dallas, TX (+56%).
Mid-tier single-family asking rents exploded by 52% over the same period, led by the metropolitan areas of Knoxville, TN (+74%); Providence, RI (+71%); Miami, FL (+70%); Charleston, SC (+70%); Tampa, FL (+65%); Cleveland, OH (+64%); Cincinnati, OH (+61%); Virginia Beach, VA (+61%), as per data from the Zillow Observed Rent Index (ZORI).
Most of the huge increases in mid-tier asking rents occurred in 2021 through 2022. In 2023 through 2025, rent growth flattened out in most markets, and in some markets, asking rents declined.
But there are some exceptions, such as San Francisco, where asking rents, after flat-lining, started surging again in late 2024 and are now spiking.
The gap between single-family rents and multifamily rents has continued to widen, reaching 29.7% in June at the national level, more than double the difference before the pandemic (between 12% and 14%).
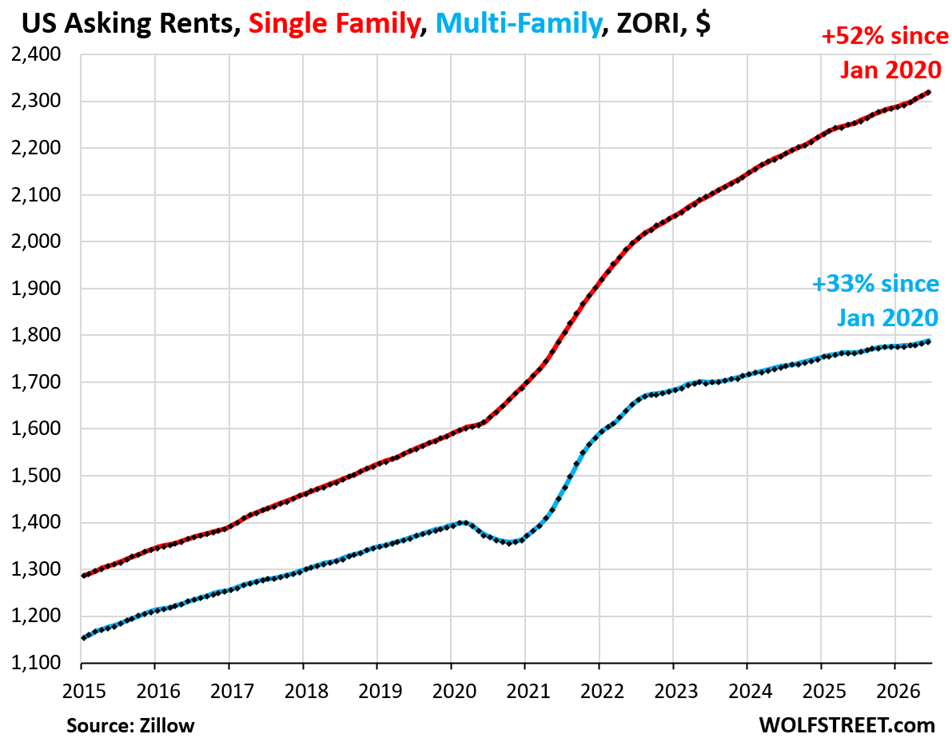
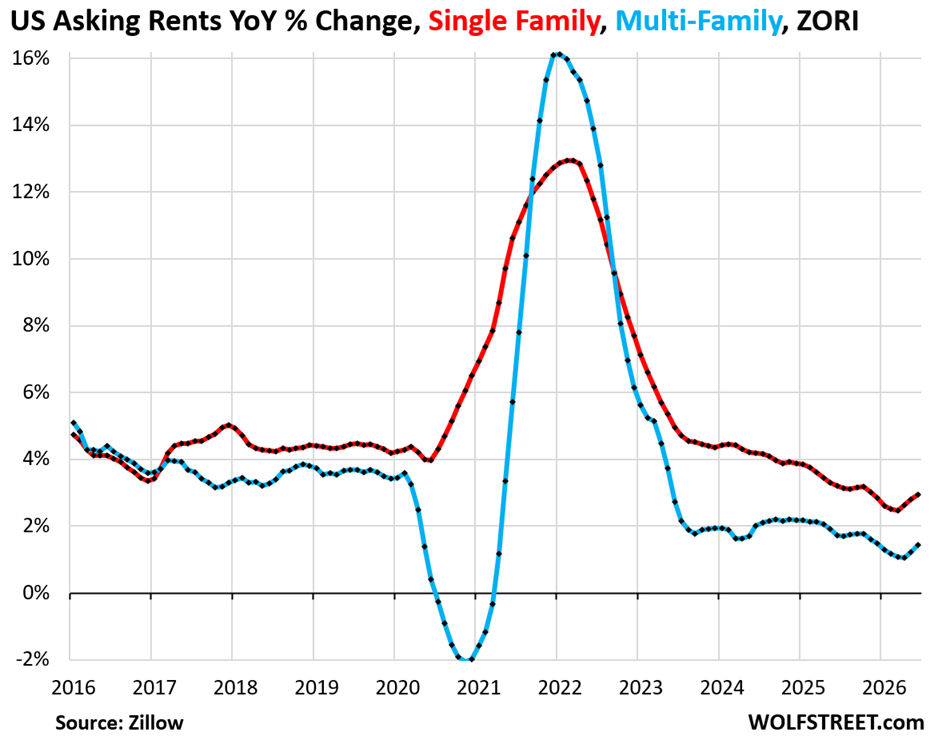
The year-over-year increases of mid-tier rents at the national level ticked up again in recent months from a low pace, and in June accelerated to 1.4% for multifamily, and to 2.8% for single-family.
These rent increases are low compared to the years before the pandemic, when rents increased by roughly 4% year-over-year. But they come on top of very high rents to begin with.
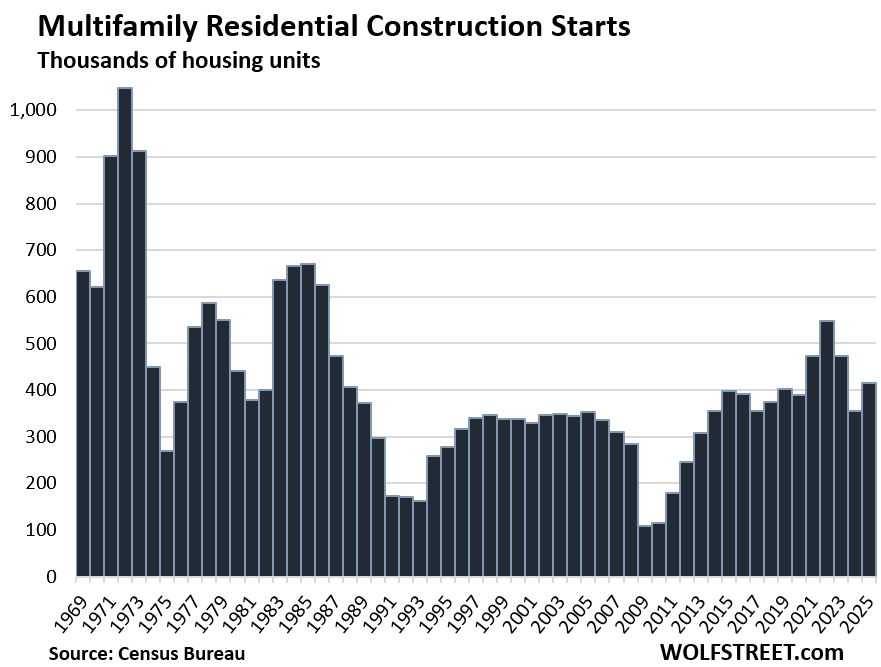
The onslaught of supply of housing units in multifamily buildings, as measured by construction starts, had already been running at multi-decade highs before the pandemic, and then surged in 2021 through 2023 to the highest level since the last boom in the mid-1980s. Even the slower pace in 2025 was the highest since the 1980s boom, except for 2021-2023 (see our analysis here).
As these units were completed, they added supply to the rental market. Even condos added supply to the rental market as condos have been a popular way for retail investors to get into multifamily rentals and face losing their shirts as condo prices plunged in many markets.
This new construction created higher-end supply, higher-end because that’s the only place where new construction pencils out (except when subsidized). And the onslaught of higher-end rental units and condos-for-rent put pressure on everything below.
But population growth suddenly slowed to a crawl (analysis and details here) amid the crackdown on illegal immigration and tightening up of legal immigration, when this flood of new multifamily construction came on the market.
In terms of single-family rentals (SFRs), build-to-rent has become the mantra. All big single-family landlords got into it, some collaborating with big homebuilders, others forming their own homebuilding divisions. And that surge of supply of new higher-end single-family rental properties, targeting higher-income “renters of choice” (who have the money to buy but choose to rent), has put single-family rents under pressure.

Who owns the housing rental stock? There are about 50 million rental units of all types in the US. About 15 million of them, or about 30%, are SFRs. About 82% of those 15 million SFRs are owned by mom-and-pop landlords with 1-10 rentals. The remaining 18% are owned by larger landlords, including a handful of giant landlords (see our analysis and charts of who owns the US rental housing stock).
While the SFR market is dominated by mom-and-pop, the multifamily market is dominated by big institutional landlords.
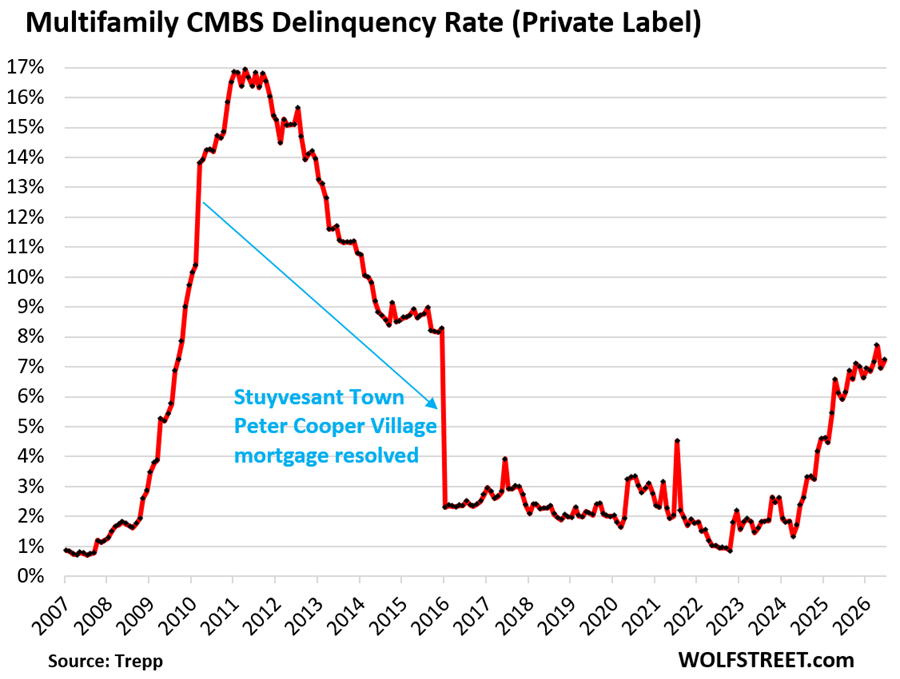
Since 2022, numerous big multifamily landlords have defaulted on their debts, and lenders seized properties or sold the debts to investors that then seized the properties, etc., and we discussed some of those processes here from time to time. The delinquency rate for multifamily Commercial Mortgage-Backed Securities (CMBS) surged to over 7% (data from Trepp):
But it varies dramatically from market to market.
Below is a sample of 14 big metropolitan statistical areas (MSAs), showing asking rents for single-family and multifamily properties, per the seasonally adjusted ZORI.
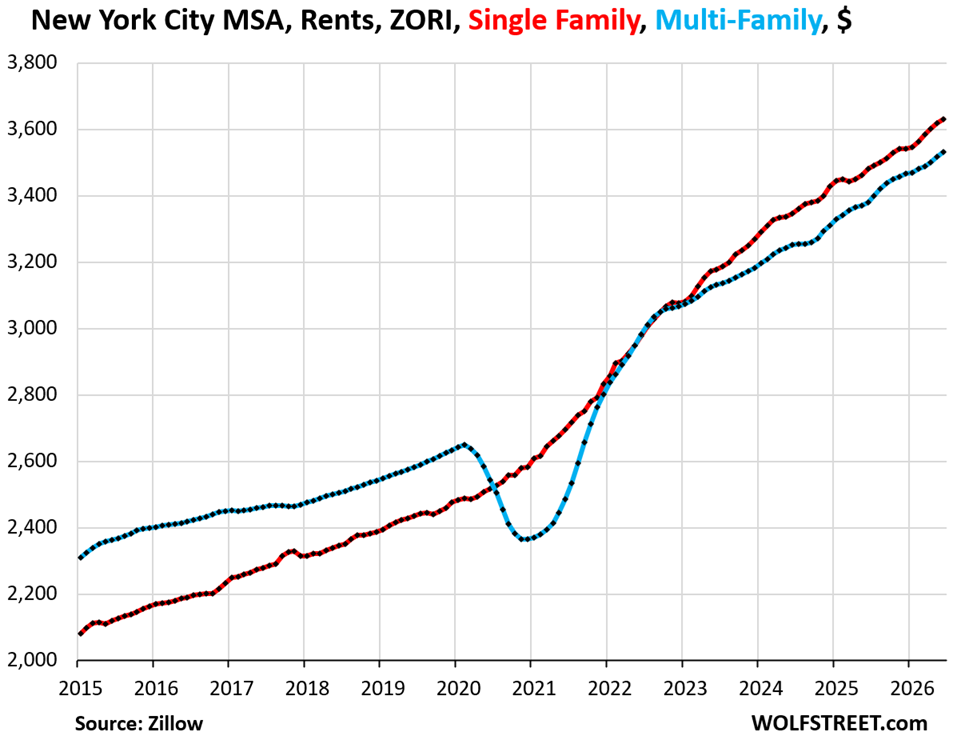
New York City metro:
- Multifamily ZORI: $3,351
- Month-to-month: +0.4%
- Year-over-year: +4.4%
- Since Jan 2020: +39%
- Single-family ZORI: $3,631
- Month-to-month: +0.4%
- Year-over-year: +4.3%
- Since Jan 2020: +52%
Single-family and multifamily rents are increasing in near-lockstep at a brisk rate.
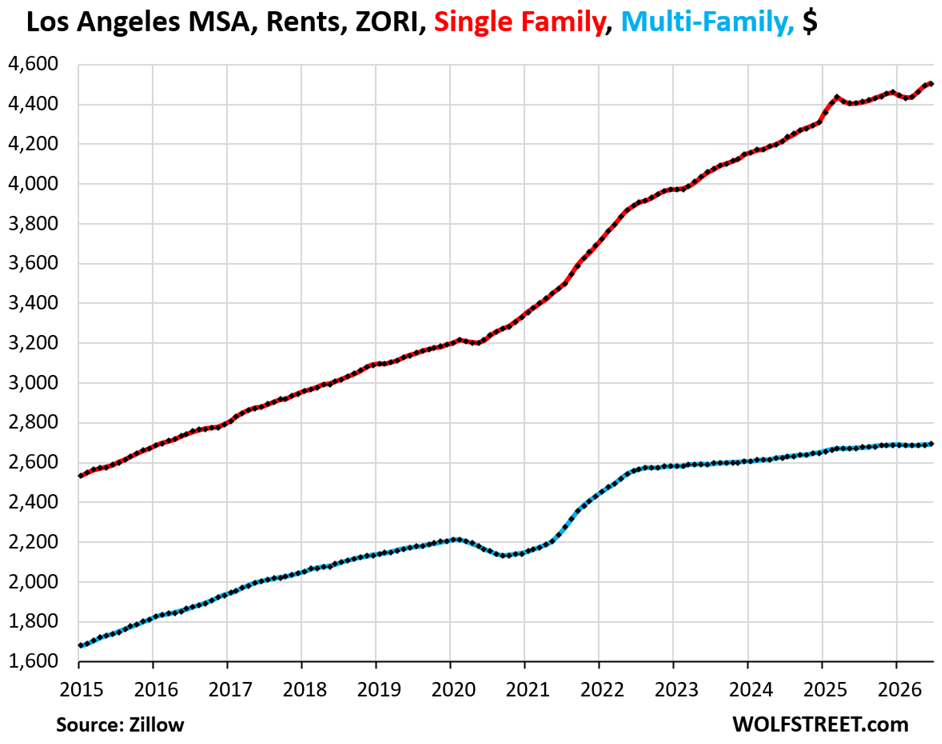
Los Angeles metro:
- Multifamily ZORI: $2,692
- Month-to-month: +0.1%
- Year-over-year: +0.7%
- Since Jan 2020: +26%
- Single-family ZORI: $4,506
- Month-to-month: +0.3%
- Year-over-year: +2.3%
- Since Jan 2020: +46%
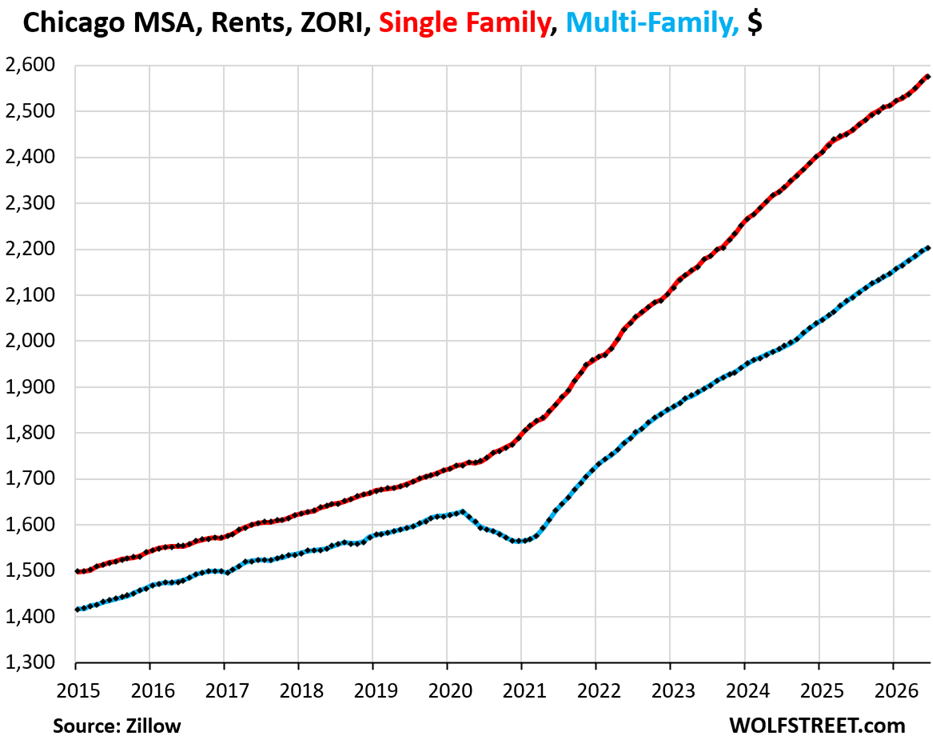
Chicago metro:
- Multifamily ZORI: $2,203
- Month-to-month: +0.4%
- Year-over-year: +5.1%
- Since Jan 2020: +40%
- Single-family ZORI: $2,577
- Month-to-month: +0.5%
- Year-over-year: +4.8%
- Since Jan 2020: +54%
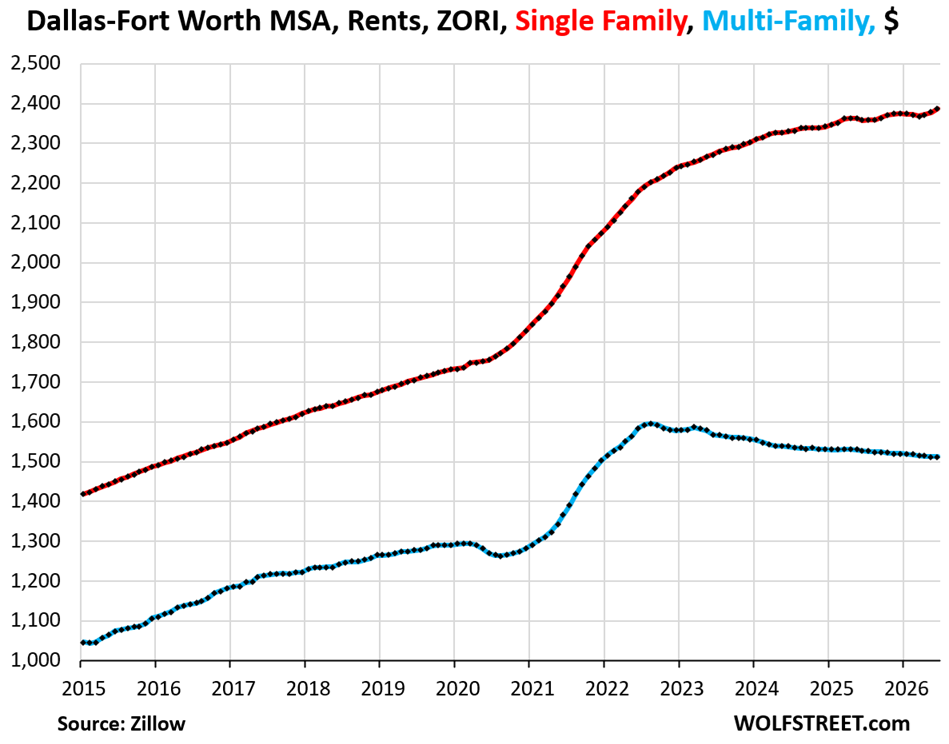
Dallas-Fort Worth metro:
- Multifamily ZORI: $1,513
- Month-to-month: -0%
- Year-over-year: -1.0%
- Since Jan 2020: +20%
- Single-family ZORI: $2,313
- Month-to-month: 0.4%
- Year-over-year: +1.2%
- Since Jan 2020: +42%
Multifamily rents have dropped by 5% from the peak in mid-2022. But single-family rents have continued to rise from record to record.
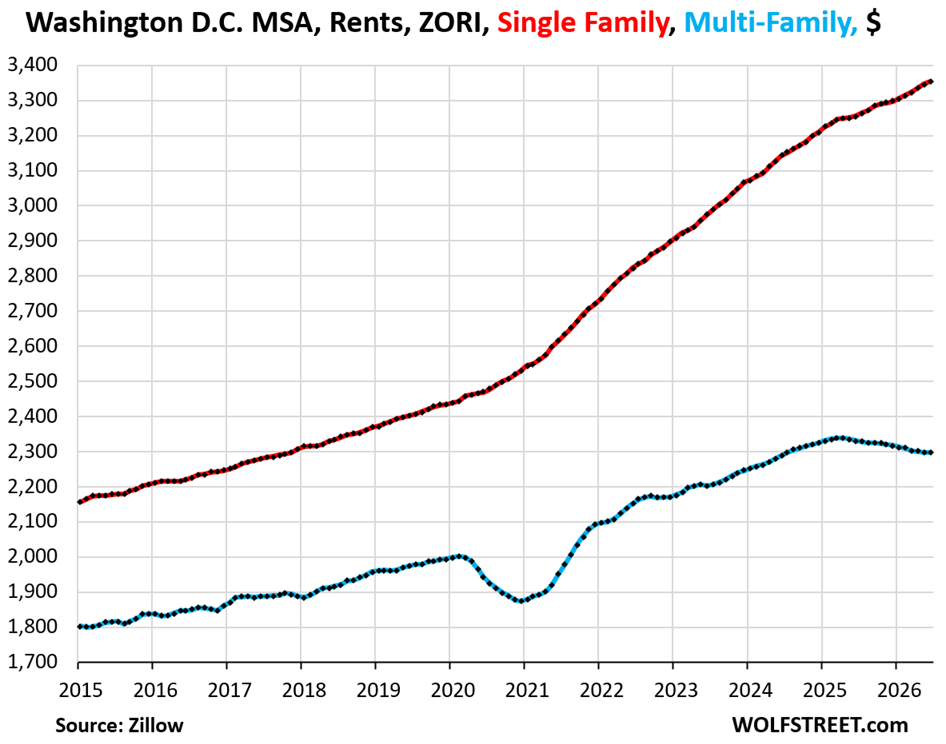
Washington D.C. metro:
- Multifamily ZORI: $2,298
- Month-to-month: 0%
- Year-over-year: -1.4%
- Since Jan 2020: +17%
- Single-family ZORI: $3,354
- Month-to-month: +0.2%
- Year-over-year: +3.0%
- Since Jan 2020: +41%
Same type of divergence is developing as in Dallas, with multifamily rents falling and single-family rents rising.
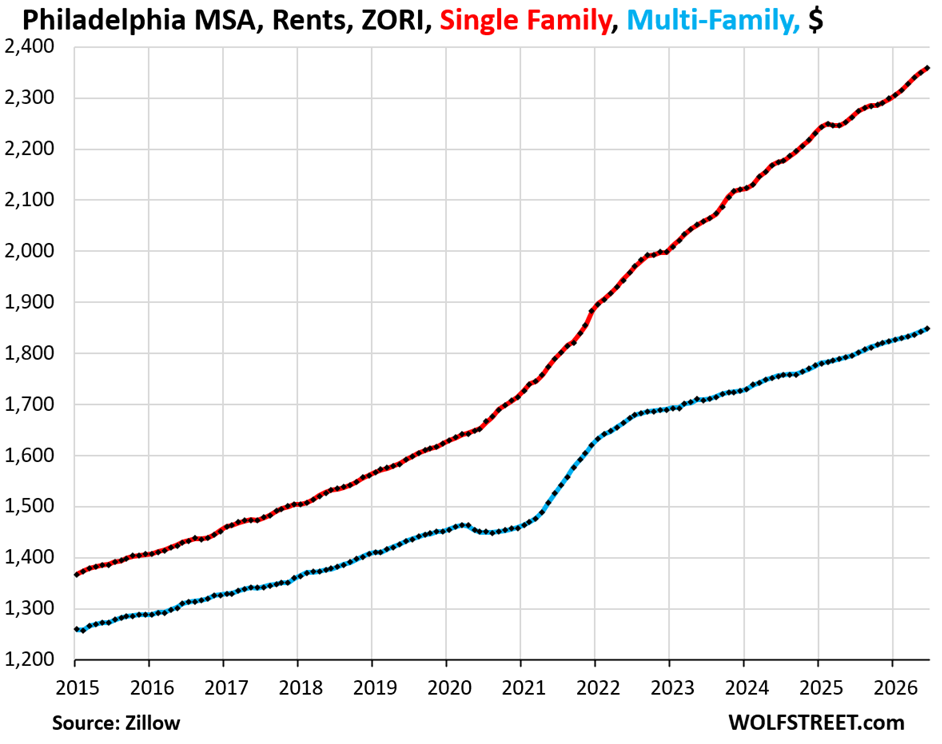
Philadelphia metro:
- Multifamily ZORI: $1,848
- Month-to-month: +0.3%
- Year-over-year: +2.9%
- Since Jan 2020: +31%
- Single-family ZORI: $3,144
- Month-to-month: +0.4%
- Year-over-year: +4.2%
- Since Jan 2020: +50%
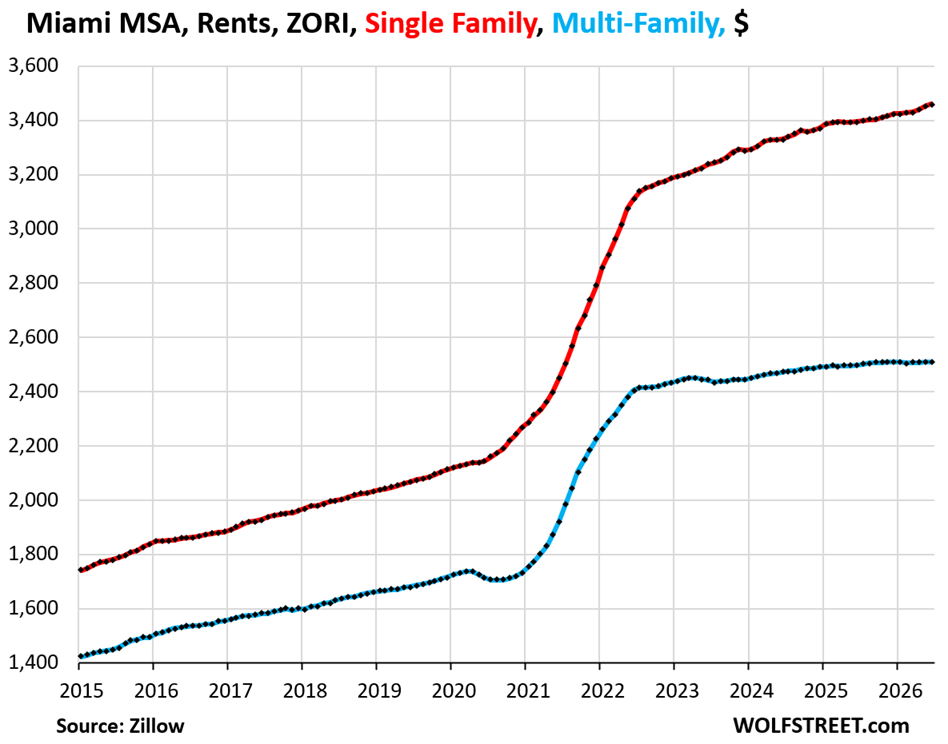
Miami metro:
- Multifamily ZORI: $2,501
- Month-to-month: +0.1%
- Year-over-year: +0.5%
- Since Jan 2020: +51%
- Single-family ZORI: $3,461
- Month-to-month: +0.3%
- Year-over-year: +1.9%
- Since Jan 2020: +70%
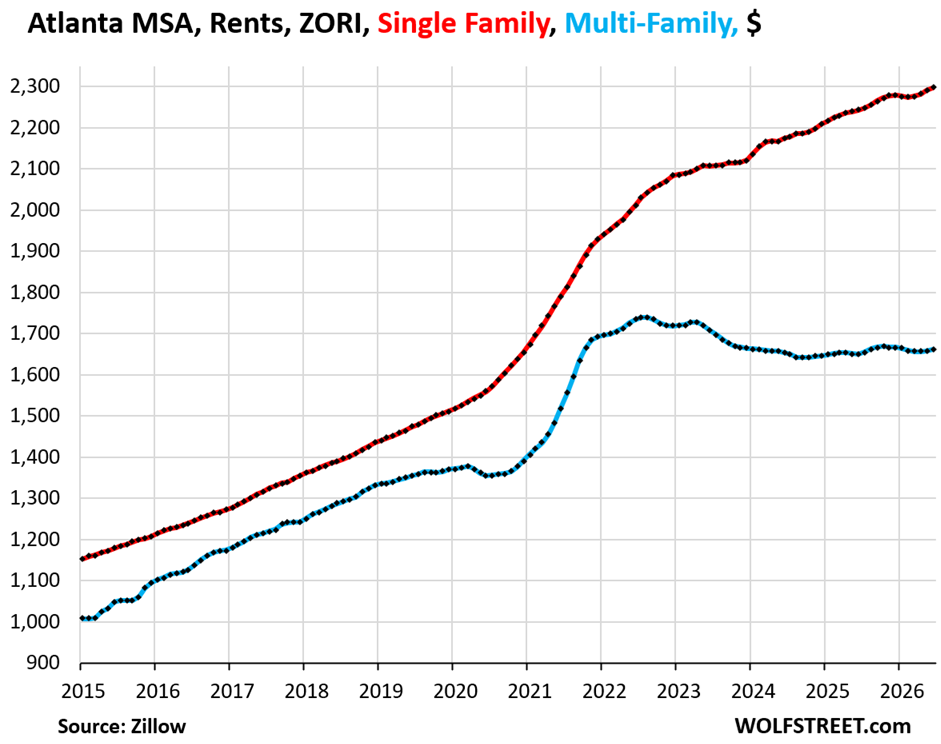
Atlanta metro:
- Multifamily ZORI: $1,663
- Month-to-month: 0.2%
- Year-over-year: +0.8%
- Since Jan 2020: +24%
- Single-family ZORI: $2,297
- Month-to-month: +0.3%
- Year-over-year: +2.4%
- Since Jan 2020: +59%
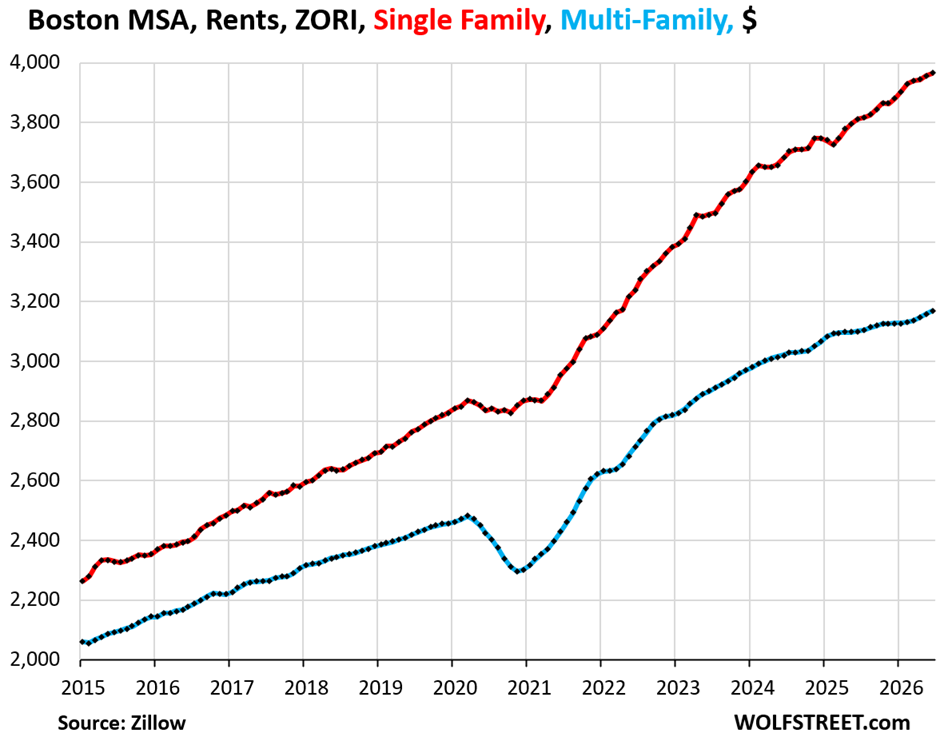
Boston metro:
- Multifamily ZORI: $3,168
- Month-to-month: +0.3%
- Year-over-year: +2.2%
- Since Jan 2020: +33%
- Single-family ZORI: $3,966
- Month-to-month: +0.2%
- Year-over-year: +4.0%
- Since Jan 2020: +47%
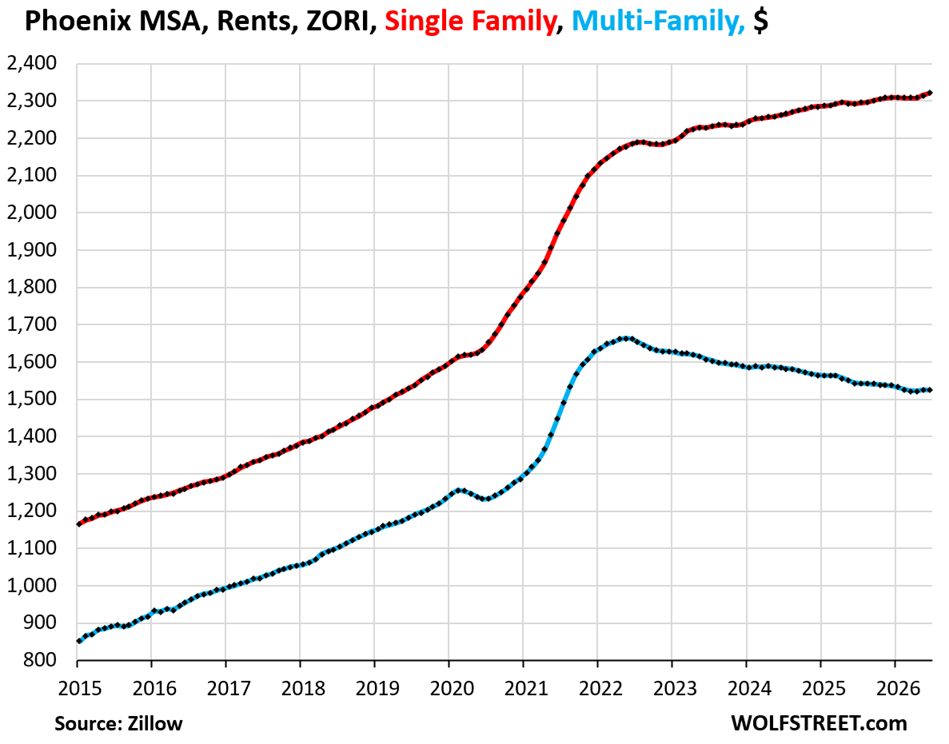
Phoenix metro:
- Multifamily ZORI: $1,526
- Month-to-month: +0.1%
- Year-over-year: -1.2%
- Since Jan 2020: +33%
- Single-family ZORI: $2,321
- Month-to-month: +0.3%
- Year-over-year: +1.2%
- Since Jan 2020: +57%
This divergence of rising single-family rents and falling multifamily rents (-8% since spring 2022) is now a common occurrence.
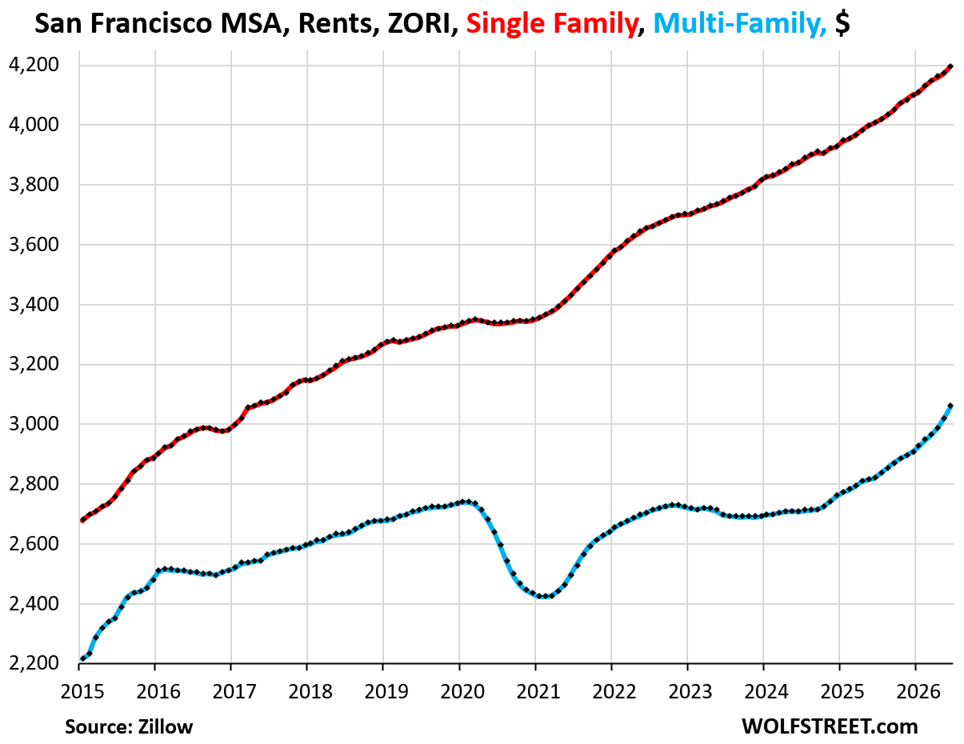
San Francisco metro:
- Multifamily ZORI: $3,058
- Month-to-month: +1.3%
- Year-over-year: +8.4%
- Since Jan 2020: +14%
- Single-family ZORI: $4,196
- Month-to-month: +0.5%
- Year-over-year: +4.7%
- Since Jan 2020: +28%
The AI boom has infected everything, including the rental market. Multifamily rents, after years of quasi-stability, started surging in late 2024 and have since then surged by 13%. June showed the biggest month-to-month spike yet (+1.3%).
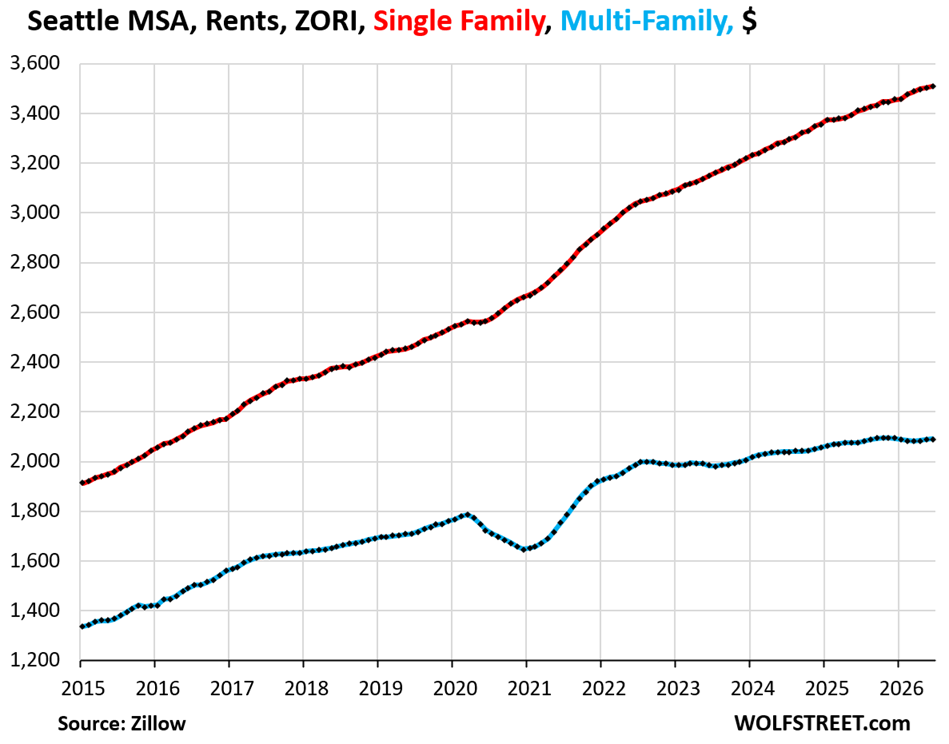
Seattle metro:
- Multifamily ZORI: $2,090
- Month-to-month: +0.1%
- Year-over-year: +0.6%
- Since Jan 2020: +23%
- Single-family ZORI: $3,510
- Month-to-month: +0.2%
- Year-over-year: +2.9%
- Since Jan 2020: +45%
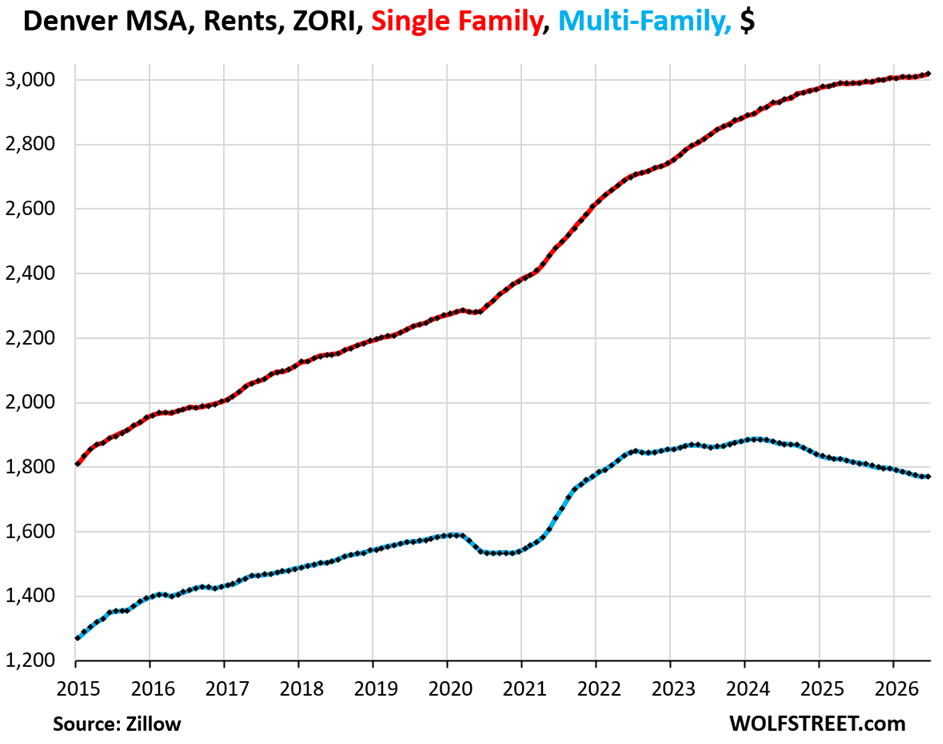
Denver metro:
- Multifamily ZORI: $1,725
- Month-to-month: 0%
- Year-over-year: -2.5%
- Since Jan 2020: +15%
- Single-family ZORI: $3,018
- Month-to-month: +0.2%
- Year-over-year: +0.9%
- Since Jan 2020: +37%
Again this divergence, with multifamily rents falling and single-family rents rising from record to record.
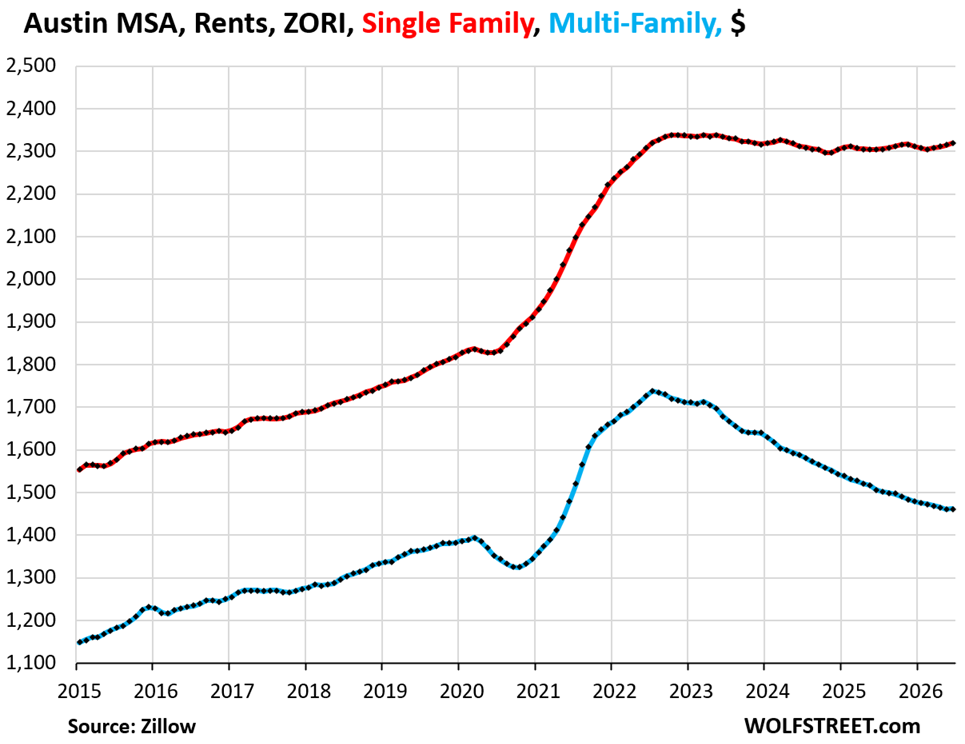
Austin metro:
- Multifamily ZORI: $1,463
- Month-to-month: +0.1%
- Year-over-year: -2.9%
- Since Jan 2020: +9%
- Single-family ZORI: $2,319
- Month-to-month: +0.2%
- Year-over-year: +0.6%
- Since Jan 2020: +32%
Multifamily rents have dropped by 16% from the peak in mid-2022, amid an onslaught of supply. Single-family rents eased only gradually, and over the past few months started ticking up again.
Enjoy reading WOLF STREET and want to support it? You can donate. I appreciate it immensely. Click on the mug to find out how:


Good. Rents, condo prices, house prices, car prices, food prices all need to stay flat (at most) for the next ten years. The top 10% has no idea and doesn’t really care how expensive life has gotten. I used to get casual dinner with the family for $50, now it’s $80. I don’t really care because I keep doing it, but for some people the extra dollars needed just to get through the month is killing them. We need zero inflation and even some real deflation for a long time to get the middle class back in the game.
“I don’t really care because I keep doing it”
Gee, I wonder why things have gotten expensive.
Come on, you know better. Show me the incentive and I will tell you the outcome.
Yes, we in the top 10%, even 3-5%, see it, but yes, it is a small part of our finances as compared to the bottom 50%. It has not slowed us down , only thing I did not spring for were LA Olympic tickets at 600-1200 per seat and >5000 for the opening ceremony. We will watch from home.
But yes, expensive restaurants, weekend trips, 2-3 vacations during the year, is no big deal as our disposable income is greater than 20K /month for two of us empty nesters! I wont provide the total but it is far more. Now one child is lower 50% and the other is 99% for their age so we help out and can clearly see the differences in their health, free time activities. The ability to help out with generational wealth is a choice one must make early. INVEST earliest as possible because the greatest effect is TIME. Live as far below your means as you can. If anyone invests 10-15K/yr at 5% simple compounding you reach 100 million in 90+ years (99% is pure interest). So it does take time to build that kind of wealth but anyone who has self control and selflessness to work with their next generation, they can easily make it happen. All of us have agency. Another way to think about it is that your money doubles every 10-12 years, if you can build up 1 Mil then dont touch it it will double 3-4x in your retirement years, 1 = 2 = 4 = 8 Mil to pass on. So My question is why isn’t everyone a multi millionaire. The math favors the consistent saver. The first 100K is hard…..DO NOT GET INTO EARLY DEBT FOR WORTHLESS MAJORS! Work hard, marry smart, work together, save as much as possible as early as possible, be a millionaire.
bUt rEnT oNLy eVeR gOeS uP!!
Move to a cheaper place! All the new fancy apartments with a few amenities, costs you 100’s of thousands in your savings 30 years down the road. Get past your first 100K asap, then keep it going.
Covetousness and jealousy are no way to live. No one NEEDS expensive vacations, expensive STUFF, etc. Challenge yourself to live without all the stupid movie services, get on websites that have this for free. Saved 2-300/month. NEVER purchase new cars, buy toyota or hondas used for cash. Drive them into the ground. Learn to service them yourself. See how minimal it can take you to live, the FIRST THING WITH YOUR PAYVHECK IS PUTTING MOST OF IT AWAY FOR SAVINGS/INVESTMENT. Everything else better be NEEDED or discarded.
It’s interesting that the SF market is so radically different from Seattle given the high tech concentration in both. I guess maybe there is a divide opening between “old” tech and “AI tech”.
I’d be interested if you have any thoughts on the medium term prospects for AI from an economic standpoint. Particularly, is there a bubble or not, and if so, what will pop it.
Don’t try too hard to compare them…completely different environments in most ways.
Seattle is a satellite hub for bay area companies. Costs are relatively less than the bay area and talent pool is healthy. By the time boom catches up to Seattle, most of the multi-millions have been minted. Seattle folks get high paying jobs in a more modest risk-reward situations.
I believe Seattle has had more housing of all kinds built compared to SF. The point Wolf is making is supply and demand are core factors. The AI hype may push the curve higher but the trend is established on supply and demand above all.
“Seattle is a satellite hub for bay area companies.”
Didn’t realize Microsoft and Amazon were bay area companies.
Otherwise, your comment is spot on regarding supply. Most tech workers there are living Eastside where there is relatively abundant land and long-standing upscale suburbia compared to Oakland, Freemont, etc which have a much more working class suburban background.
Big difference between San Fransisco and Seattle is huge IPOs leaving lockup. Huge pool of people suddenly receiving far more money than they ever dreamed of after living on a much lower budget. Time to reward oneself by buying the house of your dreams. Basic economics of a large number of people with large windfalls chasing a limited pool of real estate assets. Bound to be some trickle down to the rental market with new people moving in hoping to catch the next wave.
The “rentier class” OWNS congress, no surprise construction of single-family home to rent (not sell) to single families continues. Will employment and wages support this? That’s the question.
Hedge accordingly.
Hello Wolf,
When you state, ‘ The surge of inflation in 2021 and 2022 that would eventually reach a pace of 9% year-over-year was in part driven by spiking rents, both for single-family and multifamily rental units.’
What caused this ‘spiking’ of rents in the first place?
Appreciate all your import information and insights!
Thanks
Landlords jacking up rents and tenants paying those rents caused the spike in rents.
@Wolf – Sure landlords jacked rents & renters paid them. That sounds like a superficial answer at best and misleading at worst. The FED printed money which is why sellers raise prices & buyers can spend more. Moreover, people need a place to stay. Most cant just keep waiting forever for rents to drop or go to a cheaper place 2-3 hours away.
I am sure there are other reasons for rents going up, like under building, big landlords using software to collude on rental pricing. I don’t know which factor contributed the most to the price rise though. But lets not pretend that your explanation explains the situation.
Yeah, well fine and well, and nothing new here on this site. But that is NOT the mechanism by which rents exploded. And that’s what I was asked about when Matt asked: “What caused this ‘spiking’ of rents in the first place?”
I was not asked about what helped trigger the worst inflation in 40 years. The Fed had nothing to do with rents. It did have something to do with mortgage rates, by pushing them down via QE, but that’s a factor in the home sales market, not in the rental market. If anything it might have caused rents to DROP because your good-natured landlords would have passed on those lower mortgage rates to their tenants, no? 🤣
There are hundreds of articles on this site about the Fed’s involvement and culpability, and you just came snowing into here and missed them all, so fine.
But rents spiked because landlords jacked them up and tenants paid them, which made landlords more confident and they jacked up their rents further, and tenants paid them. That’s how the mechanism of inflation on the ground works: companies raise prices, and consumers pay them, rather than refuse to pay them, which gives companies the confidence to raise prices further, and to agree to raise wages of job-jumping employees because companies more than make up for the higher costs with higher prices, etc. etc.
Inflation doesn’t calm down until consumers refuse to pay higher prices. Price resistance by consumers is the only thing that slows inflation. The Fed can force that price resistance in various ways, such as by dramatically increasing the costs of borrowing, or by pushing the economy into a recession with higher unemployment, where consumers worry about everything, and cut back on spending, and what they do spend, they spend more carefully, and if a company raises prices in this environment, its sales collapse because consumers will buy somewhere else. That’s how it works on the ground. It’s a very complex mechanism, but you can observe in real time.
When I bought my home from the landlord, it came out in the title work that the county reassessed the property in that time frame. It was nearly a 50% increase in the valuation that spiked the property taxes. Our rent slowly climbed, after that, by about 30% over two years. Truth be told, it was 100% the cost of taxes getting passed on to the renter. Government joining the inflation party may have been the primary issue in many other cases.
Solution to that is political activism or some kind of pressure. In my Province of BC annual rent increases are limited to 2.3% as it is tied to our consumer price index. So, does your Govt work for just the owner class (donor class) or for the general population? For everyone?
I am a landlord and get seriously irritated by being tarred with the greed brush. I rent a cottage to a fine young couple just starting out, a rate 2/3 of what I could receive. Maybe 1/2. And, I told them last year there would be no rent increases for a while as other costs were rising for them. The value of my property has increased a huge amount these past 20 years. That is plenty to be thankful for.
Yes, my renters do cover the taxes….and insurance, upkeep, etc. My profit for the hassle is in the value of my land. It isn’t just about income.
Renters are people, not just dollar signs. The relationship between landlord and tenant also works both ways. I always know if I need a hand with something they will be here in an instant. I also don’t have to worry about them trashing the place etc etc.
Yeah, governments can lag in updating assessments, or rather the modeling firms they contract with. Also, the government (local I guess we’re focused on here) is a large purchaser and payer of wages, and so feels the pinch of overall inflation in the economy. It’s hard to not buckle when the firemen start complaining about grocery bills.
Enough with the whining! Landlords don’t “jack up” rent anymore than kid’s jacking-up the price of lemonade, the Catholic schools jacking-up tuition or museums jacking-up admission fees. Like all goods & services, Rent is the confluence of supply, demand and costs. It doesn’t occupy a special unique seat on the economic spectrum. Contrary to the belief of many, it’s not a Landlord’s duty to provide housing! It never has been. If a person can afford my rent, great. If they can’t – don’t make your problem mine.
Can you not read my simple sentence, all 3 parts of it? “Landlords jacking up rents and tenants paying those rents caused the spike in rents.”
Part 1: “Landlords jacking up rents…”
Companies, including landlords, ALWAYS try to charge the maximum price that will still allow them to obtain their sales objectives (in a landlord’s case, keep the units occupied and fill vacant units). If a landlord raises the asking rent too high, the unit sits vacant and the landlord will cut the asking rent until it’s filled. “…landlords jacking up rents” is part 1. If you don’t understand that, you understand nada.
Part 2: “…and tenants paying those rents…”
Buyers, consumers, tenants, etc. will normally resist high prices hand shop around and give their business to someone with a lower price. That is the ONLY control there is on price increases for consumers (consumer price inflation). If you don’t understand that, you understand nada.
Part 3: “…caused the spike in rents?”
The two parts combined, “Landlords jacking up rents…” PLUS “…tenants paying those rents…” instead of resisting the higher rents, that combination is what caused the spike in rents.
I cannot dumb it down any further.
Thank you Wolf for dumbing down landlording to this landlord. Now how about splainin guns v. butter?
Good morning Wolf,
Would you have the same sfr vs mf chart for the Charlotte and Raleigh area?
There are 116 requests in the pipeline that came first, but the pipeline experienced a catastrophic failure and nothing is coming out at this end anymore.
Do rent values include incentives? I’ve been looking online and areas like FL Gulf Coast and Austin keep the asking rent high but some new towers are offering 3-4 months FREE to move in on a year lease. Effective lease becomes 25% lower than signed lease…..
Good point W:
As a 3rd gen FL ”real estate” and construction guy in my early 9th decade, I can testify, it’s clear that FL is, once again, in a ”build more and more” situation that has ended previously with HUGE crashes…
While I am very clear that ”past performance does not guarantee future results.”
I am also aware that in my lifetime FL RE has tanked several times, worse in those areas where the bubble was worse, etc.
I am not about to predict anything, having learned from Wolf’s Wonder,,, but IMVHO, FL, along with many other locations is/are due for a massive correction.
I pounded my first nails at Rotunda West circa 72/73. After a month I was so “experienced” i was hired as a “fix it” guy following after a crew from Georgia or Alabama(as i recall). Those boys were tape measure challenged. I’d have to relocate windows in the condo exterior walls, doors, etc. before the exterior sheeting crew came by. Ar Rotunda, the crew boss didn’t like to spend more than 5 days from start of framing to dried in on a house. Quality may have suffered. :)
I’ve similarly heard Denver was notoriously a boom and bust market from every long time resident. However it’s been a long time since a true bust….
New builds are doing anywhere from 1-6 months free rent. Sfh rentals are taking a month or two of vacany to rent if they’re still priced for 2021 and usually slowly marking down the asking rent.
I’m not saying it’s cheap, it’s still got aways to go before falling back in line with local incomes.
I’m wondering why more of this isn’t showing up in the numbers? Is it that people don’t move annually so only a fraction of rentals are experiencing this? Or is that the incentives aren’t included?
Regardless the Denver infrastructure was not setup to support the influx of people that came during COVID. The traffic on i25 is now worse than Chicago and Atlanta and constant car accidents. I70 is worse, even on weekdays now. And the public transportation is terrible. I don’t know where they think all the high income demand is coming to come from at this point Salt Lake or Washington are better choices. But hey maybe we’ll legalize cocaine or something to create a 3rd wave of mass migration.
Just helped a friends family find and secure a 3bd room in Cherry Creek, super trendy area and with so many overpriced rentals.
One building had almost a 60% vacancy rate. There are so many pie in the sky asks that all I had to do was lead on 6 potentials against each other until one gave in heavily.
One building attempted 10 months free on a 3 year term but the space wasn’t as nice as the final place they settled on.
Rents in Denver are dropping. My daughter just signed a lease for 1 BR in the Highlands 300$ less than her previous lease, in a brand new building.
And traffic here isn’t remotely as bad as Chicago or Atlanta. I-25 traffic is substantially better now than prepandemic because of WFH.
Isn’t this fundamentally because the Florida economy just doesn’t have strong underlying economic drivers? It seems to depend mostly on people bringing spending power from out of state via retirement, tourism, or LATAM and then relying on their consumption to drive the economy. I’ve always wanted to live there, but then remember the scarcity of six-figure jobs.
These are asking rents, not actual rents. Asking rents are the landlords’ wish-list rents of their vacant units that sit on the market as advertised for rent. Incentives are not included. Some of the units may not find takers at all at this advertised rent, and rent gets cut until the unit gets filled. That is the nature of “asking rents.”
To see how actual rents, paid by actual tenants, changed over time, we go to the best rent index we have, the CPI for Rent of Primary Residence. But the data is not split by single-family and multifamily. So I cannot use it for this comparison of single-family v. multifamily.
@Wolf, the big multifamily landlords often do not drop rents, or drop it by tiny amounts. They offer incentives like 1-2 months no rent instead of dropping the rent price by that amount, to prop up the rents. Have you tried to look at the listings of big landlords ? It looks like you are operating at a 50k feet level. Plebs like me actually rent and see the ground level realities.
You can to go the websites of landlords like Equity residential in any city to get see the ground level realities.
The big landlords do drop rents to fill units. All you have to do is look in their quarterly earnings reports of those that are traded publicly. They disclose several figures: new lease rent growth (signing of leases with new tenants), renewal rent growth, and “blended.”
For example Invitation Homes, one of the largest single-family landlords reported for its latest quarter:
renewal rent growth: +3.7%
new lease rent growth: -3.0%
blended rent growth: +1.6%
https://www.sec.gov/Archives/edgar/data/1687229/000168722926000030/q12026supplemental.htm
Wolf, thanks so much for reports like these, and the substantial work that goes into them. I subscribed to WS mainly to learn more about interest rates and other factors that affect my fixed-income investing. I paid less attention to your real estate and related reports. But no longer. I now see they provide some additional insight into this vast, complex, constantly changing system of our economy. Nobody will ever understand it thoroughly but these glimpses are important. So, again, many thanks. And thanks also to the commenting subscribers.
If interest rates rise, then in markets where rents plummet will it be worth people’s while to sell their houses and rent instead? Especially if, say, they are moving from a part of the country with high house prices to a part with low rents? Has that happened before in the US?
(If so, what might they best invest their released capital in?)
Well if everyone sells their house, then housing supply increases and housing prices decrease. Likewise rental demand increases and prices increase. It’s ultimately a market like anything else.
Essentially, there is no housing shortage. It’s another made up narrative, just like boomers not selling their homes and moving into retirement communities being responsible for not enough inventory in the market.
Agree. Vacant homes should be taxed like they’re doing in NY. Airbnbs with over 30 rental days a year should be taxed as commercial businesses and only be allowed in commercially zoned districts. And we should ban purchases of real estate by foreign buyers like Canada did.
There’s lots of housing supply sitting empty or being run as hotels despite being zoned as residential.
🤣❤️ nailed it
Starting to see a lot of homes listed that clearly are / were STRs based on the photos (you can see mandated safety signs, or placards with info/guest requirements).
As Wolf has pointed out, the “low inventory” narrative is a result of changes in transaction speed largely owing to the internet. It is not an actual shortage of units. But that said, the price of housing has been distorted by bad policies, both monetary and fiscal.
I don’t think you are following this if you don’t mention price once. There has never been an absolute lack of supply, but a mismatch between the amount those who need shelter need to pay compared with historical trends. Specifically, buying a SFH in a good school district is now nearly something only the top 10% can muster.
Are we ever going to see any cities with real rent deflation other than Austin?
Multifamily rents deflated in lots of cities. Of the 14 MSAs listed here, multifamily rents deflated in 6 of them: Dallas-Fort Worth, Washington DC, Atlanta, Phoenix, Denver, and Austin.
I think rent deflation is happening in almost all of USA.
Companies are hiding rent deflation with give 2-3 months free with 1 year lease contract.
Well to get that you’ve got to build like Austin + SA.
A lot of this is just a lag effect. I first moved to Austin in 2008 when I was in my 20s. Back then it was genuinely quite “cool” and “quirky”. Moved away in 2011. By the time I was in my MBA program in 2013-2015, every single marketing presentation deck by a decided uncool classmate cohort was based around “debuting the product at SXSW” and “opening stores in NYC, LA, and Austin”. I’m not confident many of these people had ever even been there, but it was embedded as a place young cool people lived. Since then, I spend a few weeks several times a year there visiting my ailing parents who live in the area. It’s amazing the changes–they built a skyline in ten years. And whole streets that used to be run-down SFH are lined with shoddy MFH. Likewise hillsides that were covered in cedar trees are now exurbia. I imagine it’s like how the LA suburbs exploded in the 1960s-1980s. Of course, now it’s full of late-stage trend followers and people like me in their 40s who thought it was cool in their 20s, so not anywhere near as nice, but you can much more easily find legit tech jobs and six figure salaries.
Treasury market on verge of worrying milestone not seen since 2007…
30-year yield raises alarm…
Fed’s favorite inflation tracker is getting an overhaul…
Oil Back Over $95 a Barrel…
Interesting stuff.
Thanks
The data is only getting to get skewed more and more, as more property managers are resorting to algorithmic price changes.
I had a relative looking for a condo recently and the condo’s rent was only guaranteed for the day he was quoted for it. The next day the same quote was $210 higher. I couldn’t believe what I saw.
Most (though not all) of the cities where the SF rents exploded are 2nd tier cities with lackluster reputations or worse. Housing prices had been cheap with often sub- optimal job availability.
When renters were no longer tied to a job location due to covid they were free to spread out. Most of these cities do have redeeming factors of one type or another and the word got out. Enter the flipper industrial complex and their subsidiary – Buy to Rent at maximum price. That’s where the price increases come from.
Good lord, those charts do a great job of showing how much of a mess federal intervention in the economy created starting in late 2020.
The massive and growing rent gap between SFH and apartments in most markets may represent the dying gasp of the American dream. The people paying up for boomer-dream back yard luxury will save less and be less wealthy than their apartment dwelling peers. As the older generation leaves their SFH’s in undermaintained shambles, to be purchased at extreme prices by the people who still believe in the old dream, a cultural shift will take place. Living in a SFH will begin to be seen as the financial albatross it is.
A similar cultural shift was seen after a whole generation of young people took on crippling debts to attend “prestigious” colleges. Now it seems like a winning move to avoid such debts whenever possible. But of course there are still plenty of people trying to pursue the old way. Enough to support prices for now.