
Sales sag in all regions, plunge the most in the Midwest, drop to lowest for June in the South. Demand stuck in the deep-freeze.
By Wolf Richter for WOLF STREET.
Pending home sales plunged by 5.4% in June from May, seasonally adjusted, to the lowest level for any June on record, down 0.3% from the abysmally low levels in June last year, down 36% from June 2021, 37% from June 2020, 34% from June 2019, 32% from June 2018, and down 20% from June 2011, during the Housing Bust, according to data from the National Association of Realtors. Its data only goes back to mid-2010.
This is now the fourth year that demand has been in the deep-freeze, amid the highest supply of existing single-family homes in 10 years and of existing condos in 14 years.
Pending home sales fell in all regions, with the index plunging by the most in the Midwest, plunging to record lows in the West, and plunging in the South to the lowest level for any June and the sixth-lowest for any month in the data’s history going back to mid-2010 (historic data via YCharts):
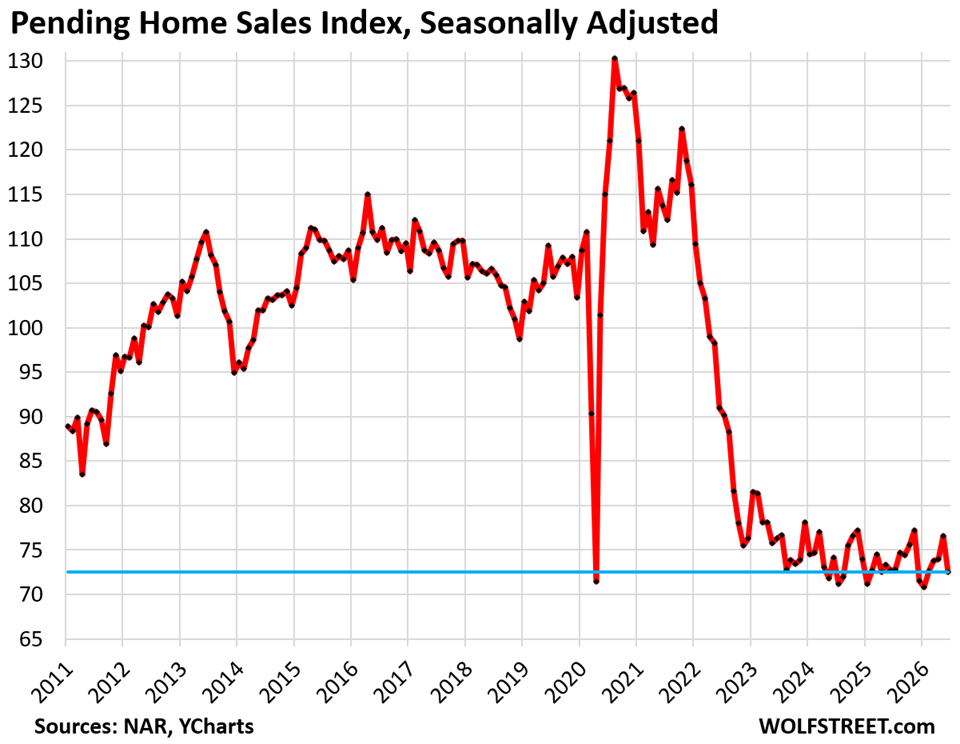
The metric of pending home sales tracks contracts that were signed in June but that haven’t closed yet and could still get canceled because buyers cannot afford homeowner’s insurance, or cannot sell their own home, or for other reasons. The rate of cancellations has been running high.
Pending home sales by region.
A map of the four Census Regions is posted at the top of the comments below.
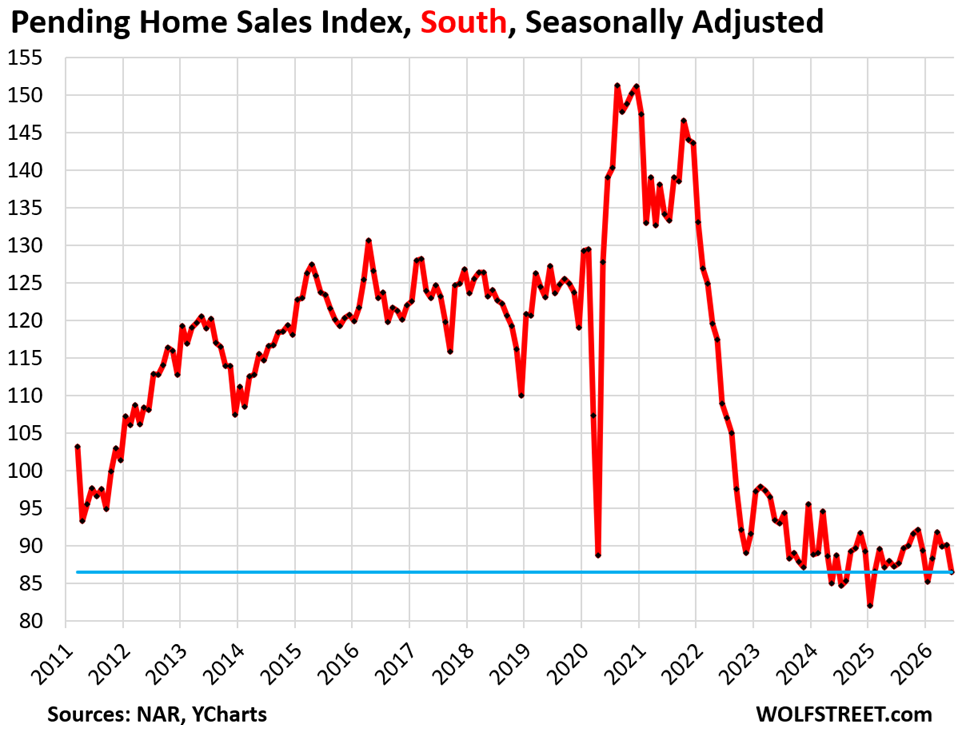
In the South, pending sales plunged by 4.1% in June from May to the lowest June on record, the sixth lowest level of any month on record, seasonally adjusted.
Compared to June in prior years:
- 2025: -0.9% (year-over-year)
- 2024: -2.6%
- 2023: -7.0%
- 2022: -20.7%
- 2021: -35.6%
- 2019: -32.1%.
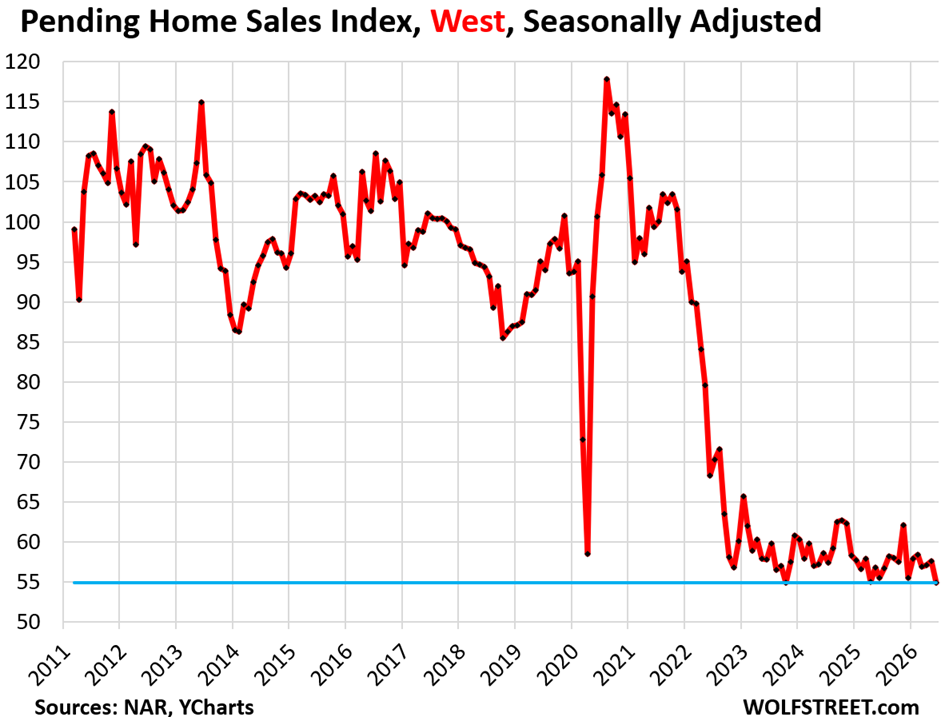
In the West, pending sales fell by 4.7% in June from May, seasonally adjusted, to the record low in the data, shared with October 2023.
Compared to June in prior years:
- 2025: -1.1% (year-over-year)
- 2024: -6.3%
- 2023: -5.0%
- 2022: -19.6%
- 2021: -44.8%
- 2019: -42.3%.
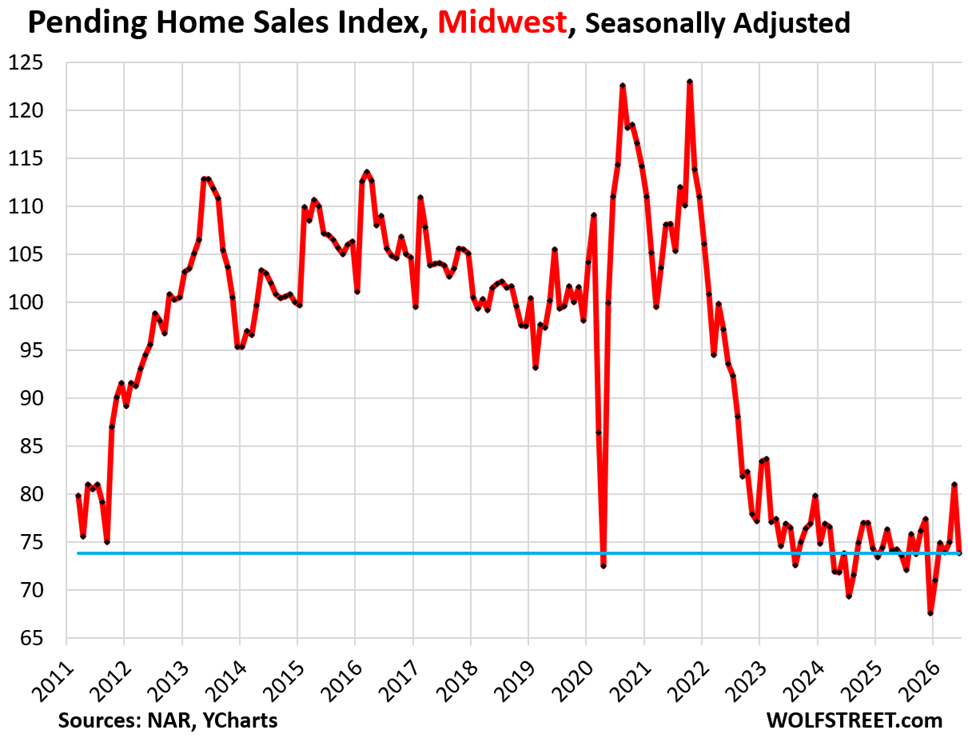
In the Midwest, pending sales plunged by 8.9% in June from May, seasonally adjusted, the biggest drop among the four regions, and more than undoing the increase in the prior month. Back to the middle of the deep-freeze range. December was the record low in the data going back to mid-2010. Compared to the abysmal levels in June last year, pending sales were up by 0.3%.
Compared to June in prior years:
- 2025: +0.3% (year-over-year)
- 2024: 0%
- 2023: -4.0%
- 2022: -21.2%
- 2021: -31.8%
- 2019: -30.0%.

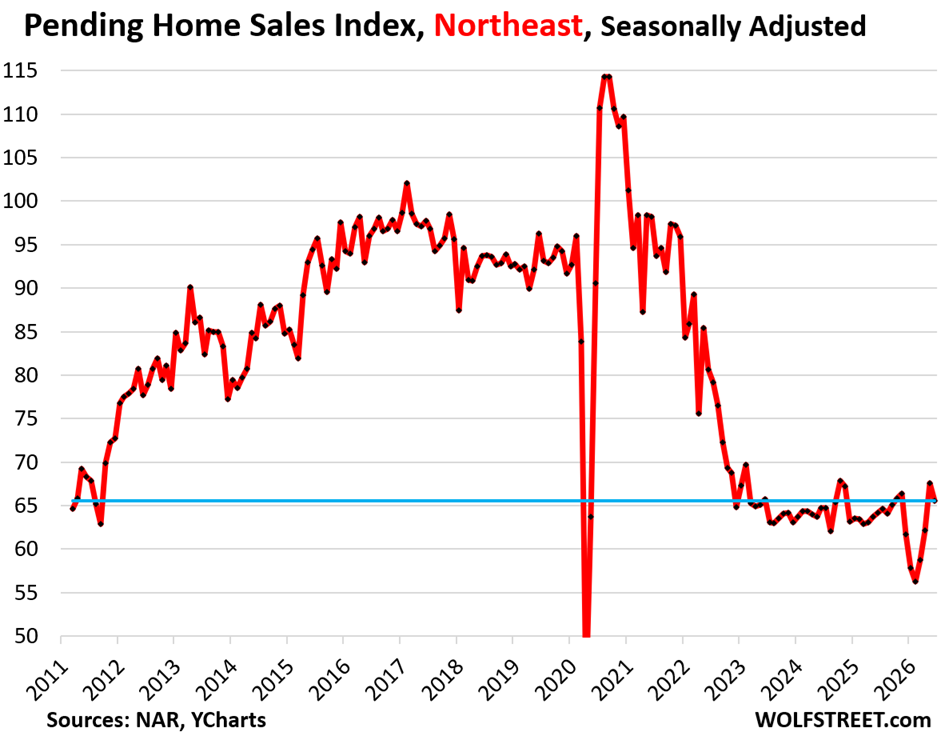
In the Northeast, pending sales fell by 3.0% in June from May. Though that was a substantial decline, it was the smallest decline among the four regions.
Compared to June in prior years:
- 2025: +2.2% (year-over-year)
- 2024: +1.4%
- 2023: -0.2%
- 2022: -18.6%
- 2021: -33.2%
- 2019: -31.9%.
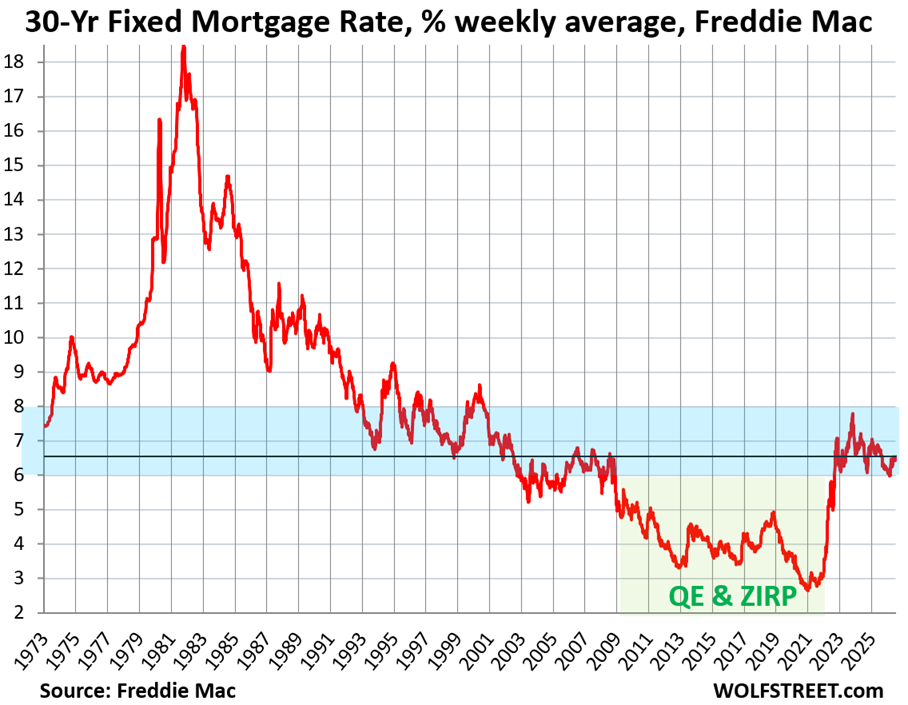
Mortgage rates in June were a little lower than now, averaging around 6.48%. In the latest reporting week, they climbed to 6.55%, according to Freddie Mac today.
Mortgage rates have been in this range since September 2022, and mostly higher than that in the decades before 2009 before the Fed kicked off QE and its zero-interest-rate policy. And the housing market – buyers, sellers, and everyone in between – needs to get used to those rates.
These mortgage rates are not high in a historic context. They’re only high in the context of the years of QE when the Fed purchased trillions of dollars of Treasury securities and mortgage-backed securities in order to artificially repress mortgage rates. This immense bout of money printing eventually triggered the worst inflation in 40 years and the worst home-price explosion on record, leading to home prices that are now too high and are a liability for the economy. Those too-high home prices are part of the hangover that the housing market is now trying to get over.
In case you missed it: Supply of Existing Single-Family Homes Jumps to 10-Year High, Condo Supply to 14-Year High. Sales Slip Deeper into Deep Freeze. Mortgage Rates Rise to 6.49%
Enjoy reading WOLF STREET and want to support it? You can donate. I appreciate it immensely. Click on the mug to find out how:


The four Census Regions of the US:
Sales Prices being reported can include a myriad of concessions. Lennar reported their prices re off 25% since the peak and also currently average 12.5% in Concessions.
Sales Prices are being Propped Up by the Stilts of Concessions in both the new and resale market.
Data sources do not report the details of what was included in the sales price.
Anything of value given or paid for by the sellers needs to be deducted from the sales prices, before any other adjustments are made for market conditions, location, lot size, or amenities.
Most residential appraisers are not given the time nor are they paid an adequate fee to do the verification’s that need to be done. This is pretty much an industry wide problem for those appraisers who only dolender work. It is something that is not being talked about.
Homebuilders in genereal report average sales prices net of all incentives, including the costs of mortgage rate buydowns. So the average sales price from Lennar includes all that. Lennar breaks out the cost of incentives per home separately, but those incentives are included in its average sales price (chart). Check out Lennar’s 10-Q. It provides a lot of detailed info about this.
Can’t stop laughing at all the idiot RRE bagholders. I’m taking delivery on a futures contract for hot buttered popcorn at the CME so I can enjoy the spectacle in style.
Too bad The Cactus Bar & Grill nearby bar on Wells St. frequented by traders somehow went out of business right around 6 years ago.
I wonder if this is the new normal or will sales bounce back to some higher level at some point? Maybe we are entering a period where there will be just less people moving around. I have assume at this point people have realize mortgage rates are not going back to 3%, I guess they could be hoping for 5%?
Or prices could go down.
Prices have already gone down a lot in many markets.
Not even close to enough though…
Not saying deflation cannot happen, nor am I saying it should not happen as a function of true market forces, and while this an economics forum maybe a more practical take is worth considering.
From a ‘steering society through economics’ standpoint – consider how much of the Econ is underpinned by SFR Housing (add up the component generators of SFR – construction / finance / sales / improvements / complementary Retail) and it rivals Manufacturing in terms of GDP.
Consider what SFR funds as a function of taxation. If SFR value fell? 30% and it were fairly taxed (won’t be unless challenged at a class action level of cost b/c it is a fight against SEIU and others) it would lead to a fair amount of un-employment; and such dislocations can lead to political consequences / loss of control. Some might even characterize it as ‘union busting’, esp in non right to work states.
At every turn Miran, Trump, and Bissent have indicated or expressed that they intend to let the economy run hot to support asset price. The more probable outcome is TPTB manipulate what everyone’s paycheck reads. This administration already has enough operations in angst, a significant reduction in SFR price (which probably creates a drag on all assets), only leads to more problems.
I could be wrong.
I don’t see how they can ever get back to 5%. Assuming a mortgage rate spread of 2.3% on top of the 10 year rate, then in order to get to 5%,
then ten year would have to go down to 5% – 2.3% = 2.7%. With the federal debt, I don’t see the bond market settling for 2.7% on 10 year treasuries any time in the near future.
Sales will go up if prices go down.
The problem is you can rent for 20-50% cheaper than mortgage + ins + property tax in many places. Rents are also still high but not as ridiculous as housing prices.
This last year I’ve seen a trend of many professional, high earning friends who bought 2019 or later in HCOL cities sell and move into nice apartments because they’re “over home ownership”. They significantly underestimated the cost of repairs and maintenance, not mention the time commitment for upkeep. Inflation has made this exponentially worse. They’re sick of being out $10k+ if something breaks. A number of friends have had $25k+ on plumbing and electrical issues, etc. Bathroom remodels getting quoted at $35k, etc. They can live in nice, new apartment in good location with a lot of amenities for wayyyy cheaper and invest the money instead.
I was shocked by this trend, over the 4th I did a trip and a number of friends of friends had just sold or just listed their houses saying how excited they were to rent again. I was telling another friend that and she said she’s seeing the same thing in her friend group except with the people who have family money and just outsource everything – that when you have two working professionals no one wants to spend their limited free time on yard work and maintenance. A friend from Google who sold her house told me she just loves laying by the pool doing nothing now.
I’m sure the Midwest and other markets are different. But in a lot HCOL cities the only reason to buy was the appreciation and that’s unlikely to take off again in the next decade even with 5% interest rates because prices got so far ahead of local income.
Yeah I’ve enjoyed living in my 150 year old house and working on it a lot but definitely fantasize about moving back to the city and renting again. Sometimes the house feels like a fun hobby, sometimes it’s oppressive.
Honestly the thing that’s the biggest drag is the fact that it impacts being able to meet up with friends and have a good conversation over some beers or make some music together. Myself and the people around me are too busy working on our ancient houses, or gardening, or building our own houses. It’s all commendable, just not sure if it’s the life I want to be living honestly.
Houses are money pits. Period. I love calling the landlord and having them pay for the repairs.
I hear you Dewey. My brother used to own an older home. Charming as the house was, he told me once “there is ALWAYS a problem and something to fix or upgrade with these older houses.”
When the maintenance/repairs/upgrades become a chronic situation, a question is raised. Do you own the house, or does the house own you? Home ownership can work in reverse.
I am in So cal /San Diego to be specific.
A home in my neighborhood can be rented for 5K/month or purchased for ~10K/month.
I am a home owner as well and expenses to upkeep the homes are quite a lot. I spend ~$1k/month just on maintenance/simple update.
ON top of this, prices are going down slowly but surely.
The math just does not work in favor of owning a home in so cal unless it keeps going up and up.
100% agree. I’m in N. San Diego (Carlsbad) and am seeing the same thing. A condo in a complex where I also own a rental unit just sold. Assuming that the new owners put down 20%, the payment (including insurance, HOA, and property tax) would run nearly $6K. Considering these are two-bedroom units, it’s not like you could have a large family living there. Conversely, rents on these go for between $3500 and $4K. Unless you have a very large down payment it just doesn’t pencil out in these areas at this time.
Yeah and it’s not hating on home owners, it’s the feds fault. They should have raised sooner to curb the bubble. People would have celebrated 20-30% price appreciation if it had stopped there.
However now people will be upset if their home appreciation drops back to ONLY 20-30% from 2019 because it was once up 40, 50, 60% depending on the area.
The psychology of it is interesting, how attached people are to the imaginary paper value of home appreciation.
There much talk of people with family money taking over the housing market to the detriment of decent hard working folks. The reality is that the trust fund kids are overpaying and bailing out current owners and will be the ones left holding the bag. Of course, they can afford to lose money on overpriced housing so no tears for them.
Agreed. I’ve seen this time and again over the years, in California. Kids with family money overpay, whereas those spending their own hard-earned cash tend not to. It led to Portland becoming Oakland’s Brooklyn back in the day, if you follow me.
“when you have two working professionals no one wants to spend their limited free time on yard work and maintenance. A friend from Google who sold her house told me she just loves laying by the pool doing nothing now.”
Many of them can’t. Especially in the high income cohorts, they weren’t raised in a household that the parents ever did maintenance themselves, so wouldn’t know where to start. And, people are just lazier now.
$25k+ on plumbing and electrical issues ?
Maybe for an 80 year-old house, but my new main power switch, HVAC power switch and fuse box cost $1200, in 2026.
I have no idea how I could spend $25K+ on electrical issues.
People who live in TX don’t have these problems.
Enjoy paying rent the rent of your life, and missing out on the next big increase in prices.
Renting is known is possibly the worst personal financial position.
I came to known yesterday that my 30 year old ac broke and now looking at 14k bill
I already spent 20k on other maintenance items this year
I am quite frugal generally
Ouch
It’s not like all of our income is going to rent. I save money renting and invest the rest. I make to $400,000 in South San Diego and rent is $2,600 with a car port.
Enjoy your mortgage.
Outstanding! As we all know, the only way affordability will return to homes over time & outside of a recession is higher for longer.
While I’m certainly not a fan of 3.5% headline inflation, I’m also not a fan of going 17 years without a real recession that has baked inflation into every part of the economy. IMHO, all sorts of businesses are raising prices more than what’s necessary to cover increased costs. From bank profits, builder profits, technology profits, & all sorts of other mid to larger corporate profits, something has got to give.
The Fed has been doing stealth QE now for almost 8 months, causing the money supply to rise which is just nuts.
I’m just flabbergasted at how much all this AI spending is propping up the economy and likely sending us down the path towards two very bad outcomes over the next 3-5 years: much higher energy costs & labor disruptions.
Wages stagnated post covid while companies continue to raise prices. Stagnant wages aren’t helping, even in regions that have seen price reductions for 4 years. Corporate profits doubled since 2019 while the 10 years prior, there was not much change in profits. How do companies survive with little to no change in profits for a mere decade and now they can’t hold prices for a month?
I agree, no real recession occurred despite a technical recession in 2022 (not called by NABR).
You’re right, but I would say it will be longer than 5 years. Like a generation with no interest rates, there could be one with them. AI companies have been borrowing money to stay afloat and cracks are forming. Its only a matter of time investors pullback knowing the data centers cannot be supported by grid.
“Wages stagnated post covid…”
Average Hourly Earnings in June were up by 3.5% year-over-year. Last year, they were up by 3.7% to 4.2% year-over-year. Since January 2021, average hourly earnings have grown by 26%. That was the fastest wage growth in decades. How could you miss that???
Yes, adding to the already painful inflation…
Interesting times.
Well put I had my largest wage growth during this period
Adjusted for inflation should have been added to the assessment.
OK, but then you’re mixing apples and oranges with your sentence: “Wages stagnated post covid while companies continue to raise prices.” If both of those are nominal (not adjusted for inflation), it is the correct way of comparing two things (apples to apples). If you want to compare inflation-adjusted wages to prices, you must also inflation-adjust the prices.
A recession would knock out a lot the airbnbs by reducing travel.
Houses were meant to be lived in, not to be hotels. If they’re going to function as hotels they should require commercial zoning and be taxed like hotels. Having residential zoning areas full of airbnbs is not right.
And I know a lot of places have rules that you can only Airbnb your primary residence, but there’s no enforcement and fines are minimal. I know so many people who have multiple airbnbs and claim each one is their primary residence when filling out the licensing application.
Another wonderful example, currently staying at an Airbnb that the owners live in and run like a hostel. It’s a nice house in a neighborhood clearly geared at families and kids. They couple doesn’t work. This is a business. They should have to open a hostel in a commercially zoned area if they’d like to run a hostel. When enough people turn homes into businesses, it drives up the cost for everyone.
A recession would do all sorts of things to reduce inflation. If it’s big enough, we’d enter a period of deflation.
All I know is that 17 years without a real recession has distorted everything we can discuss about inflation from headline, to core, to PPI to consumer expectations. Heck, the NBER had to change the criteria of duration to call the COVID GOVERNMENT INDUCED SLOWDOWN A “RECESSSAION”.
And more importantly, it has entrenched a mindset from the Fed to the halls of Congress & the WH that they all do everything they can to keep this reckless bubble from bursting.
Well, AI at some point is going to put us into a recession either from overspending or consumer expectations changing radically, with the former being a more likely culprit as the backlash against DC’s continue to grow.
Austin already has shown what it takes to get sales back – prices need to come down. These crushing sales will eventually show in the GDP. Prices need to come down to get sales out of the gutter
All the bay area tech workers getting called back to the office?
Supply growth and retiree demand moreso. Tons of Cali retirees in my small town near Austin now.
That’s all folks (c)
Come in a decade or so…
Mortgage rates jump to the highest level of 2026
Talking face on CNBC this morning says Warsh has all the room he needs to extract liquidity thru the balance sheet.
It’s only just begun. Interest rate should started rising to long term averages before Obama’s second term! The economic pain we would have experienced as a result of letting all those f&%ers fail would have been much less. Having artificially held interest rates so low for so long will make the economic pain we feel, much, much worse, and we all know there isn’t a damn thing Warsh can do about it. Congress has been derelict in duties for 50+ years, THIS is where the blame should be squarely placed. The French knew how to handle such treason with style.
Hedge accordingly.
I just hope if there is a revolution I’m still young enough to fight!
There will always be a need for medics/cooks/info. gatherers/maintenance etc.
The point of the spear needs many hands to work well,all can contribute.
I’m unfamiliar with the pending home sales data. Is it possible to break it out by listing price (say over/under $1m) to see whether the K-shaped economy narrative holds up here?
Thanks Wolf, I enjoy reading your articles.
1. No it’s not possible to break anything out. The indexes are all that you get.
2. The “K-shaped” economy is a figment of some idiot’s imagination that went viral some time ago because internet morons love to click on stupidities, and the stupider it is, the more they click on it, and everyone is now slinging that clickbait stupidity around as if it were a fact. But it’s BS. K means one leg is rising, the other leg is declining. But that’s not the US economy. The US economy over the past few years is both legs are rising, but the top leg is rising faster than the bottom leg. You need a letter from another alphabet, where both legs are rising, but the top one at a steeper angle.
3. I loathe questions that are a lie with a question mark. It’s insidious manipulative BS. Have you stopped beating your wife yet? Yes or no!!!
Maybe the “K” they refer to is the one drawn by a 4 year old first learning to draw the alphabet.
I think you are taking it all a bit too much literally and missing the spirit.
How about a tilted K economy? Does that work for you? The K is tilted a bit to the left so both legs are pointing up but one much higher than the other…..
How about “W” instead of “K”? :))
I could be wrong, but I think the Millennials and Gen Z’ers don’t want the big house on the hill. There’s a paradigm shift happening with what’s considered culturally important. Plus those McMansions are expensive and dated. The costs to remodel 4200 plus sq ft is untenable.
Yes, maybe they could afford a new poorly built production home, but that puts them far away from a city’s downtown hub. Then, they’re fighting traffic and a car payment. Rent in the city rather than own debt.
My point is houses that old people are living in with 3% interest payments are no longer a desirable option for the younger generations. These homes would need to be dirt cheap…but the property taxes will still eat them alive.
It’s a cultural divergence.
Those still in the family/suburbia track want exurb life to the extreme. Giant SUV. Kid at some kind of crazy sports camp, elaborate Disney vacations, etc.
The others are holed up in the basement, smoking dope, nihilistic. US hikikomori. A subset moving abroad like a kind of permanent backpacker holiday.
And I’m sure some very fine people.
If the houses become “dirt cheap” then the property taxes won’t “eat them alive”.
Continuing story of homeowners who don’t need to sell and if they do, want top dollar or stay put. Only way to break this stalemate is more inventory, forced price drops due to job losses, or in the long term, demographics – boomers die off with a lower (poor?) population following them.
The recession the fed been terrified of for decade would lead to some forced selling
Trying to maintain my 1947 cape cod (not brick) in the Midwest… fortunate to not have financed any upkeep or renovations but is seriously pricey and contractors are a pain in the neck. At the point where it only makes cents to stay put. We’ve toured multiple new builds in our area and they are built like $#!T. No basements, 12 ft from the next house, no private yard, no room for a pool or garden, plastic insert showers with no tile, and terrible workmanship like crooked baseboards, uneven floors and outlets, zero character.
This housing bubble has FINALLY found its pin.📌
This artificially manipulated, fraudulent market could only defy rationality for so long. The party is over! I expect some banks and central bankers are in panic mode. This is going to get much worse. Just today I saw a $31K price reduction on a $550K home in a very nice city in California. Buyers are boycotting INSANE prices.
Increases in all costs – home prices, insurance, taxes, utilities, interest rates, and most all goods and services have finally driven home buyers to a checkmate – “We can’t and won’t put up with insane prices any longer!”
This could end up being very similar to a flash flood. Heavy rains – “it doesn’t seem so bad,” and then it turns devastating and deadly – the flood hits like a bolt of lightning, leaving home sellers in a path of devastation.
As a person who has built many many homes (carpenter) and renovated my way to economic security, I would like to make a few points on this topic. (Great data by the way).
Housing prices are not going to appreciably collapse and houses become universally affordable unless the entire bloody economy calves, and then many many will not have adequate work/income to buy something, anything. anyway. However, those sitting on money will still be able to buy more. Money makes money, and always has. Supposedly retired, I still buy tons from a local contractor supplier. Prices of building materials are way down from Covid years (when many many manufacturing plants were idled), but is is freaking expensive. So, do the math, the simple math. Imagine you are building a basic 1200 sq ft starter home. 1200X$300/sq foot costs $360K. The real cost for labour and materials likely +$400/sq foot. Now, your pushing $500K. For just the structure. Nothing fancy. Then, what does property cost in your area? Add that on. The fees, permits, etc etc. So, $600-700K for something basic, but new. Then Joe Shmo looks at his place and says, “Look at what that costs. My place is nicer, landscaped, I should get this much.” And if they don’t have to sell they won’t.
CA gets 85% of framing lumber from BC (where I live). There is currently a 45% tariff on it. Mind you, materials cost to frame a house is the cheapest category. But it all adds up. Copper is tariffed, steel. furnishings from overseas. Your housing industry relies on immigrant labour, under threat. It all adds up.
Then renting is a preferred option? Maybe in some markets but imho I call it a last resort as you age. I have a friend who is retired in Vancouver. She was just forced to relocate to a crappy area as she was renovicted from an apartment she had lived in for 20 years. Now it is math, this much coming in, and this is what I can afford. Her comment? Why the hell didn’t I buy that patio home ‘over there’ when I had the chance? Now, they’re too expensive.
“CA gets 85% of framing lumber from BC”
California imports about 80% of the framing lumber, from wherever it is CHEAPEST (transportation costs being a factor). The top three sources are in this order: Oregon, Washington, and British Columbia.
I just saw a house in Lancaster that sold for 400k in 2024 and now they’re asking 289k. Beautifully renovated and still nothing. Property tax an unusually high 6000. Almost everything in the exurbs has a price cut. Is this how it starts?
Those pending home charts say one word loud and clear – calamity!
I wish someone in this administration could point out that mortgage rates might actually drop (and help out home buyers) if the FED actually raised rates and got inflation more under control.
The reason the 10 year rates (and therefore mortgage rates) are rising is because treasury buyers are expecting more inflation over the next 10 years. Lessen that inflation expectation and mortgage rates drop. Simple.
That will not help an iota with the federal government continuing to spend at breakneck speed to increase the federal debt. Interest payment on the debt keeps climbing and no tactic of fed intervention is able to stop it. At the end of the day, the price of bonds are just like everything else, supply and demand. Endless supply puts a premium on what the government must pay to keep selling.
The great American cowboys and more presently, white collar cowgirls sold as many boats, cars, burritos and housing units to invaders as possible to keep the party going…the rest is just DEMOGRAPHICS thanks for your investment in college education, those calculus classes sure were demanding hint: a-b=zero because a=b :.) I think poking the RESET button somewhere around Y2K was the smart move. Look on the bright side We only burned 25 years, since BIN LADEN control demo’d the downtown Manhattan trade center!!!!!! And in hindsight he really did us a favor pulling all that SF straight off the market. He did wonders for the commercial sector, RIP old buddy see you under the sea any day now…