
Sales at gas stations were pushed by massive price movements of gasoline; we look at retailer categories separately to sort it out.
By Wolf Richter for WOLF STREET.
Retail sales rose by 0.2% in June from May, seasonally adjusted, but the price of gasoline plunged by nearly 10% in June from May, off the spikes in the prior month, and sales at gasoline stations were pushed down by the lower prices. Gas station sales accounted for 7.5% of total retail sales. In March, April, and May, soaring gasoline prices had pushed up total retail sales. So we look at them separately to see what’s going on. And what’s going on is that consumers have been splurging online and at motor vehicle dealers. Ecommerce hit it out of the ballpark.
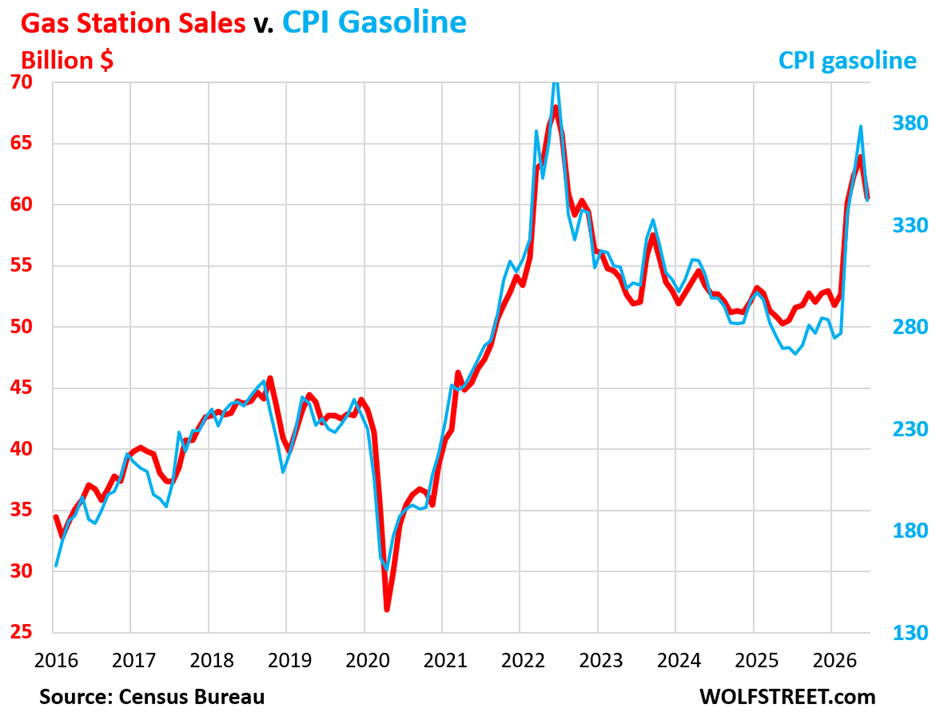
Sales at gas stations, which move in near-lockstep with the price of gasoline, plunged by 5.3% in June from May (-48% annualized), seasonally adjusted, according to the Census Bureau today. Over the same period, the CPI for gasoline plunged by 9.7%.
Year-over-year, gas station sales still soared by 21% despite the drop in June, to $65 billion, not seasonally adjusted, as gasoline prices were still up 27% year-over-year. Gas station sales include all the other stuff gas stations sell, and prices of that stuff didn’t fall, which softened the blow. The chart shows gas station sales in billion dollars, red, left scale, and the CPI for gasoline (price level, not percentage change) blue, right scale.
Retail sales without gas stations jumped by 0.72% in June from May (or +9.0% annualized), seasonally adjusted (blue line in the chart below).
Month-to-month growth rates have been in this strong range for the fifth month: +0.89% in May, +0.41% in April, +0.77% in March, and +0.87% in February.
Year-over-year, retail sales without gas station sales jumped by 7.4%, the biggest year-over-year increase since December 2022, to $712 billion, not seasonally adjusted.
The three-month average, which irons out the month-to-month squiggles, rose by 0.67% (red in the chart below). That’s substantial growth. Consumers were splurging.
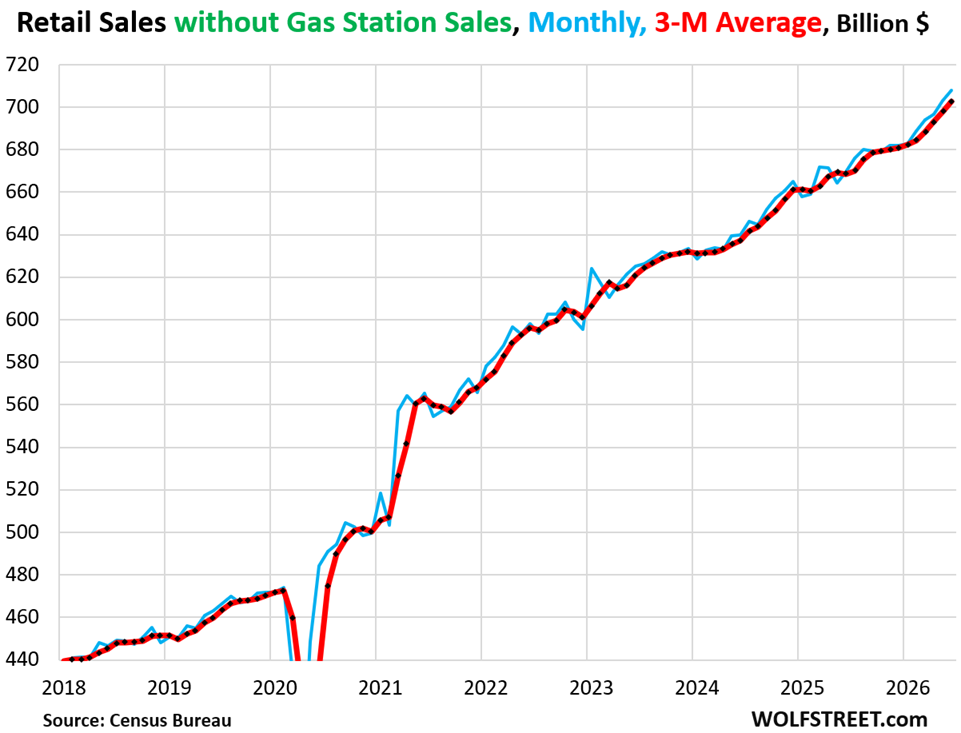
And it wasn’t inflation. Retailers sell goods, not services. And CPI inflation for “core” goods – which exclude said gasoline and other fuels – was negative (-0.1%) in June from May and up by only 0.8% year-over-year (my analysis of the June CPI inflation data). The core goods CPI roughly applies to retail sales without gas station sales.
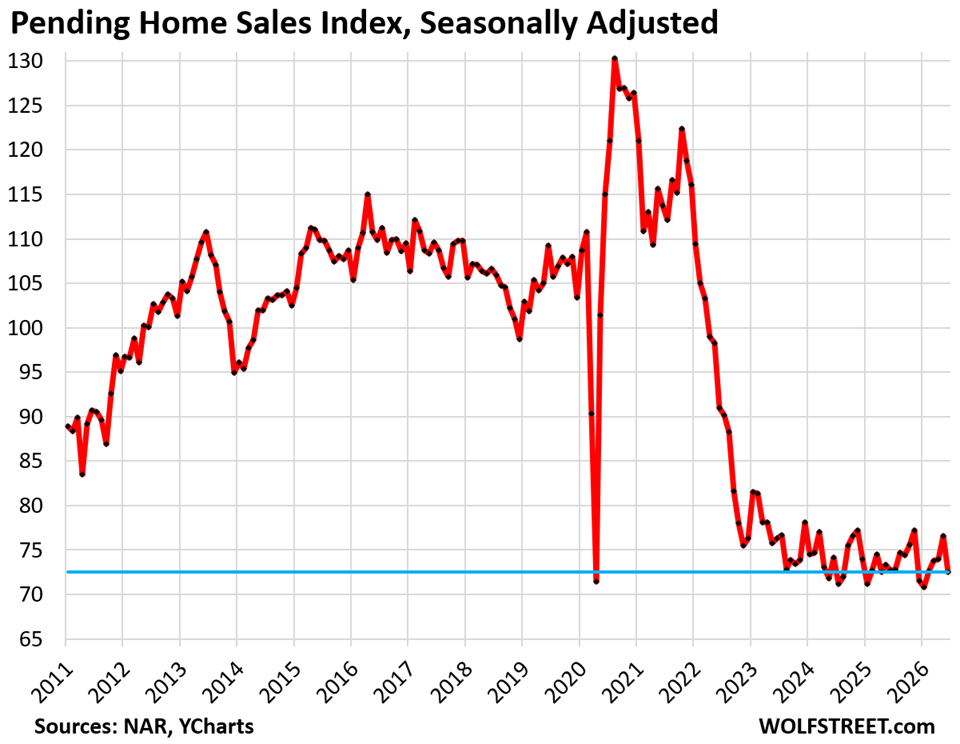
YOLO? You live only once. Maybe people are just living life instead of buying overpriced homes and struggling with big down-payments, mortgage payments, homeowners’ insurance premiums, and HOA fees? Home sales fell deeper into the deep-freeze in June, so to speak, despite highest supply in 10 years. Let retailers have some of their money, instead of banks and insurers?
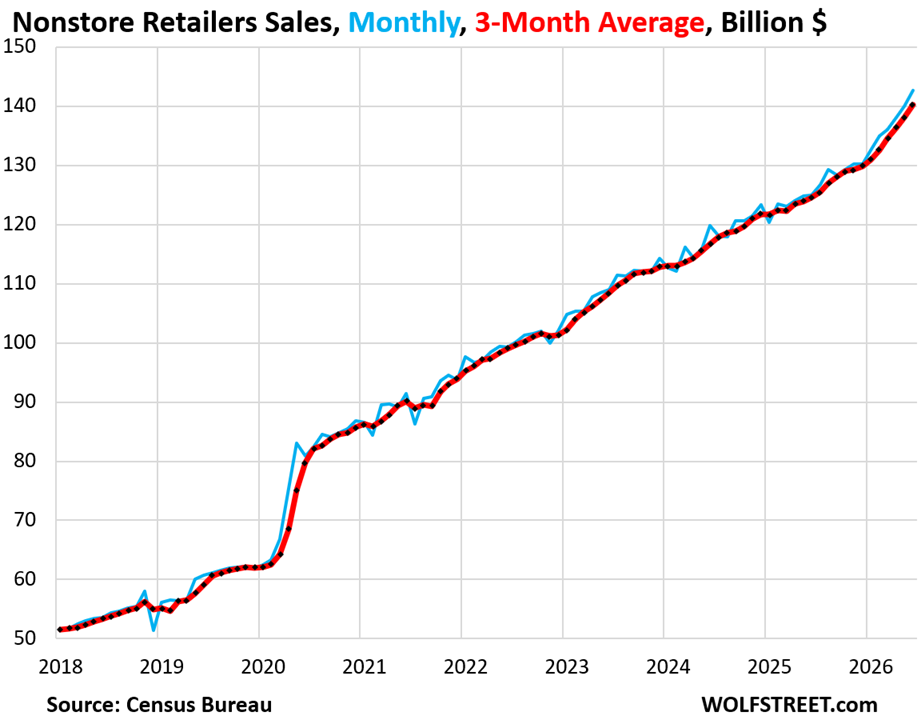
Sales at ecommerce retailers jumped by 1.9% in June from May, seasonally adjusted.
Year-over-year, they soared by 18.0% to $140 billion, not seasonally adjusted, hitting it out of the ballpark, surpassing sales at motor vehicle dealers, and making ecommerce the #1 retailer category in June, with a share of 17.9% of total retail sales.
The three-month average jumped by 1.6% in June from May. This has been going on for months.
The increase in ecommerce sales shows two things: consumers are splurging; and consumers continue to shift more of their purchases to ecommerce from brick-and-mortar stores. The first contributes to retail sales growth; the second is the zero-sum fight for market share.
Ecommerce sales include sales by the ecommerce operations of brick-and-mortar retailers, such as Walmart (one of the largest ecommerce operations in the US), Macy’s, Target, and all the others. Even grocery sales are migrating in more consequential numbers to ecommerce.
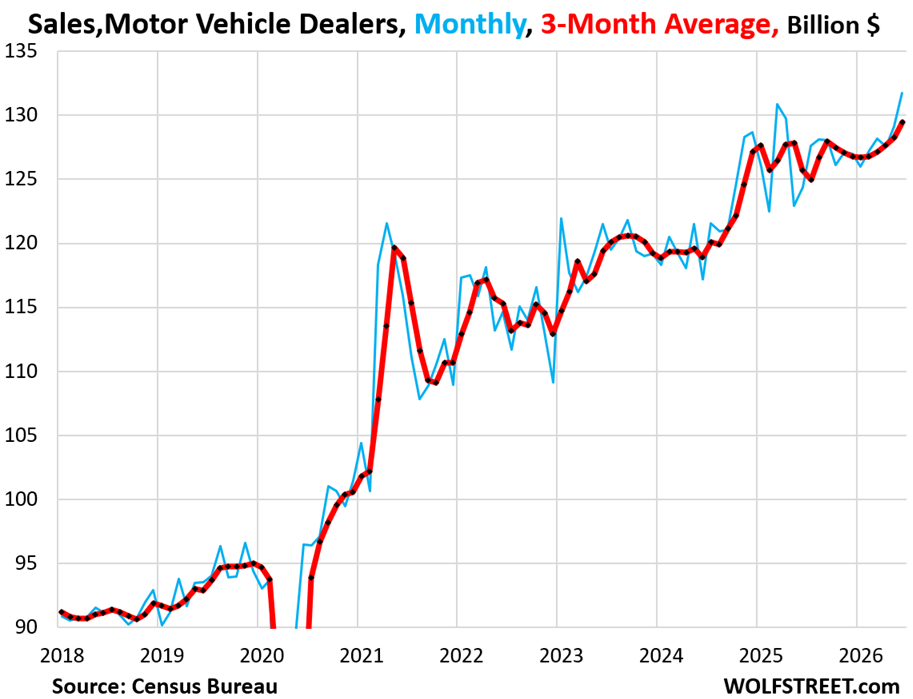
Sales at motor vehicle dealers jumped by 2.0% in June from May (+27% annualized), seasonally adjusted.
Year-over-year, sales jumped by 8.5%, to $134 billion, not seasonally adjusted.
The three-month average jumped by 0.94% in June from May.
And it wasn’t inflation. The CPI for used vehicles was negative for June and down by 1.8% year-over-year. The CPI for new vehicles was negative for June and up by only 0.5% year-over-year.
Motor vehicle dealers, which include auto dealers plus dealers of motor cycles, RVs, ATVs, snowmobiles, etc., were the #2 category of retailers in June with a share of 17.2% of total retail sales.
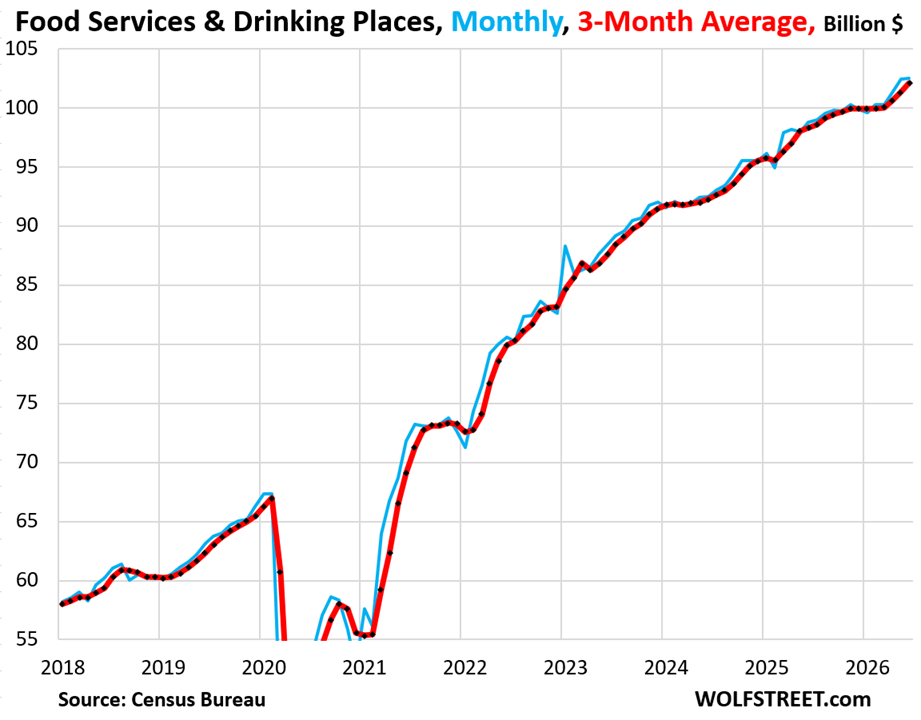
Sales at restaurants and bars inched up by 0.1% in June from May, after two strong months in a row. The three-month average sales jumped by 0.74% in June from May, powered by the prior two months.
Year-over-year, sales rose by 3.8%, to $105 billion.
These food services and drinking places, as they’re called, were the #3 largest retailer category in June with a share of 12.2% of total retail sales.
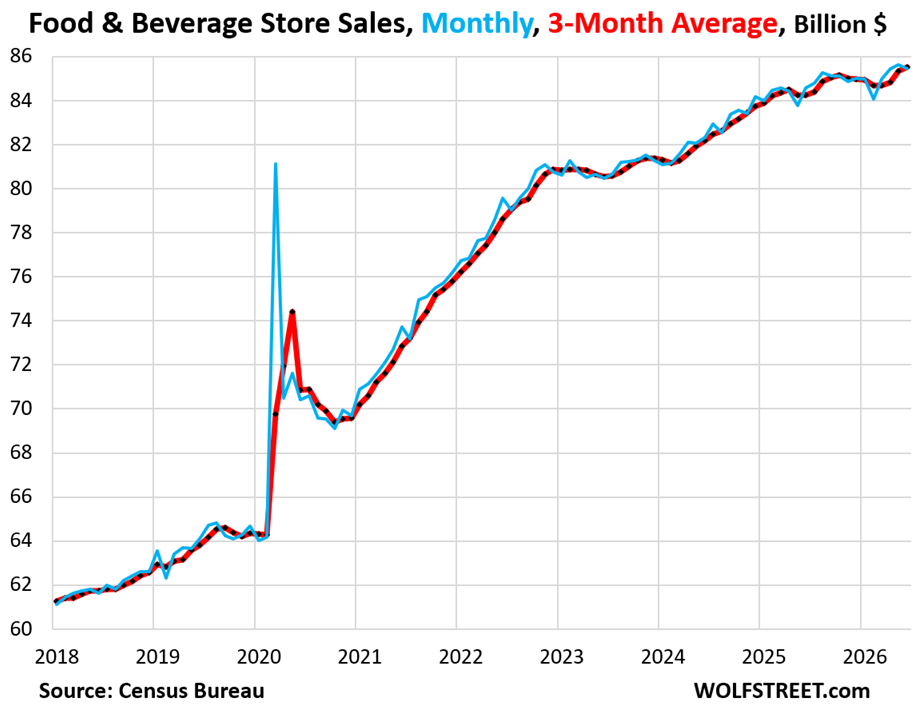
Sales at food and beverage stores dipped by 0.2% in June from May. Three-month average sales rose by 0.18%.
Year-over-year, sales rose by only 1.0%, to $85 billion, the #4 largest category of retailers, with a share of 11.4% of total retail sales.
The year-over-year increases have been below the rate of CPI inflation for “food at home” (purchased at stores and markets) of 2.6%, which shows the challenges this category of retailers faces:
More grocery sales are migrating from brick-and-mortar stores in this category to “general merchandise stores,” such as Walmart and Costco (see “general merchandise stores” below) and to ecommerce (see above).
In a decades-long trend, food purchases have also wandered off to restaurants. Spending in restaurants began to exceed spending at this category of food retailers in 2019, and the gap has dramatically widened since then as consumers are going for YOLO instead of cooking at home (see “restaurants and bars” above).
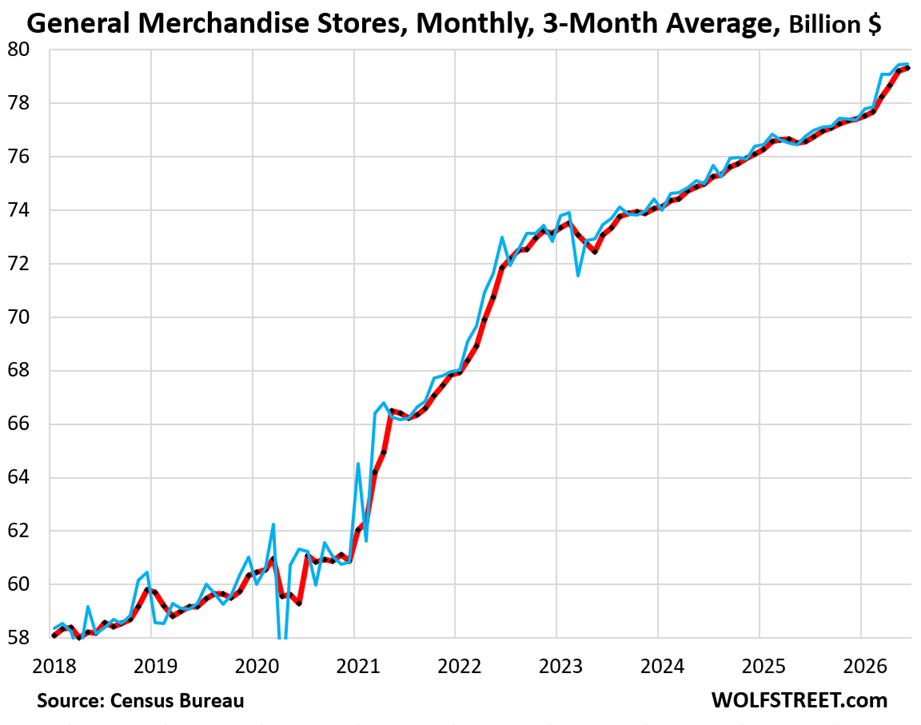
Sales at general merchandise stores inched up by 0.06% in June from May. Three-month average sales rose by 0.17%.
Year-over-year, sales rose by 3.2%, to $78 billion, the #5 category of retailer, with a share of 10.5% of total retail sales.
General merchandise stores’ food sales are included here. Walmart, whose brick-and-mortar stores are in this category, is the largest grocer in the US, and its food sales are included here, and not in sales at “food and beverage stores.” But general merchandise stores’ ecommerce operations are included in ecommerce above.
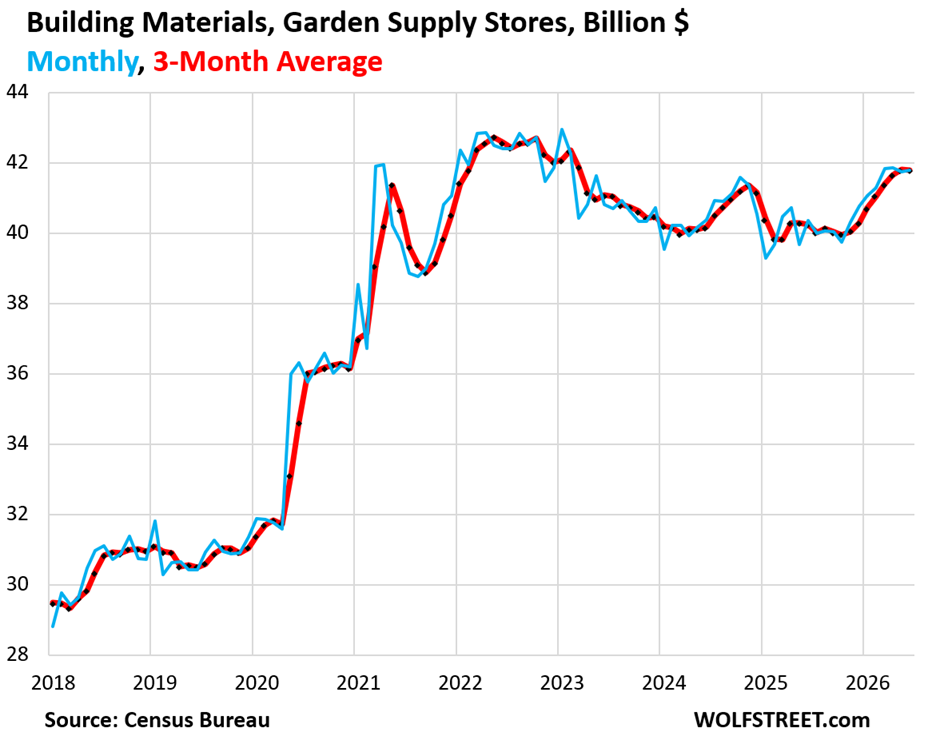
Sales at building materials, garden supply and equipment stores inched up by 0.11% in June from May. Three-month average sales were essentially flat.
Year-over-year, sales rose by 6.9% to $47 billion, the #7 largest category of retailers with a share of 5.5% of total retail sales, behind gas stations.
These retailers have still not fully recovered from the overspending on home improvements during the lockdowns. Those were the good times!
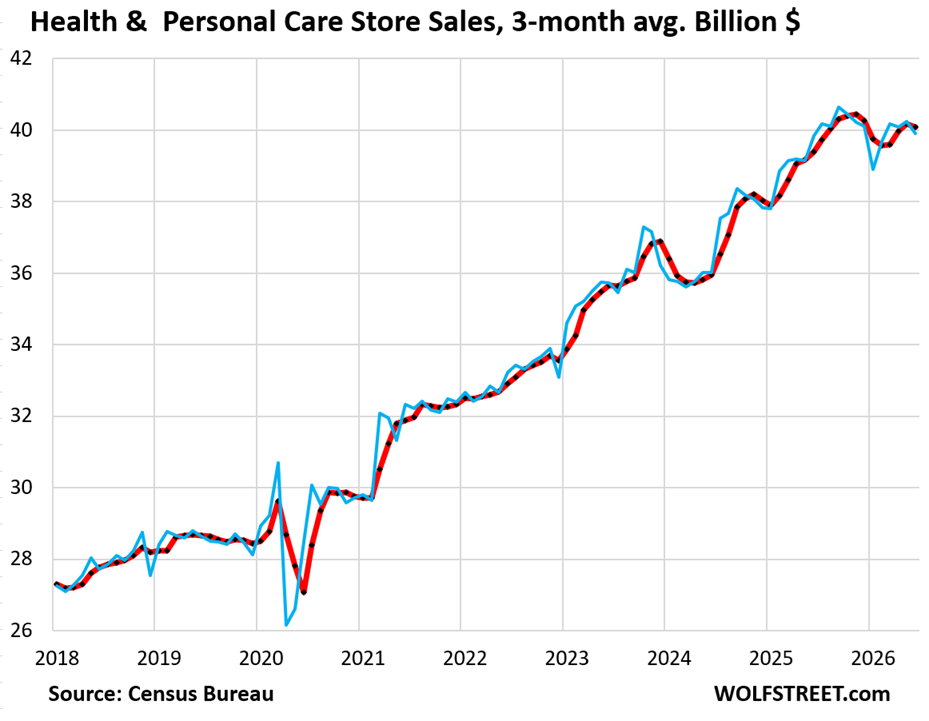
Sales at health and personal care stores fell by 0.81% in June from May. Three-month average sales fell by 0.22%.
Year-over-year, sales rose by 2.0% to $40 billion, making it the #8 largest retailer category.
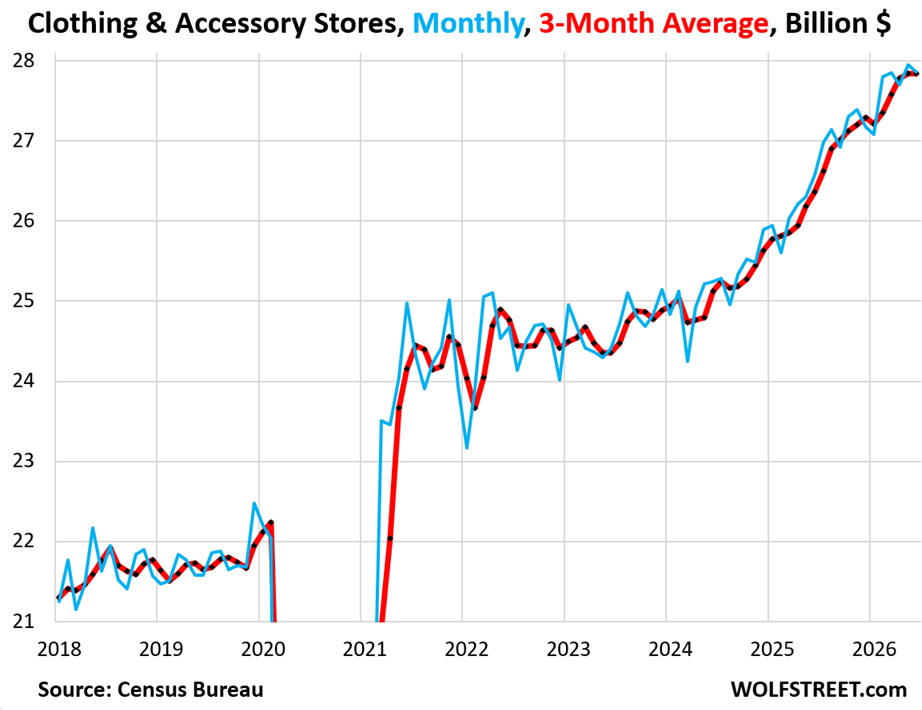
Sales at clothing and accessory stores fell by 0.31% in June from May, and three-month average sales were flat.
Year-over-year, sales rose by 4.8% to $28 billion, the #9 largest category of retailers.
In case you missed it: Largest “Foreign” Holders of US Treasuries, including US Hedge Funds Engaged in the “Basis Trade” & Corporate America
Enjoy reading WOLF STREET and want to support it? You can donate. I appreciate it immensely. Click on the mug to find out how:


Maybe I am mistaken, I thought car sales volume is down. That the sales of auto goes up is related to price hike? With active consumption, recession is defeated again but then again, it usually happens at the last year of Republican presidents’ term.
In June, NEW auto sales (deliveries) in June were up by 7.2% year-over-year not seasonally adjusted, and by 4.4% as per the seasonally adjusted annual rate (SAAR), see chart below.
But the data in the article is far broader and includes sales at dealers of used vehicles, motorcycles, RVs, ATVs, snowmobiles, etc.
Wolf – this is the first “housing bubble” that I am aware of where sales volume plummeted, and sales price didn’t start sharp decreases w/in 6 mos.
Usually, sellers initially refuse to lower price, and buyers refuse the high prices, so sales volume plummets, and the sellers end up “caving” on price, and sales volume picks up.
Highly extraordinary.
It’s not that simple. Prices have plunged in many markets – and I have documented some of the large ones here. But in some HUGE markets (NYC, Chicago, Philadelphia) and some other markets, prices have continued to rise, and so averaged out, the national price hasn’t dropped yet.
This is fairly typical. There are always housing crashes somewhere due to the local economy — I’ve lived through and bought a condo during the Tulsa housing crash that started in the mid-1980s and lasted several decades, with some ups and downs in between. There were many other cities like that.
What was extraordinary during the Housing Bust was that ALL markets crashed at nearly the same time due to a NATIONAL problem — an unsustainable price bubble combined with bad mortgage underwriting.
When you have traditional fiscally responsible Republicans
…
“fiscally responsible Republicans”…
LMFAO!!!
Something that has never existed, at least not in the lifetime of anyone alive today. Don’t get me wrong, the dem are simply the other side of the same damn coin. BOTH are fully OWNed by K-street and THAT my friend is the problem.
When was this, in the 50’s?
Wolf is correct. I live in a big city with my low wages. However, I see people splurging everywhere, spending, new cars, retail is always packed, restaurants are full and amazon/food delivery. Credit cards, May be. Apart from the hormuz situation, people are not aware of any economic problems, government debt and other problems. Economy is growing. Its not YOLO, people are having $10 lattes and everything. Obviously, people who can buy a house already got 2 or 3. When the older people die, either those houses will wither away or passed on to the kids or younger ones.
I might get kicked out home, but at least I have vehicle to live in(with $1,000 month payment)
and only 10 years to pay it off
I can live in my car but, I can’t drive my house !
It’s the boil the frog affect.
They don’t want to be left out of the recreational fun. Even though a high earning 80 year old couple is spending their stock market gains.
The 80 year old couple is pulling money out of thin air while the working youth competing with them are having to go to a job to do the very same thing.
Ironically if you own Starbuck’s stock, the gains could actually pay you to go spend money in the store.
Whereas the lowest 50% of people do not own any stock. So they are not aware of these magic tricks.
*Effect
Same where I live. No one is tightening their belts at all.
Many Americans answer in polls they feel the economy sucks, but they aren’t reducing their spending.
Wolk has tracked wages and they actually track very nicely with retail spending. I trust Wolf’s data over you hyperbole.
There are still too many low-wage immigrants, like in places like DFW.
The remedy is deportations, so that employees have to pay better wages.
Corporate profits show that employers could easily pay more wages, but they won’t as long as so many illegals remain here.
I was on a spending tear for awhile this year, but starting to feel some burnout as I look at all the untouched stuff I obviously didn’t need.
I don’t know how some people do it, but do carry on!
I don’t understand buying stuff you don’t need. I only buy things I need.
Howdy DC… You must be single? Ever seen the amount of shoes a woman buys? HEE HEE
As a husband, and father of 3(19F, 15M, 10M), I only buy what others need.
Yep. The things you own end up owning you.
Never heard that, but it rings true here to me.
But wait!
They are inanimate objects.
Haha
Buy something of good quality and use it for the rest of your life (or its life, at any rate). I think that’s what’s most rewarding for me – and cheapest in the long run.
These increased sales are against the backdrop of less US immigration. Do per capita sales data tell the same story? Are per capita sales even useful to consider?
The US population was still seen as increasing in 2026, but very slowly.
When the economic collapse hits home later this year, all this frivolous spending will drop pretty quick…
Unless its on basic food and subsistence items, then it will continue to grow and get bigger!!
YMMV…
Are you still preaching “economic collapse later this year” after all these years 🤣❤️
Economic collapse? You don’t have a collapse with this many drunken sailors partying.
Please, it should be pretty clear by now that there will never be a “collapse”, certainly not “officially”.
There will, however, continue to be a slow slide into a Soviet style society where the average person has less purchasing power and a lower quality of life, despite rising wages. There will be a few oligarchs/corporation that own the vast majority of productive capital and CONgress. This was agreed on long ago and the coordinated actions of all global central banks is the tell.
Must be high demand for gas station sushi! I hear it’s a cool kid thing to eat now.
You know they found that most sushi places sub out similar fish for the high price one.
The replacement (cheaper) fish has some weird side affects. Like gastrointestinal distress. Not explosive gastrointestinal distress mind you, just the regular kind.
Kinda like 87 unleaded gastrointestinal distress, versus say a high grade 91 gastrointestinal distress.
😆
There is a video going around Reddit.
This wife gets up at 4:30 or 5 to make the husbands very complicated and high calorie breakfast to pack it for his day of hard work!
Very Yellowstone land!
What’s interesting is they live in an RV. I guess near the work site, kinda like in Yellowstone. That odd show. I’ve never seen it, but it sounds Yellowstone (not the park, the odd show)
So anyway, yep houses are out of reach for many.
Car is the new house! Woo
What else is up?
Bankruptcies: Bankruptcy filings increased 11.9 percent during the 12-month period ending March 31, 2026. According to statistics released by the Administrative Office of the U.S. Courts.
Private credit is a mess, but don’t worry, CONgress will make sure none of those venture “capitalists” are harmed or lose any of their wealth. The taxpayer and the average American will take the hit and bail them out…
…again. For those “older” folks, we are fast approach the “F-you, pay me!” part of the script.
Hedge accordingly.
I enjoy reading some of the comments on here. My own two cents are along the lines of this: Many people have access to credit and are buying things such as cars. People love to eat out and splurge and it’s easier to splurge on little things, especially when a home purchase seems unlikely for the foreseeable future. A very substantial portion of the population has money, whether it came from stock gains, a second mortgage or work… who cares? They have money to spend! But everywhere I look there are conversations about the number of homeless people. We are seeing the part of the population that is able to spend. We are also seeing the part of the population that has virtually nothing. We aren’t seeing the people who stay inside their homes all day long for obvious reasons.
But here in San Francisco, I see a lot of brand new cars and small SUVs, grocery stores have long lines in SOMA, and restaurants seem like they are doing better. Some big(ish) conventions recently have brought people back downtown. And there are still plenty of unhoused people and daily street cleaning.
So I see a bifurcation of people. I love the data and Wolf is a master of dissecting and sharing this information. But sometimes I think we are missing the forest for the trees in our comments. Two things can be true at the same time in an economy as large and diverse as ours is.
Homeless people are NOT a result of the economy. Homelessness is a very complex phenomenon with many causes, and a big part of it revolves around mental illness and addiction, and we in this society don’t have systems set up to deal with these issues and treat people for free and keep them from becoming homeless in the first place.
While you are correct in principle, when homelessness is more than a few people, then there are first and foremost economic reasons for it. And the reason is cost of housing.
Unnaffordable housing -> working homelessness/ “van life” -> social stigma -> mental health deteriorates -> addiction -> loss of work/ income -> and now it is very difficult to find housing again.
And thats why housing first policicys are so successful. Because it addresses the underlying reason.
It’s the other way around: untreated mental health issues and addiction cause people to lose their ability to function in society and at work, they lose their jobs, get evicted, etc. There is a huge amount of documentation on this, and every city struggles with it.
Blaming the economy for homeless is total BS. You need to blame society for refusing to provide the essential care and services these people need to function.
Sure, some people temporarily lose a place to stay and they couch-surf or stay in cheap hotels and occasionally sleep in their cars for a while. And then they move into an apartment and are back to normal.
Others CHOOSE to live in RVs to save the housing costs… We had a commenter here some time back. He had a good tech job, could have paid for housing, but saved to create a pile of assets, had a portfolio of stocks, etc. that’s not “homelessness” of the type we see on the street. Traveling in an RV fulltime around the US and staying here and there for a while is not homelessness either. These are lifestyle choices.
Homelessness is a complex problem, as I said, and has many causes. Anecdotal stuff is just nonsense. Here are the top three issues, from Arlington Life Shelter, in North Texas:
1. ADDICTION
Probably the most common stereotype of chronically homeless people is that they are drug and alcohol addicts — with good reason. 68% of U.S. cities report that addiction is a their single largest cause of homelessness.* “Housing First” initiatives are well intentioned, but can be short-sighted. A formerly homeless addict is likely to return to homelessness unless they deal with the addiction. Treatment programs are needed that treat the root causes of addiction and help men and women find a way back home. (*Source: National Coalition for the Homeless – Substance Abuse.)
2. DOMESTIC VIOLENCE
Nationally, 50% of homeless women and children are fleeing domestic violence.* When a woman is abused, she faces a crisis of safety. If she stays in the home, she’ll be beaten again. If she leaves, she’ll have little means of support. Either choice is a tremendous risk. Choosing homelessness over abuse is both a brave and frightening decision. (*Source: National Coalition for the Homeless – Domestic Violence.)
3. MENTAL ILLNESS
6% of the American population suffers from mental illness. In the homeless population, that number jumps to 20-25%.* Serious mental illnesses disrupt people’s ability to carry out essential aspects of daily life, such as self care and household management. Without assistance, these men and women have little chance of gaining stability. (*Source: National Coalition for the Homeless – Mental Illness.)
https://arlingtonlifeshelter.org/how-we-help/resources/causes-of-homelessness.html
I love the debate this comment struck. Not all homelessness is caused by mental illness, economics indeed play a role. Housing costs too. A lot of people give up trying after a long struggle- at which point mental illness often becomes a factor. The chicken or egg scenario is common and I think you are both wrong for suggesting that there seems to be one large reason for homelessness. It is complex.
We do have many unhoused people ‘by choice’ in that they choose not to rent or buy due to costs. Citing one who lives in an RV helps understand the phenomenon but anyone who deigns to work in services has probably worked with a number of people who use the shower at work and change into the dress clothes they keep at work. I certainly have. I don’t think they are mental and based on my conversations with them they don’t seem happy to be in the situation they find themselves.
The notion that a lack of job skills and mental health issues causes economic deformations is an elite BS talking point. Not everyone needs to be a doctor, engineer or pharmacist. We’ve seen this BS argument play out in engineering, architecture, the pharmacist trade, and we are seeing it play out in the tech industry now.
If a society wants to have restaurants, stores and cheap schools someone will need to figure out housing that extends beyond SRO rooms in a YMCA type building.
Yet another point about the economics: Mental health problems and drug use aren’t unique to poor people. We need only look at our elite leaders in DC and Wallstreet to see this. The difference is economic.
Out here in my little slice of flyover
addicts are #1by a wide margin.
Quite the education talking with EMT’s
and sheriff’s department.
There’s a relatively recent book out called “Homelessness is a Housing Problem”, which argues it really is about the rent and availability. I haven’t read it, just seen good reviews on it from city planning influencers.
That book’s statistics got ripped by people who understand statistics and concepts, including by:
https://marketurbanism.com/2023/03/20/book-review-hiahp/
Great comment.
Far too often, people equate homelessness with high housing costs.
The issue is more complex, just as you mention.
Nothing is free.
Correct. Our society refuses to pay for treatment and prevention which contributes hugely to the homelessness problem. Society has to offer these services for “free” to the people who need those services because they don’t have the resources to pay for them. But we’re terrible at that.
In my city much of the homeless problem is due to cheap housing snatched up by the flipper industrial complex. I know a mother and son, both employed, living in a tent. The local cop reports people living in their cars outside the 24 hr gym. They get up, take a shower and go off to their jobs.
I looked up a restaurant in CA that came up in a news story.
Some Italian place, looked nice.
Typical price there was double most restaurants here in NC.
I wonder how much of this is the stock market being up? I personally made enough from that to buy a brand new car if I wanted to. And I’m guessing that a lot of people own a lot more stock than I do….
I wonder how much of this is real increase in consumption and how much is due to ever increasing prices.
Last month we didn’t go anywhere or do anything or buy anything special. tHE HIGH POINT WAS BREAKFEST AT OUT LOCAL DINER. I got my bank statement and we spent over $7,200 for June. Need I say more.
that is why I crawled from the swamp and setup in the lakes and forested hills of Middle TN. Saved about $8 filling up my Escape a few days ago vs MD prices (checked gasbuddy). Saving about $750 per month on property taxes in TN with a smaller house with but much larger yard. Electricity is a co-op instead of BGE, big savings. No income tax but they are collecting a lot of state local sales tax 9.75% as we update the new house. New guns didn’t require State Police fingerprinting, training and license – I just bought them. (Do you need fingerprinting and license to exercise your right to free speech?!) Local small engine guy up the road picked up my Kubota mower on his trailer, did a minor repair and returned it for $120! Huge job to repair big gravel driveway only $12,000. Got 39 species of birds in 70mins other morning using Merlin app. Peace and quiet. Two lakes and two rivers within 19 minute drive. Neighbor is 71 yo widow who sold me the 54″ cut Kubota bc it was “too small” for her, she got a 60.5″ Sus to mow her 7 acres. I like it here, only downside, weed still illegal but a friend told me “everyone in Jackson county grows weed”.
Swamp, I’m curious about your reaction to the John Rose commercial: “Let’s keep Tennessee for Tenneseans”. Sure you found your peaceful little corner of the state and now you go crowing about it on the internets.
I forgot to add, we have no house payment nor car loan nor any credit card debt.
That’s insane and I’m curious about the breakdown.
As my friend complained some years ago – I drive sensible used cars, I don’t make big purchases, I make decent money. Where is it all going?
Turns out it was coffee and organic groceries and health insurance. Lots of little expenses to try to save on, plus some un-considered big expenses.
YOLO is a result of inflation thinking. You spend now because everything costs much much more next month. Why save for later, the money will buy much, much less next month. America does not fully understand Latin style inflation yet, but it won’t be long,………
An example: My neighbor gave his 1984 truck with parts to a kid whose family does driveways. He now has a brand new driveway.
I know I splurged because Amazon Prime Day week is now something almost every business jumps onboard with. That said, it isn’t a new event so may be unrelated since would show up every year. With my once yearly free prime month expended I probably won’t splurge on anything. I am also one of those rare employee getting zero wage gains and actually pay cuts for a few years.
According to the FRED:
Median family income in 2010 was $60k.
In 2020 in was $84k
Now it is $106k
That is an increase of 20% in just 6 years from 2020 and the trend is still up. These charts are reflecting the additional income that families have to spend.
IN my neighborhood in socal
Over the last 10 years, the median home price grew from about $550,000 in 2016 to over $1.085 million by mid-2026, while the median family income increased from roughly $70,000 to just under $113,000.
Housing is the catch. It’s not the price of Lucky Charms or Jimmy Dean biscuits. 1000 sheets of paper are the same price on the upper west side as in La Junta Colorado. Bravo on that to the system.
But the United States did this recent housing kill to us all. It gave scratch off housing lottery tickets, like it tends to do. It is definitely a gambler, maybe it has a problem in fact. See CEO pay for example- and so now entire cities/metros are off limits for the next wave of families.
So the US gov screwed many thriving cities and towns with this lottery along with old and young people.
Will it have any accountability? No, just that SF will keep on stratospherically booming while flag waving Brady Texas may not keep a subway sandwich store. Hobby Lobby has become a highly skilled employer for many places in this land. The whole system is a lottery now, and maybe it always was.
I don’t understand about scratch off housing lottery tickets. Can you explain?
Our new cars sales have been in the toilet since the start of the war. Used cars are hot but we don’t have enough trades coming in from the lack of new car sales. This summer sucks!
I imagine the WFH boom and sustained percentage has also impacted this over the past six years? My wife and I used to put 8-10k miles on each of our cars every year. Now we both work from home, she has one office day a week and one long travel day a month. We put about 6k miles a year in total on both cars. The savings in time, money, and commute sanity for us are astronomical, but we no longer feel the need to worry about replacing the 2008 with 110k miles if it becomes unreliable.
I’m appreciating the nuanced discussion about homelessness. There’s never enough but my city builds permanent supportive housing for people with challenges. It seems like that’s what Ronald Reagan promoted when he closed the mental hospitals in the 80’s. It seems ironic to have Democratic Mayors that are Reaganites, albeit 30-40 years later.