
How employment changed by industry amid big structural shifts in the US economy.
By Wolf Richter for WOLF STREET.
Automation and computerization have been employment disruptors for many decades, and then came the internet. They have destroyed many millions of jobs, but created many more jobs. Companies continue to drive technology forward to increase production, reduce the costs of labor, and remain competitive.
And these shifts show up in the industry-specific nonfarm payrolls data, released by the Bureau of Labor Statistics (my discussion of today’s overall employment report: Signs Pile up of a Solid and Tightening Labor Market).
The industry categories below are based on work locations, which are classified by their primary activity at that facility (NAICS code). For example, a job at an Amazon fulfillment center falls under “Transportation and warehousing,” not “Retail.”
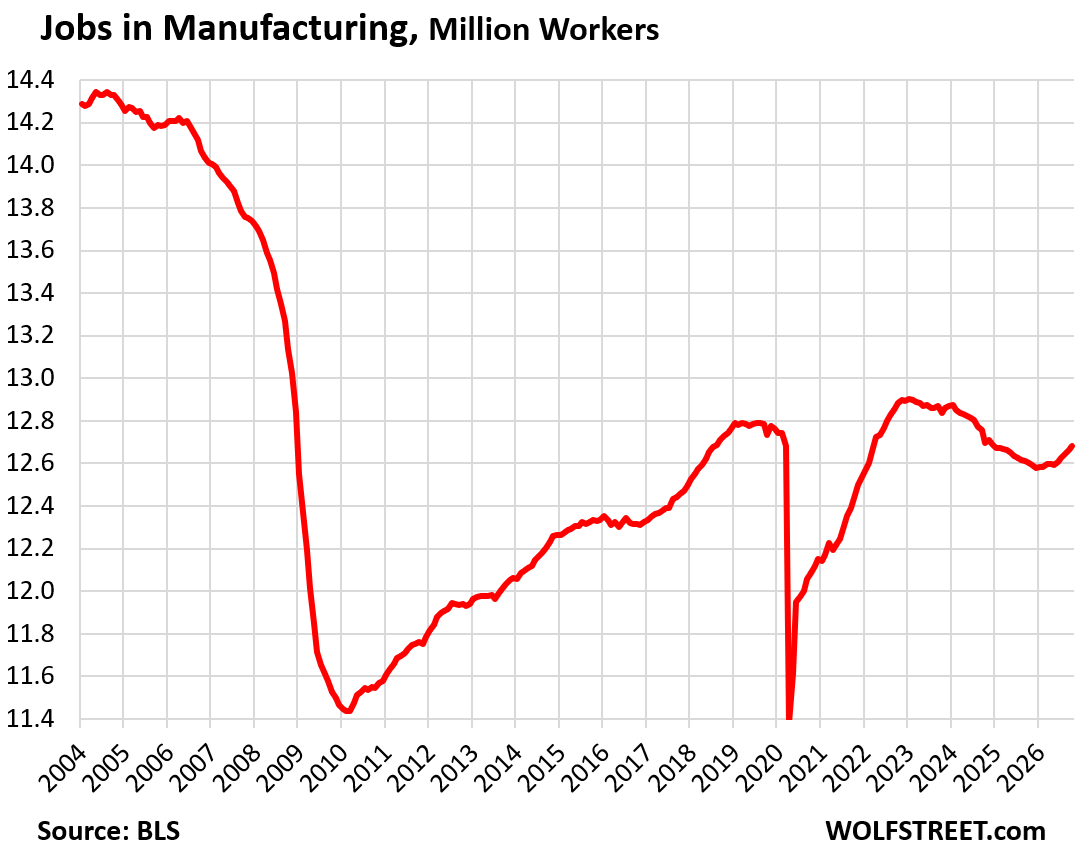
Manufacturing in the US, in addition to ever greater automation, has been affected by globalization, which shifted a big portion of manufacturing production, manufacturing knowhow, and manufacturing infrastructure to cheap-labor countries. As a result, China has become the dominant force in manufacturing.
But the US is still the second largest manufacturing country by value added in the world: Far behind China, but larger than the next four combined (Japan, Germany, India, and South Korea), as per data from the World Bank and the Bureau of Economic Analysis.
US manufacturers continually advance their automation to increase output and reduce labor. Semiconductor plants are an example at the top of that pyramid, with a very high-dollar output, and a small but highly skilled and highly paid workforce, including STEM workers.
But even employment has been increasing again recently.
- Total employment: 12.68 million
- Month-to-month: +19,000
- 3-month growth: +53,000
- 12-month growth: +78,000
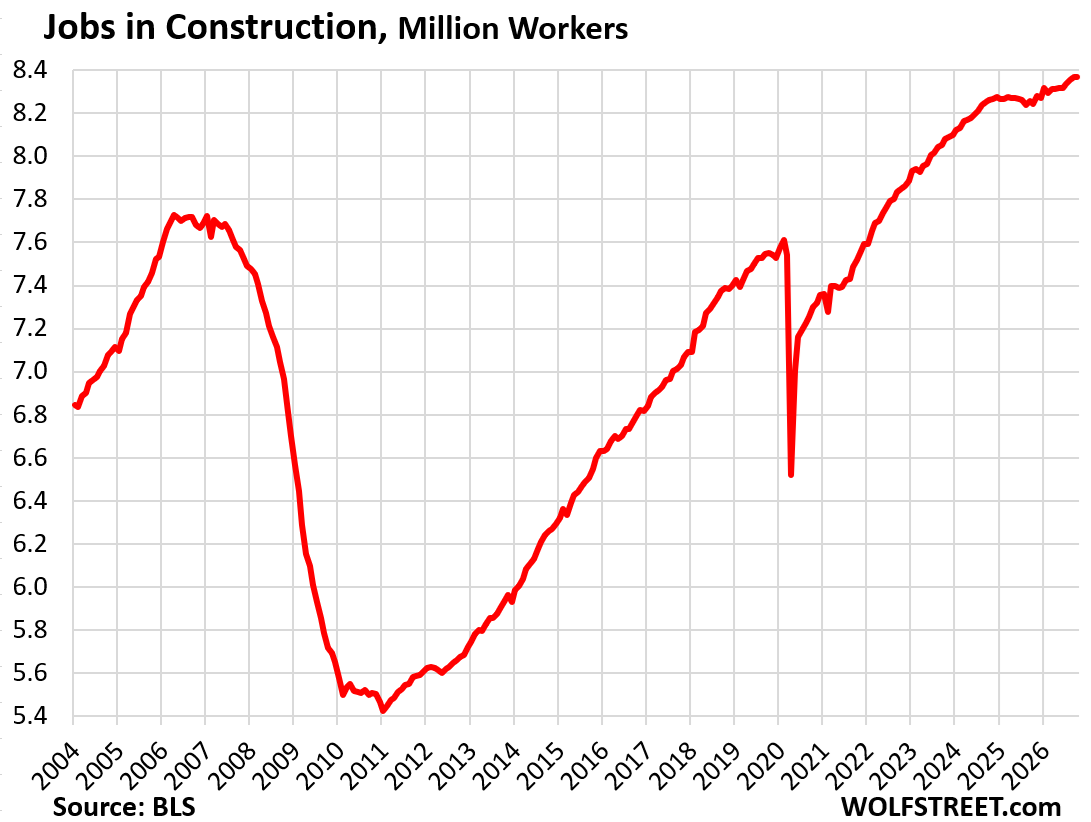
Employment in construction faces a slowdown in single-family and multifamily construction amid a pile-up of new supply. And office construction has been kneecapped by the meltdown of the CRE office sector. But AI data center construction is exploding, and factory construction is running at high levels, triggering labor shortages in those areas, especially in the highly skilled trades, such as electricians.
The phenomenon in 2007-2011, when employment in construction plunged, was the result of the Housing Bust that caused employment in residential construction to collapse; and of the Financial Crisis, that brought all kinds of other construction projects to a halt.
- Total employment: 8.37 million
- Month-to-month: -3,000
- 3-month growth: +30,000
- 12-month growth: +124,000
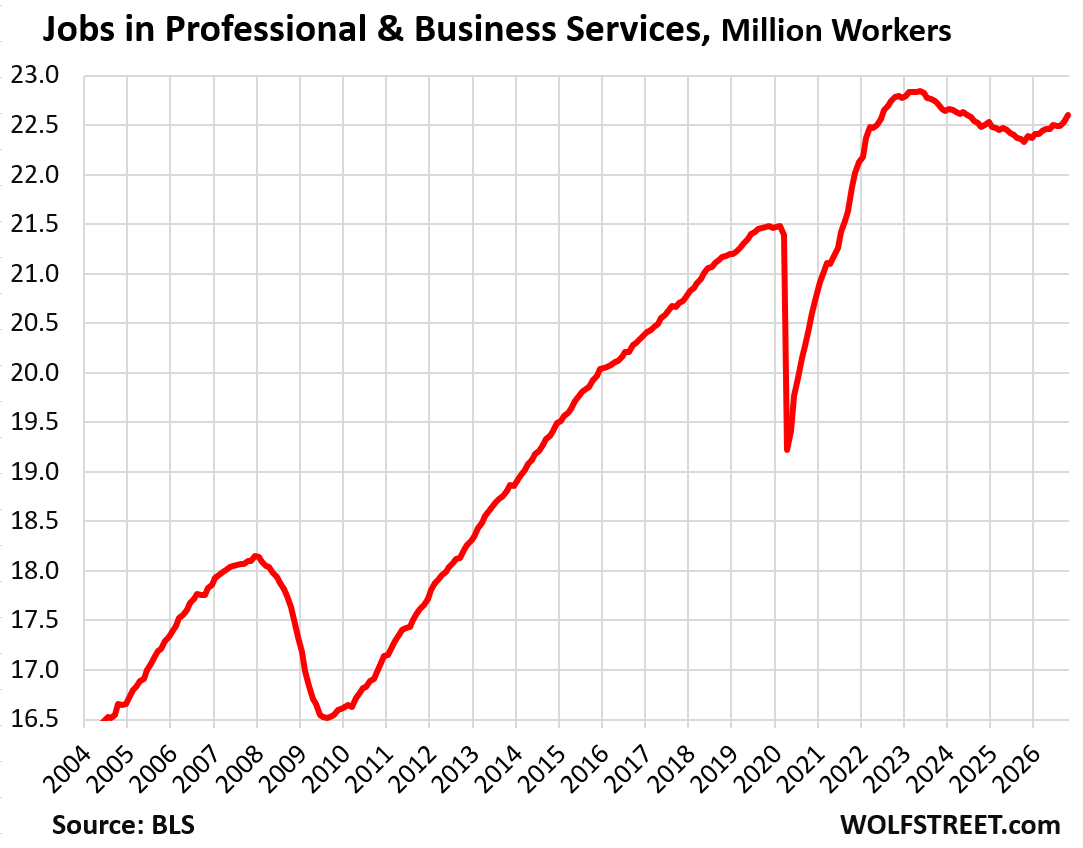
Professional and business services consists of facilities that work primarily in Professional, Scientific, and Technical Services; Management of Companies and Enterprises; Administrative and Support, and Waste Management and Remediation Services.
It includes jobs in tech, AI, social media, and many government contractors, some of which lost their contracts with the federal government amid DOGE cutbacks in 2025 and 2026.
The explosion of employment in 2021 and 2022 has been widely acknowledged as “over-hiring” coming out of the pandemic that companies subsequently sorted out. The low point was in October 2025.
- Total employment: 22.60 million
- Month-to-month: +70,000
- 3-month growth: +108,000
- 12-month growth: +269,000
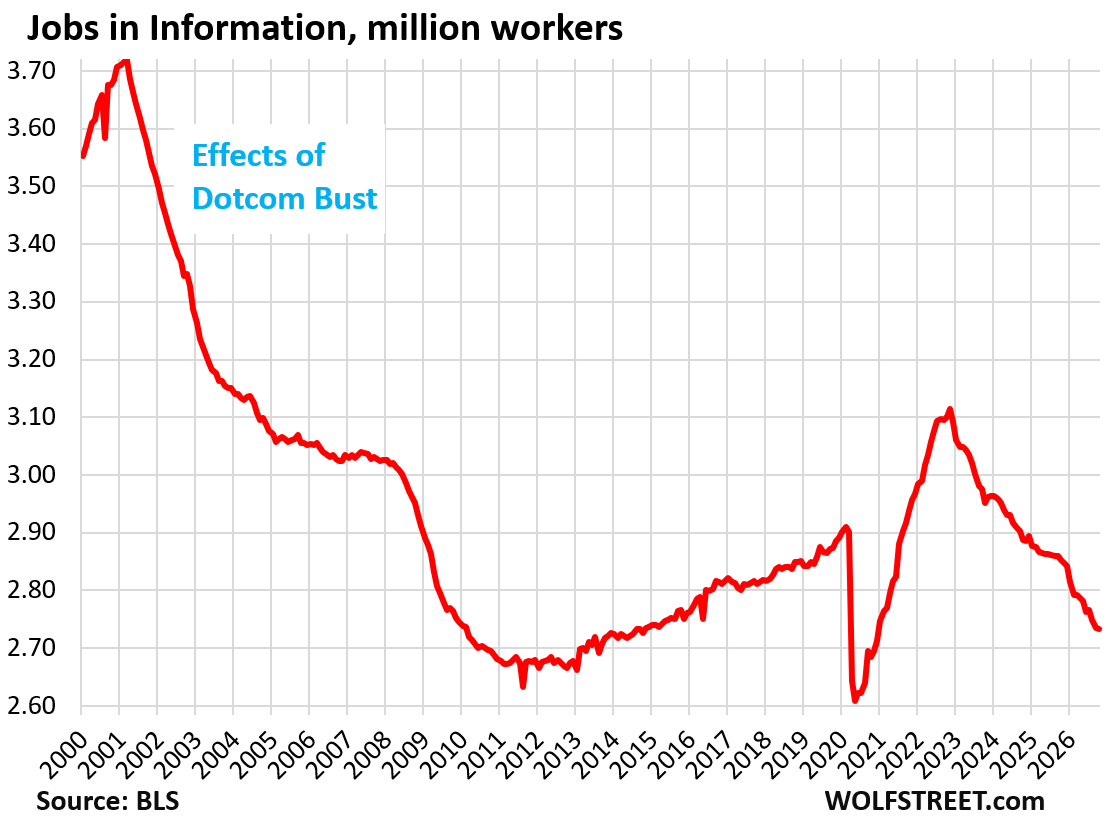
“Information” is a small category heavily impacted by AI, along with over-hiring during the pandemic and the cleanup afterwards. Employment has plunged to 2015 levels.
It includes facilities that primarily work on web search portals, data processing, data transmission, information services, software publishing, motion picture and sound recording, broadcasting including over the Internet, and telecommunications.
But it doesn’t mean that these people are unemployed. Many shifted to work locations with a different NAICS code and are now in finance, or in scientific and professional services, or other industries, doing similar work as before.
- Total employment: 2.73 million
- Month-to-month: -1,000
- 3-month growth: -33,000
- 12-month growth: -119,000
The Dotcom Bust that started in early 2000 had previously crushed the industry. I extended the chart back to 2000 to show the full effects of the Dotcom Bust on employment in this industry.
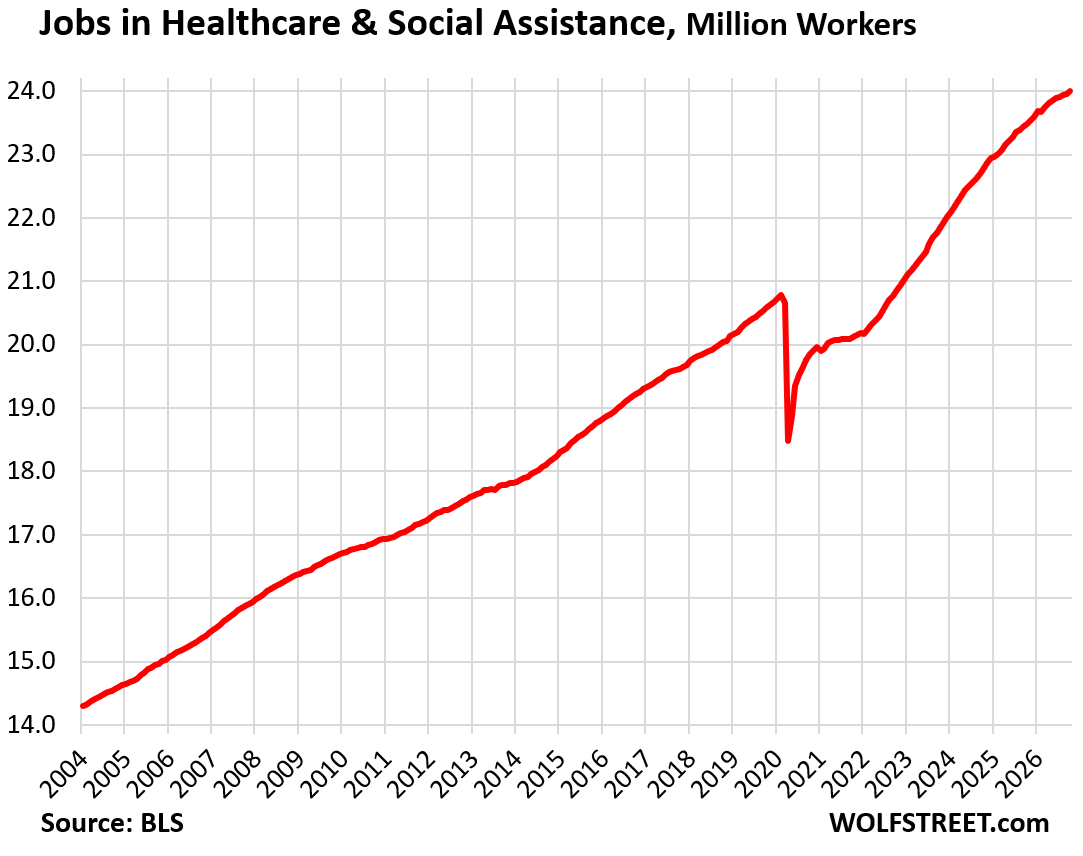
Healthcare and social assistance:
- Total employment: 24.0 million
- Month-to-month: +55,000
- 3-month growth: +104,000
- 12-month growth: 519,000
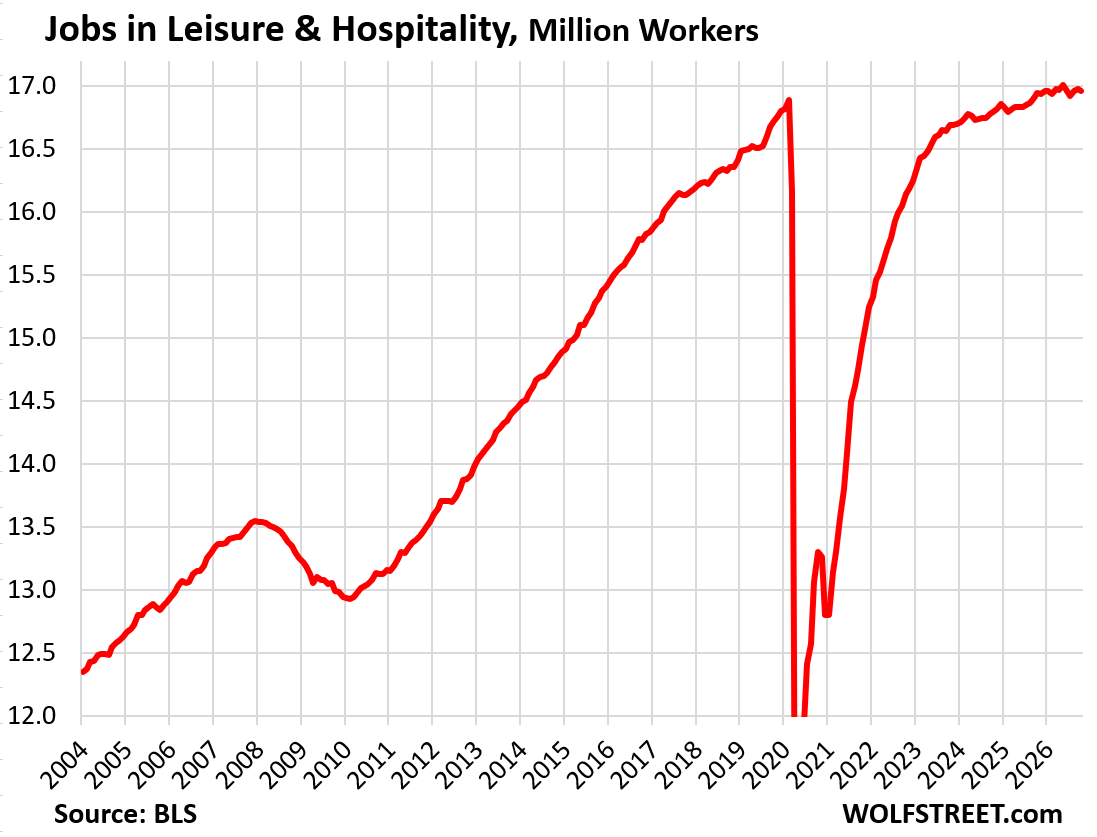
Leisure and hospitality (restaurants, bars, lodging, resorts, casinos, etc.).
- Total employment: 16.96 million
- Month-to-month: -13,000
- 3-month growth: +42,000
- 12-month growth: +16,000
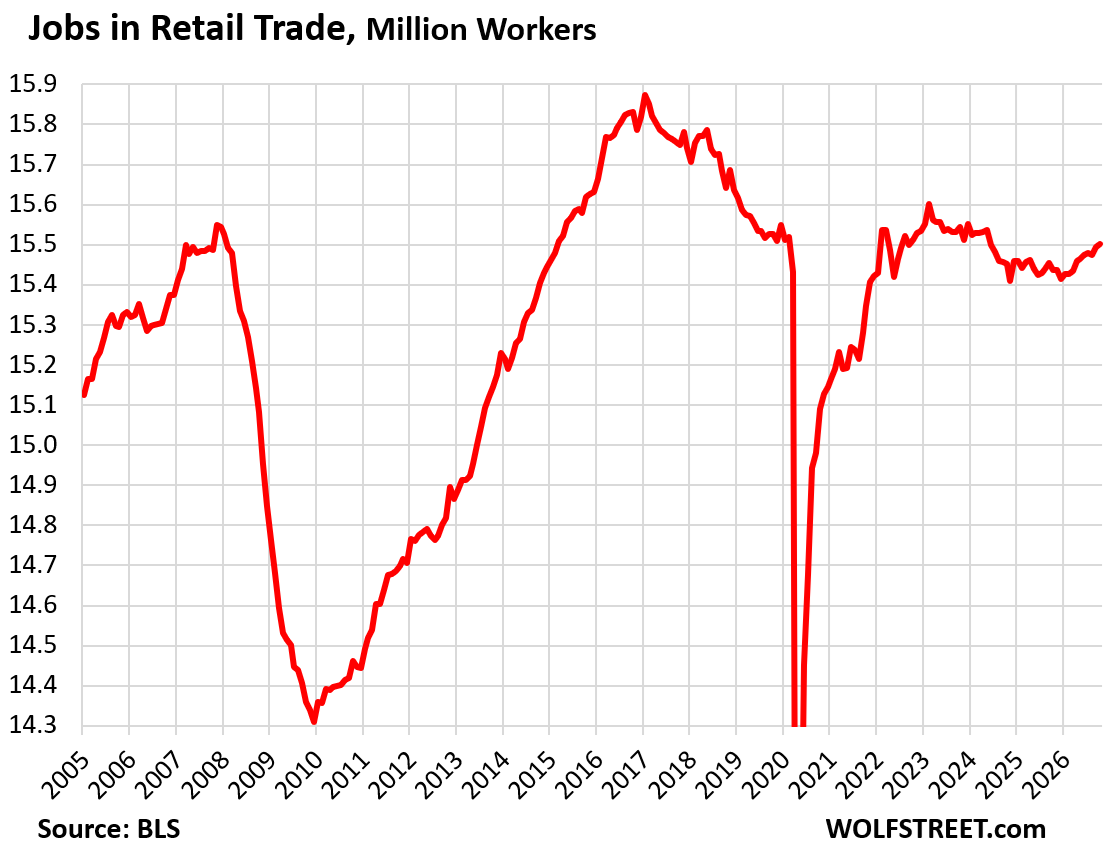
Retail trade includes workers at brick-and-mortar retail stores, such as malls, auto dealers, grocery stores, gas stations, etc., and other retail locations such as markets.
It does not include ecommerce tech jobs, drivers, and warehouse employees.
It also does not include workers at restaurants, even though the restaurants may be in malls. Those businesses are classified under Accommodation and Food Services, which is part of the Leisure and Hospitality category above.
A big part of brick-and-mortar retail got slammed by the internet. Over the past 10 years, dozens of major retail chains have been liquidated in bankruptcy court, and innumerable malls have turned into zombie malls, some of which we documented in our Brick-and-Mortar Meltdown series.
Still growing among the brick-and-mortar retailers are those that sell food, gasoline, motor vehicles, and cannabis products.
- Total employment: 15.50 million
- Month-to-month: +6,000
- 3-month growth: +22,000
- 12-month growth: +63,000.
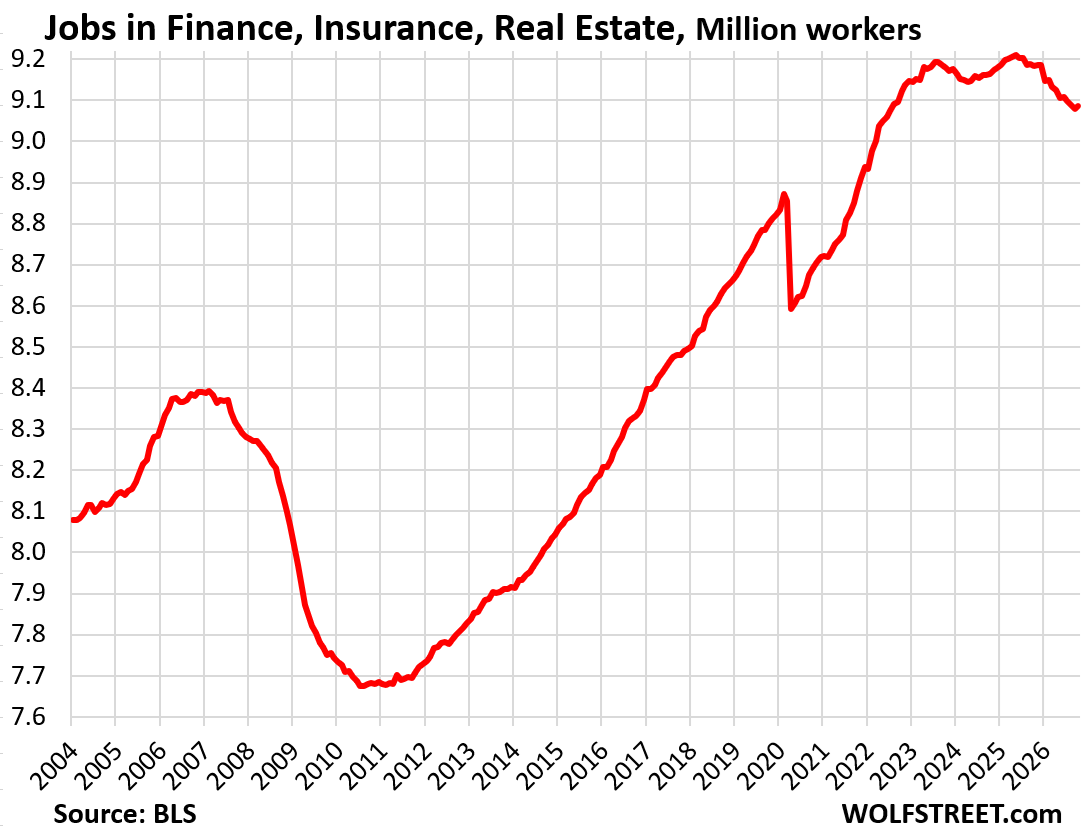
Financial activities include locations that engage primarily in finance and insurance, mortgage lending and brokering, and real estate renting, leasing, buying, selling, and management. Real-estate related jobs have gotten crushed, starting in 2022.
- Total employment: 9.08 million
- Month-to-month: +7,000
- 3-month growth: -13,000
- 12-month growth: -99,000.
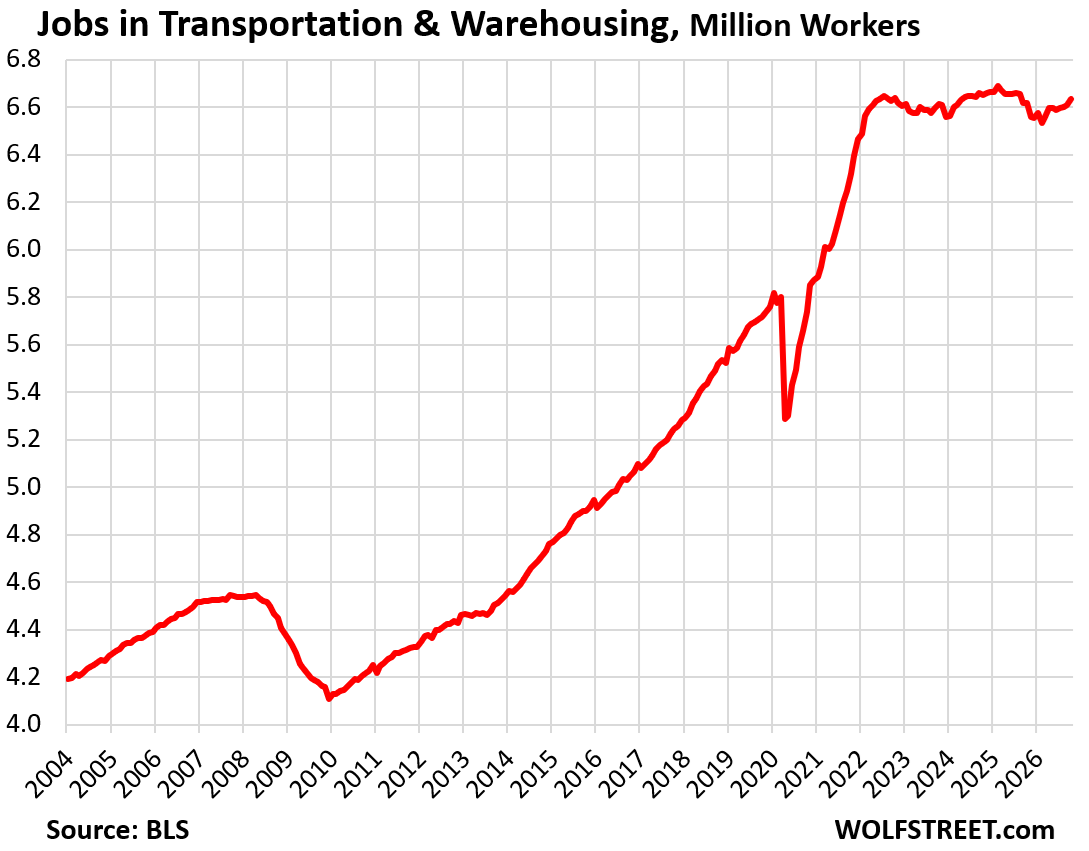
Transportation and Warehousing:
- Total employment: 6.64 million
- Month-to-month: +25,000
- 3-month growth: +38,000
- 12-month growth: +17,000.
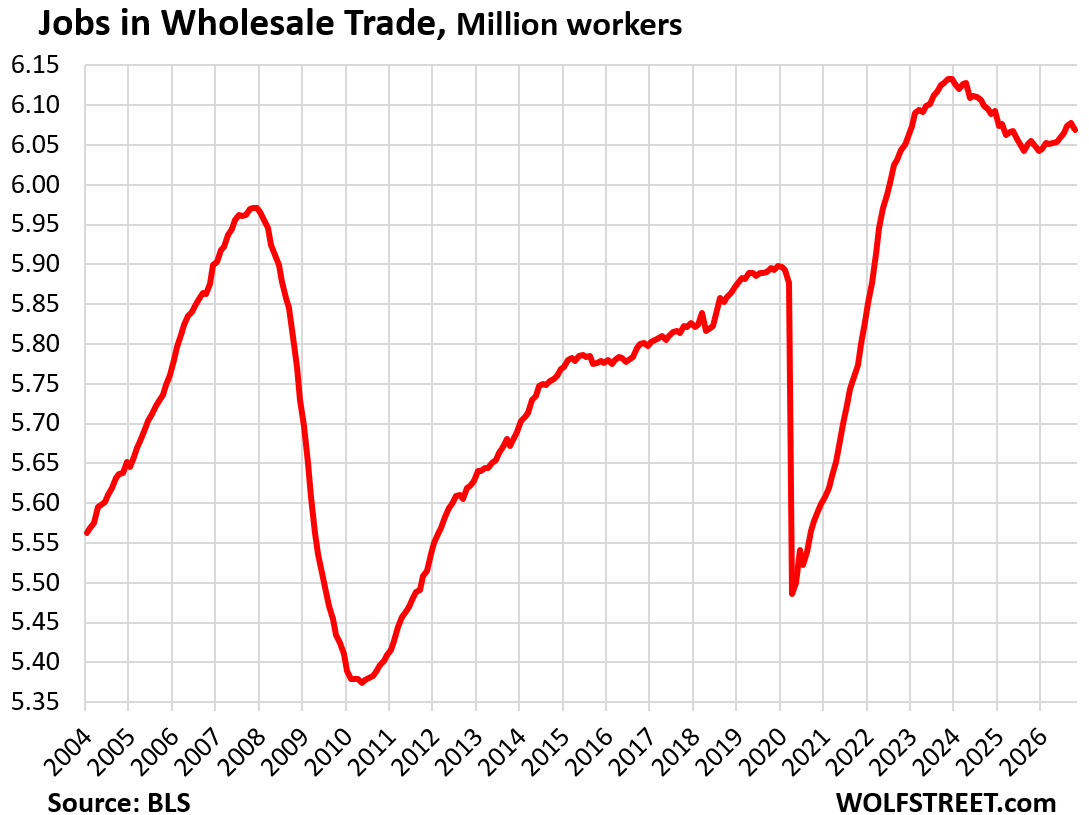
Wholesale Trade:
- Total employment: 6.07 million
- Month-to-month: -9,000
- 3-month growth: +3,500
- 12-month growth: +14,000.
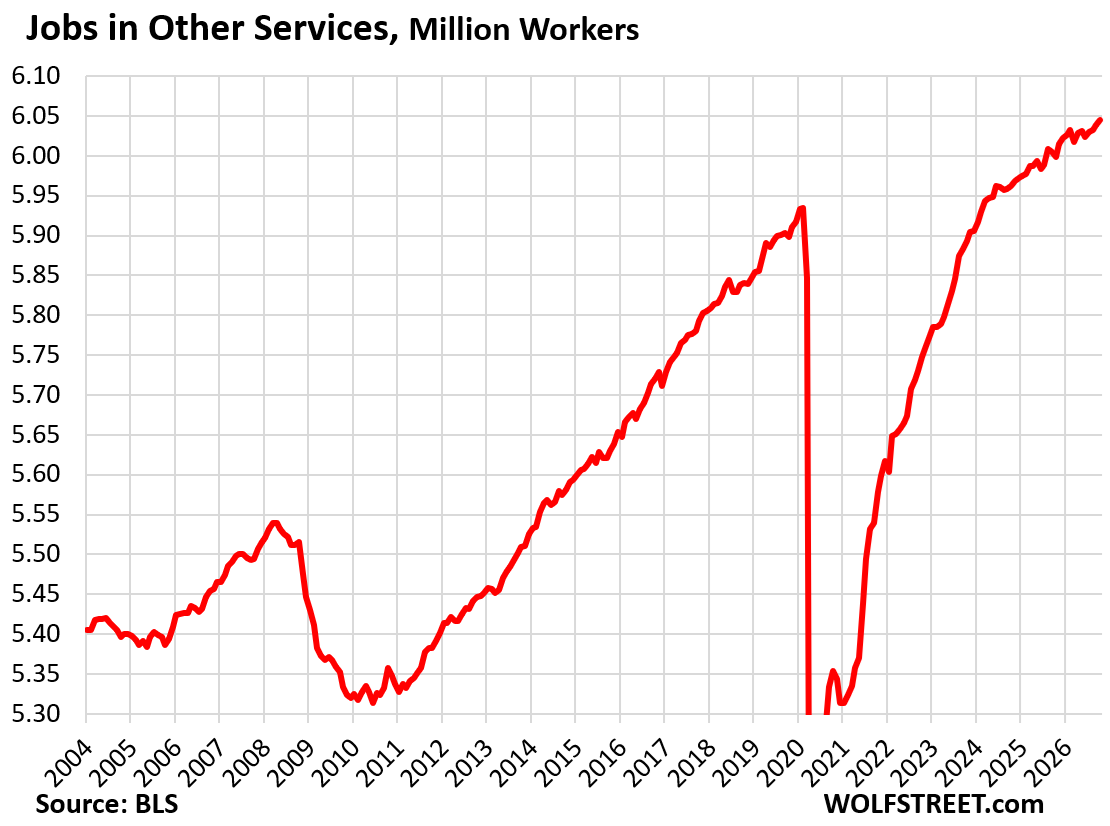
“Other services” include equipment and machinery repairing; promoting or administering religious activities; grantmaking; advocacy; dry-cleaning and laundry services; personal care services; death care services; pet care services; temporary parking services; and dating services.
- Total employment: 6.05 million
- Month-to-month: +6,000
- 3-month growth: +15,000
- 12-month growth: +46,000.
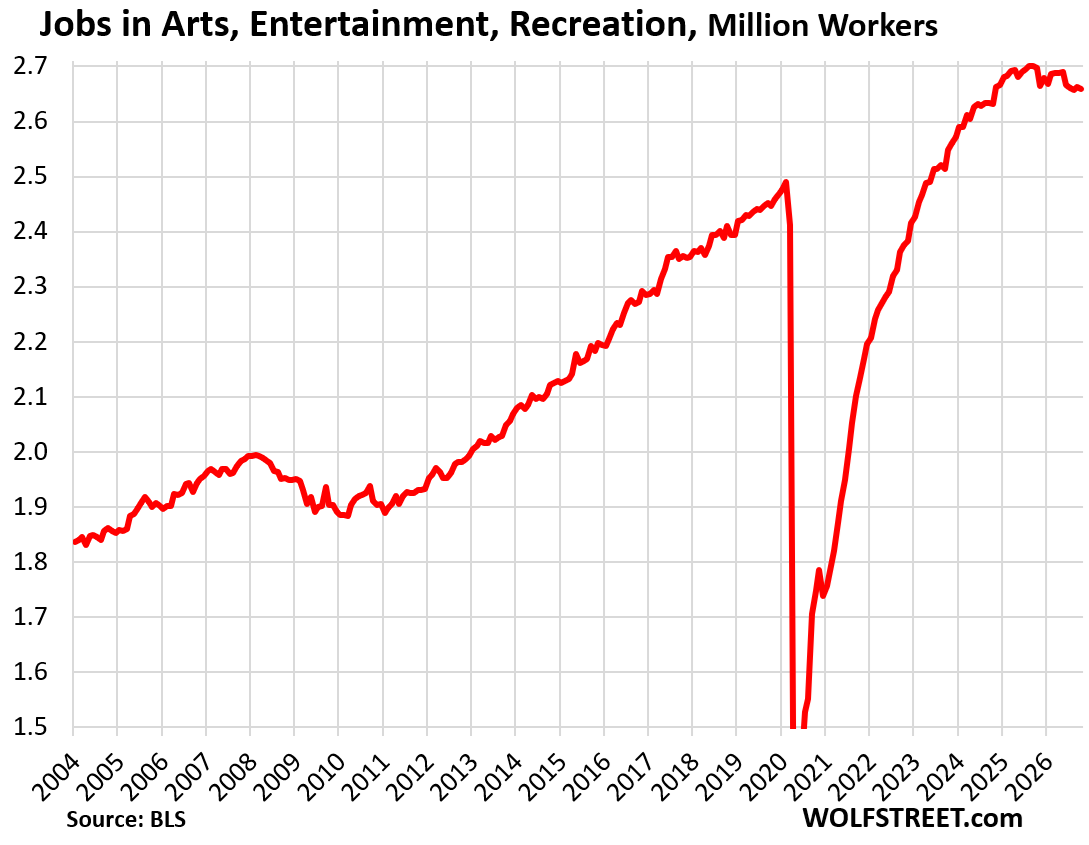
Arts, Entertainment, and Recreation:
- Total employment: 2.66 million
- Month-to-month: -2,600
- 3-month growth: -500
- 12-month growth: -38,000.
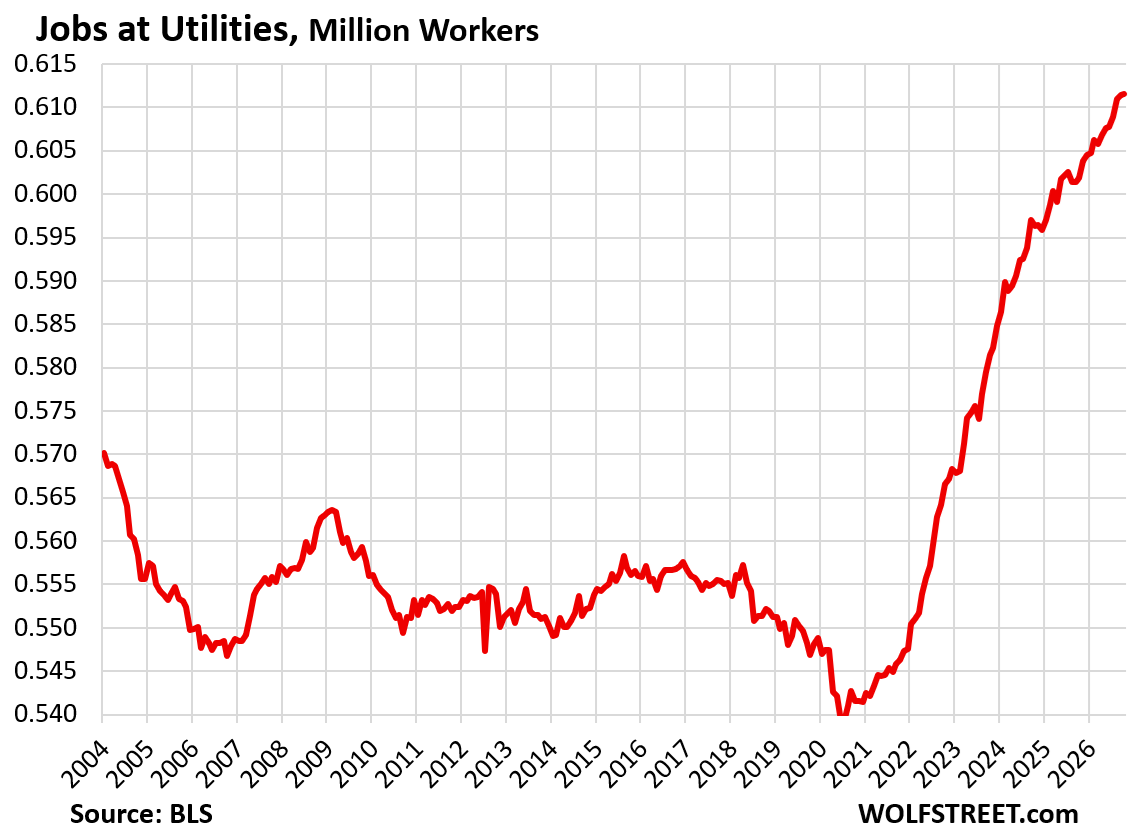
Utilities have a big economic impact with a small workforce. The AI data center construction boom and the separate factory construction boom have hit them with suddenly growing demand for electricity, and they’ve been on a hiring boom since 2021.
- Total employment: 612,000
- Month-to-month: +1,000
- 3-month growth: +2,600
- 12-month growth: +10,000.
Government jobs.
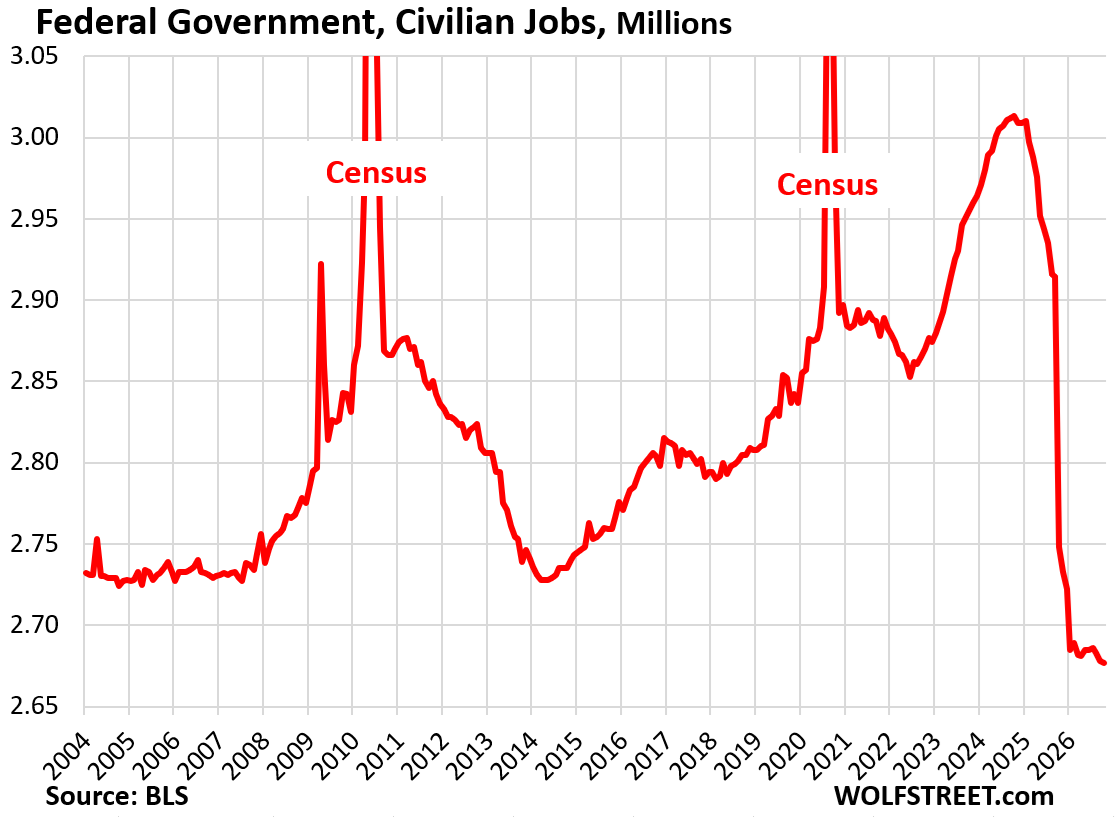
The federal government has shed 333,000 civilian jobs, or 11% of its payrolls, since January 2025.
This does not include the workers at government contractors that lost their contracts; they’re in private-sector categories, such as in “Professional and business services.”
Federal government jobs now account for just 1.68% of total nonfarm payrolls, the lowest in the data going back to 1939.
- Total employment: 2.68 million.
- Month-to-month: -1,000
- 3-month growth: -9,000
- 12-month growth: -71,000
- Since January 2025: -333,000.
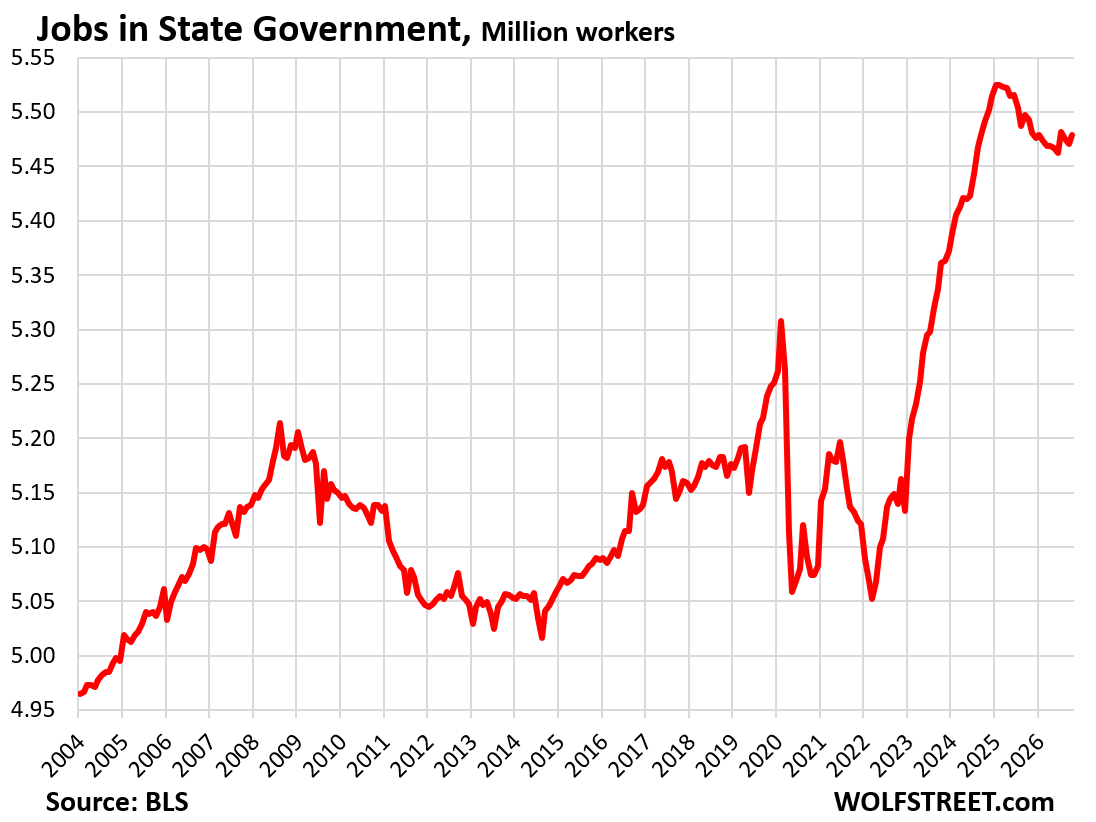
State governments have shed 46,000 employees since January 2025. Their vast state university systems, the largest employers in state government, have been struggling with declining enrollment, especially of foreign students.
- Total employment: 5.48 million.
- Month-to-month: +8,000
- 3-month growth: -3,000
- 12-month growth: -14,000
- Since January 2025: -46,000.
Employment at state governments accounted for 3.4% of total nonfarm payrolls, down from 3.7% two decades ago.
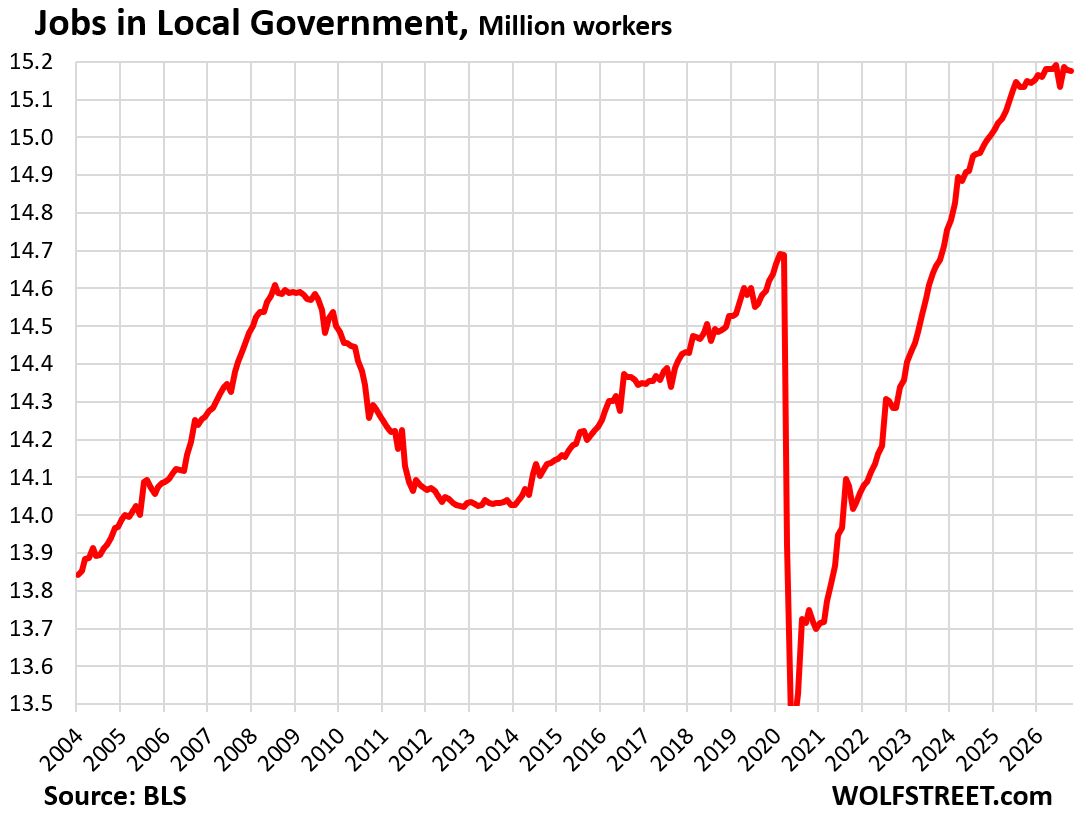
Local government jobs are mostly in education from preschool across all grades to community colleges and trade schools; in healthcare; and in law enforcement and first-responders. They accounted for 9.5% of total nonfarm jobs, down from 10.5% two decades ago.
- Total employment: 15.18 million.
- Month-to-month: -1,000
- 3-month growth: +44,000
- 12-month growth: +27,000
In case you missed it: Signs Pile up of a Solid and Tightening Labor Market
Enjoy reading WOLF STREET and want to support it? You can donate. I appreciate it immensely. Click on the mug to find out how: