
The Fed and mortgage rates.
By Wolf Richter for WOLF STREET.
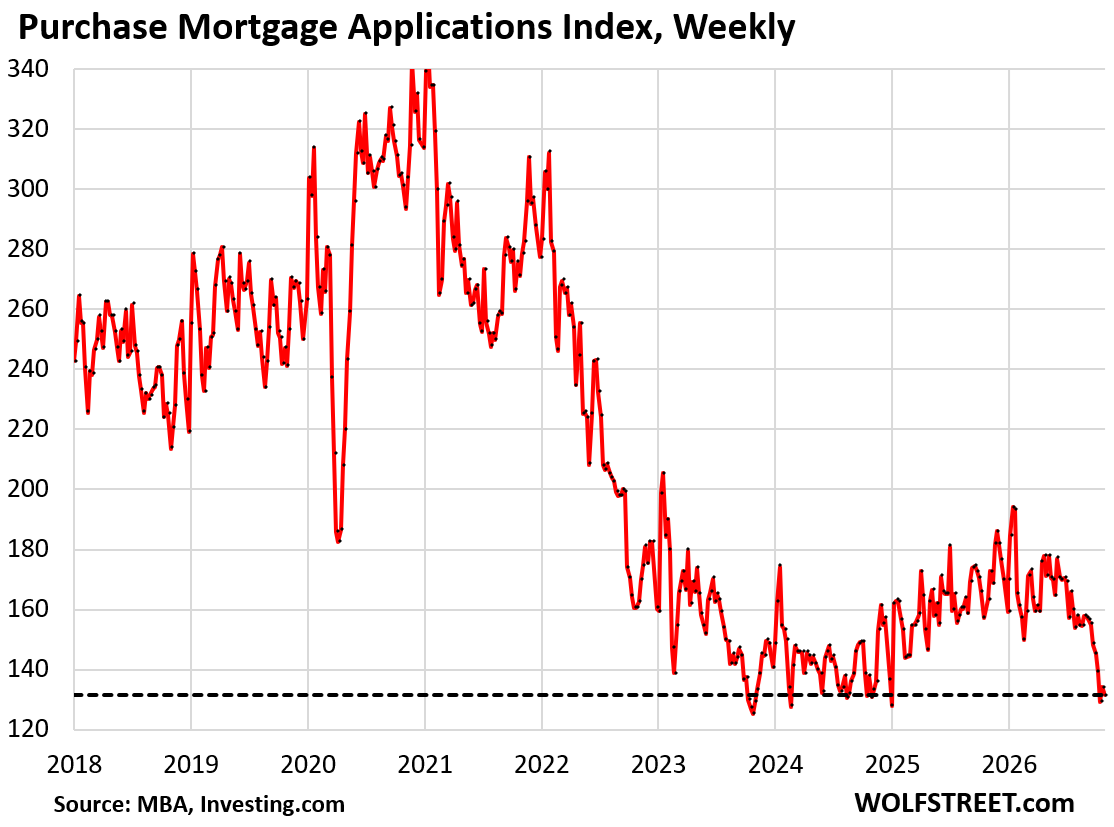
Demand for mortgages to purchase a home – a forward-looking indicator for demand in the housing market – dipped again in the latest reporting week through October 30 and remained at rock-bottom levels, down by 20% from the already low levels a year ago, and down by 45% from the same week in 2019, according to data by the Mortgage Bankers Association today.
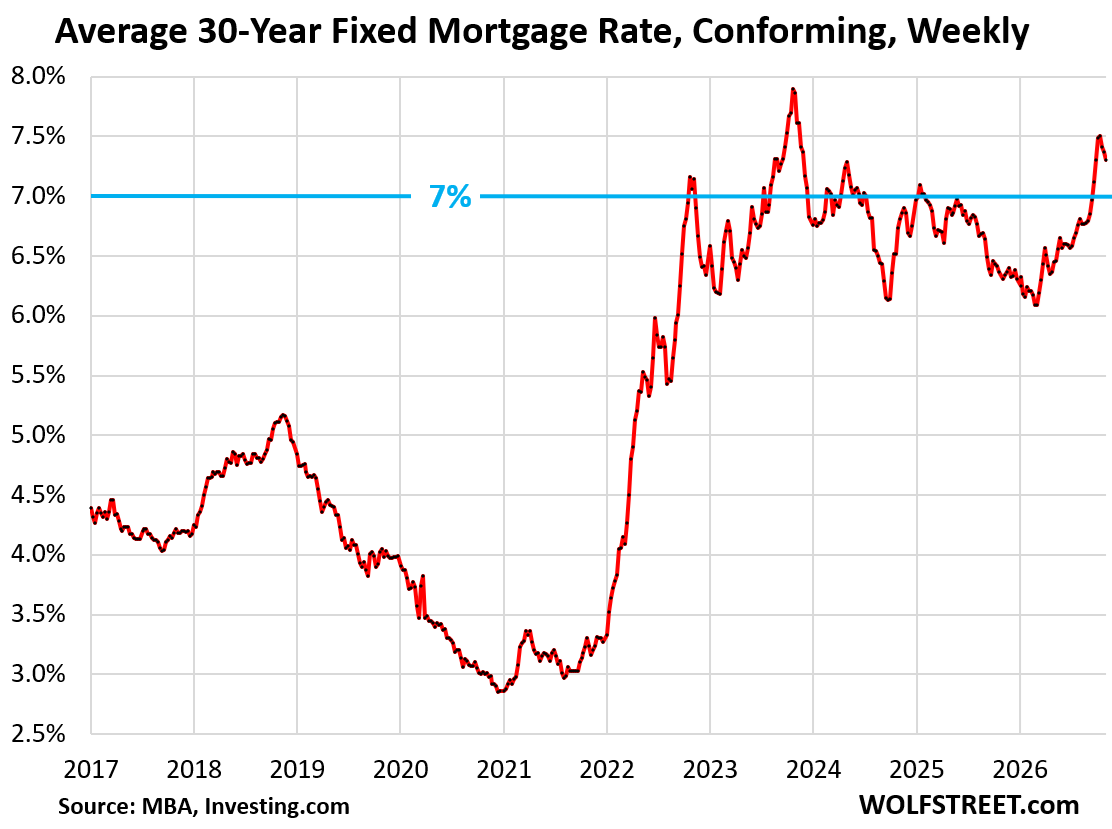
And yet, mortgage rates dipped for the third week in a row, to 7.30%, according to the MBA today. But that wasn’t enough of a dip to tease mortgage demand off rock-bottom levels. Mortgage rates in the 7%-plus range seem to be the no-go zone.
Purchase mortgage applications are a forward-looking indicator of the direction of “pending” sales and then “closed” sales to be reported in December and later. This is a bad sign because pending home sales in September had collapsed to record lows in the data, and these pending sales include cash deals.
The average weekly mortgage rate for conforming 30-year fixed mortgages dipped for the third week in a row, to 7.30%, according to the Mortgage Bankers Association today.
This measure of the average 30-year fixed mortgage rate has been in the 6-8% range for over four years, since early September 2022.
During the normal times, before the Fed’s QE and interest rate repression started in 2008, those 7%-plus mortgages were considered normal and for many years low.
The Fed and mortgage rates.
Mortgage rates track the yields of mortgage-backed securities (MBS), but are higher, and yields of MBS track yields of long-term Treasury securities, but are higher, and that spread between them varies over time.
Mortgage rates are not determined by the Fed’s policy interest rates – which it left unchanged at the last FOMC meeting, at 3.75% to 4.0%. The Fed’s policy rates directly affect only short-term rates, such as repo market rates (tracked by SOFR and others) and indirectly affect other short-term rates, such as Treasury bill yields.
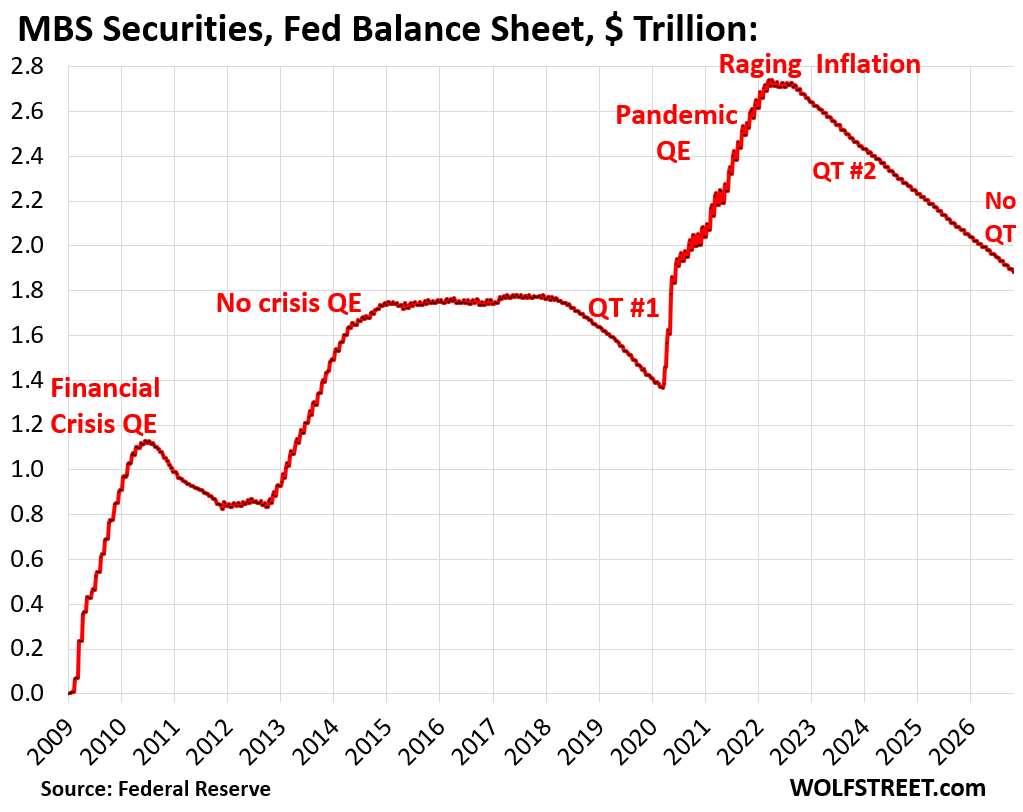
But the Fed can manipulate long-term rates, including mortgage rates, via its balance sheet. The Fed purchased trillions of dollars of Treasury securities and MBS during the pandemic and in prior QE operations starting in 2008. These massive purchases, with money the Fed created in the process, pushed down yields of long-term Treasuries and MBS, and thereby pushed down mortgage rates, ultimately below 3% in late 2020 and early 2021, even as inflation had begun to surge, which triggered the worst home price explosion in history.
The Fed stopped buying MBS in 2022, when its MBS holdings peaked at $2.74 trillion, and has since then shed MBS, and it continues to shed MBS, at a rate of about $15-18 billion a month. Since that peak, it has shed $866 billion of MBS, and the balance is down to $1.88 trillion.
For the past two years, the Fed has consistently stated that it wants to get rid of its MBS holdings entirely.
QT ended in November 2025, but MBS continue to come off the balance sheet as the Fed receives the passthrough principal payments from the MBS. In December 2025, as QT had ended, the Fed started replacing the long-term MBS that come off the balance sheet with short-term T-bills.

The problem in the housing market today is the home price explosion from mid-2020 to mid-2022, and now prices are too high and don’t make economic sense. High home prices entail high carrying costs all around, including homeowners’ insurance premiums, property taxes, and HOA fees.
And home-price increases cannot be taken for granted to make up for the high carrying costs, and have already turned into home price declines in many markets (read: Oh Dear, Prices of Single-Family Homes Fell by 11% to 26% in 16 Bigger Markets Already.)
Renting has become a far cheaper option on a monthly basis in many markets, including renting new single-family homes purpose-built as rentals, one of the hottest trends in real estate, which is dragging demand away from the purchase market.
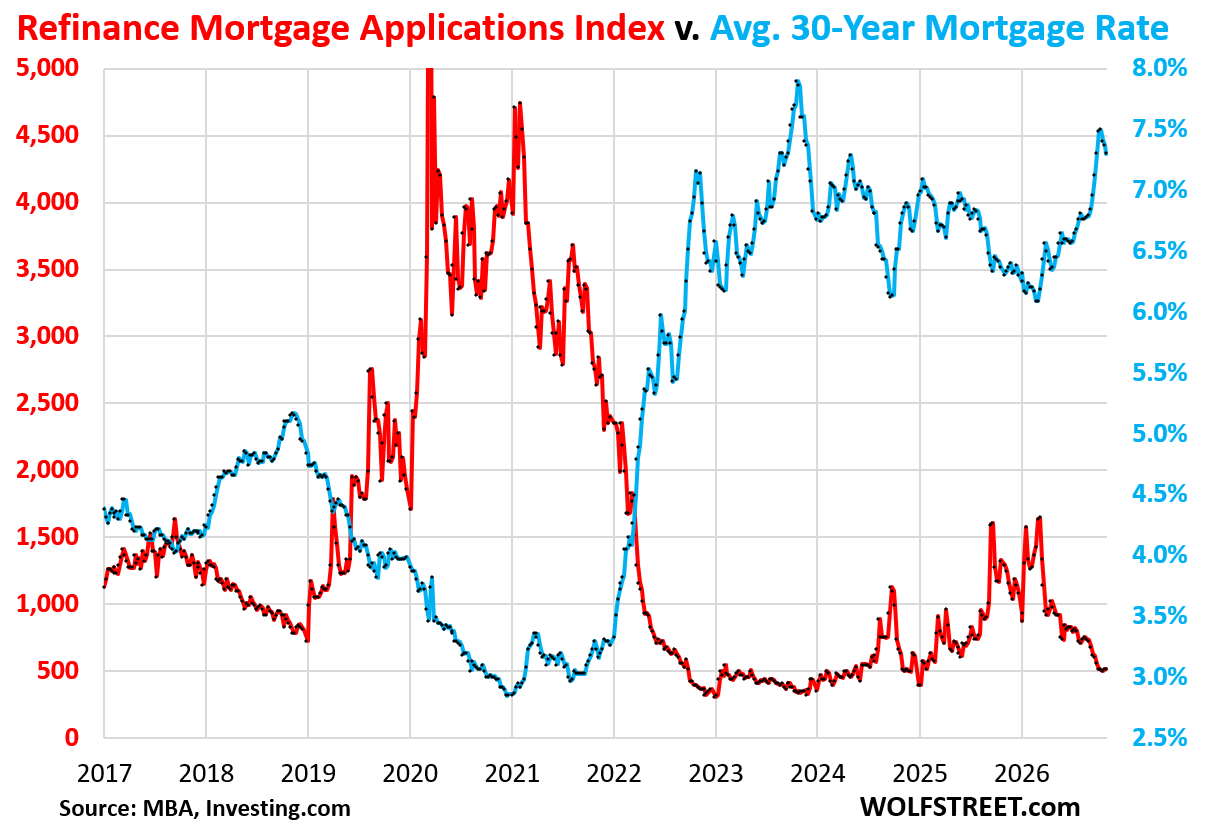
Mortgage applications to refinance a home were essentially unchanged at rock-bottom levels for the past five weeks, down by 60% year-over-year and down by 75% from the same week in 2019, even as mortgage rates dipped, according to data from the MBA today.
Refinance applications react inversely to changes in mortgage rates: Higher mortgage rates cause refinance applications to dry up; lower mortgage rates trigger mini-booms of refinancing.
But clearly, mortgage rates, though they’ve edged down for three weeks, haven’t dropped nearly enough to stimulate refinance activities. They’re still above 7%, and that may be the no-go zone for refinancings.
This chart shows that inverse relationship between mortgage rates (blue) and applications to refinance a mortgage (red):
In case you missed it: The Growth of the Vacant Housing Stock in the US
Enjoy reading WOLF STREET and want to support it? You can donate. I appreciate it immensely. Click on the mug to find out how: