
Total housing units grew by 1.51 million YoY (new construction minus demolition). Vacant for-sale & for-rent units jumped by 7.1%, to 4.93 million, highest since 2013.
By Wolf Richter for WOLF STREET.
The total US housing stock grew by 358,000 housing units in Q3 and by 1.512 million for the past four quarters, to 149.8 million housing units, according to the Census Bureau today. This is the net increase of new construction minus demolitions. Abandoned, dilapidated, or uninhabitable housing units are excluded from this count.
These are single-family homes, townhomes, duplexes, ADUs, etc., and units in multifamily buildings, such as condos and apartments.
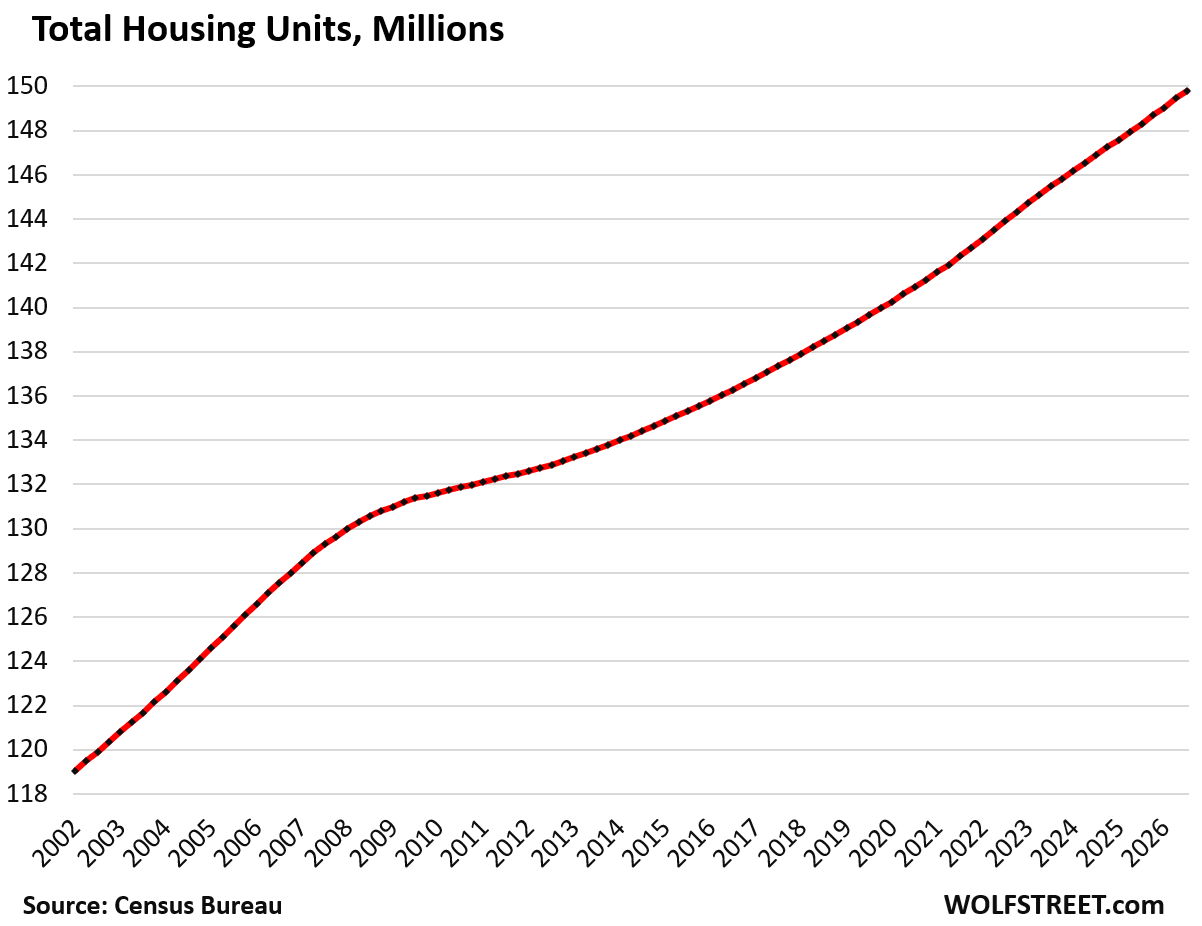
This net increase of 358,000 housing units in Q3 provides housing for an additional 895,000 people, given the average household size in the US of about 2.5 people.
On an annual basis, the net increase of 1.512 million housing units provides housing for an additional 3.78 million people.
But population growth has slowed to a crawl, amid the crackdown on illegal immigration and tightening up of legal immigration. For the 12-month period through July 2026, the population increased by only 757,000 people, according to separate estimates by the Census Bureau earlier this year. The result is growth in vacant housing units.
The ballooning vacant housing stock.
The number of vacant housing units in Q3 grew by 169,000 quarter over quarter, and by 591,000 year-over-year, to 15.81 million vacant housing units.
Of these 15.81 million vacant housing units, 12.34 million were “year-round vacant,” or 8.2% of the total housing stock.
“Year-round vacant” does not mean that they were vacant for an entire year; it means they are intended for occupancy at any time of the year, as opposed to “seasonal vacant” housing units which are intended for seasonal occupancy (3.47 million units).
The 12.84 million year-round vacant housing units.
The number of year-round vacant housing units grew by 123,000 in the quarter (+1.0%) and by 463,000 year-over-year (+3.9%), to 12.34 million units.
The Census Bureau classifies year-round vacant housing units as:
- Vacant for rent
- Vacant for sale
- Rented or sold but new tenants/owners not moved in
- Held off the market:
- For occasional use
- Temporarily occupied by persons with usual residence elsewhere
- Vacant for other reasons
Vacant, on the market for sale or for rent jumped by 184,000 units in the quarter (+3.9%) and by 327,000 units year-over-year (+7.1%), to 4.93 million vacant units for sale or for rent, the highest since 2013 when the count was coming down from the Housing Bust.
Over the past five years, vacant-year-round units for rent and for sale surged by 1.48 million units.
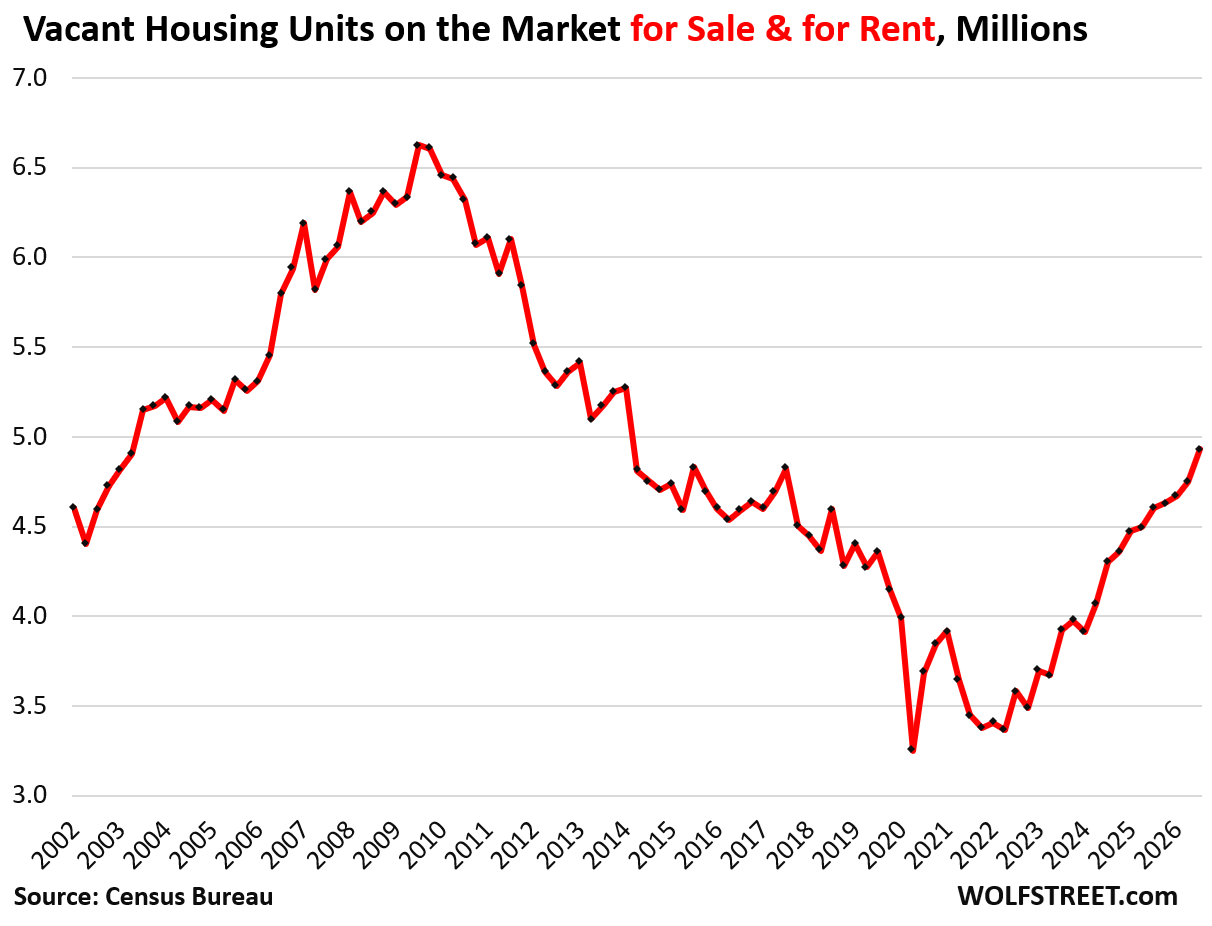
Amid the current difficulties in selling a home (because prices are too high, and sellers loathe to cut them), homeowners have been shifting for-sale units to the for-rent market.
If they succeed in renting out the unit, the owners become what the industry calls “accidental landlords,” and their units shift from the vacant housing stock to the occupied housing stock.
If they don’t succeed, those units remain in the vacant housing stock, whether for rent or for sale.
If they pull the unit off the market, it enters the category “held off the market,” that we’ll see in a moment.

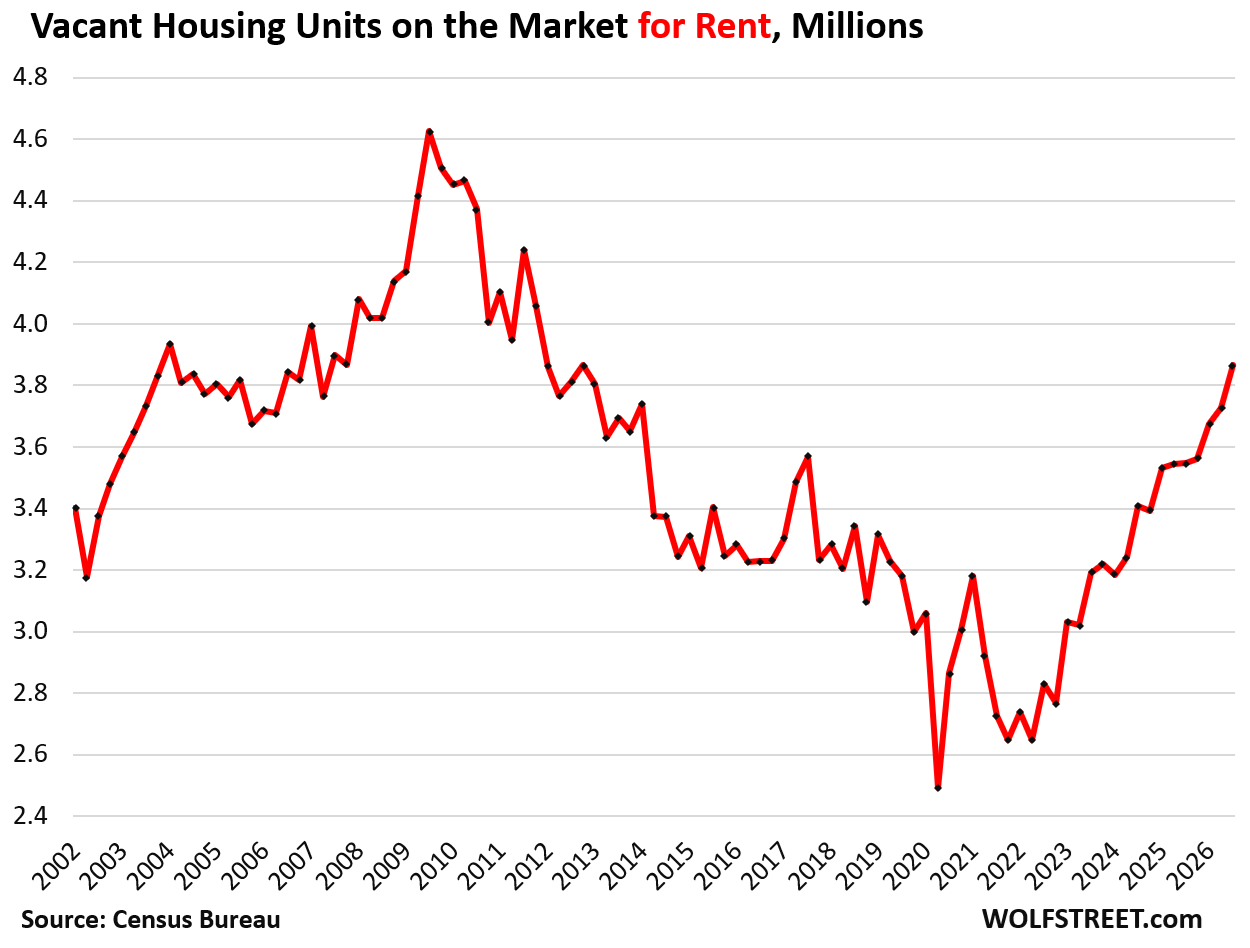
Vacant on the market for rent spiked by 139,000 units in the quarter (+3.7%) and by 319,000 units year-over-year (+9.0%), to 3.87 million, the most since 2011.
This includes the surge of the “accidental landlords” that tried to sell their home, but couldn’t find a buyer because the price was too high, and so now they’re trying to find a tenant but haven’t found one yet because the rent is too high.
Over the past five years, year-round vacant for-rent units rose by 1.14 million homes.
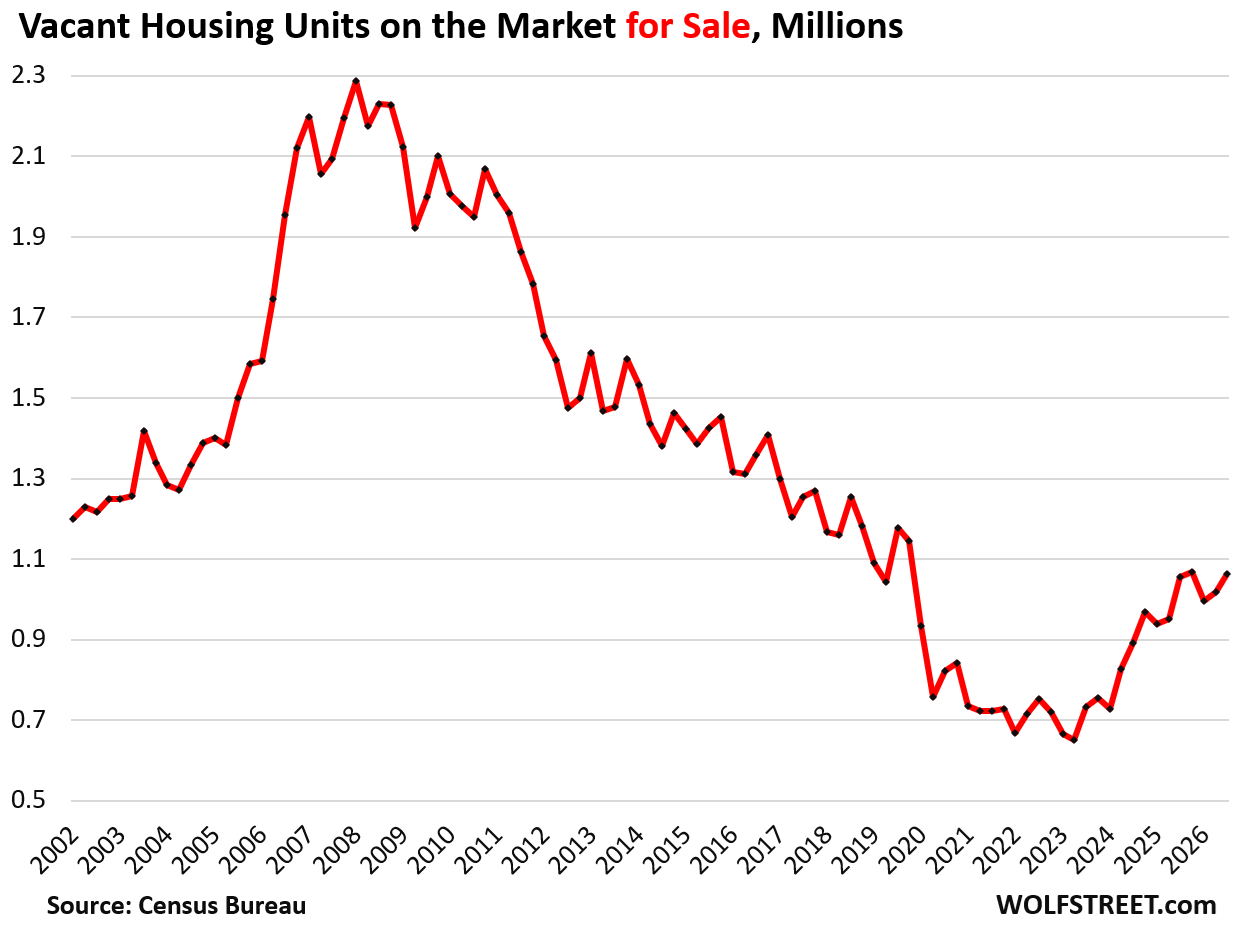
Vacant on the market for sale jumped by 45,000 in the quarter (+4.4%) and by 8,000 year-over-year (+0.8%) to 1.06 million units.
Over the five-year period, vacant for-sale units surged by 341,000 (+8.5%).
Note: This does not include occupied homes that are for sale. Those units are in the “occupied housing units” category, not in the “vacant” category. These are vacant homes for sale.
And remember: A portion of what used to be vacant for-sale housing units, and used to be in this category, are now vacant for-rent units in the “vacant for-rent” category above.
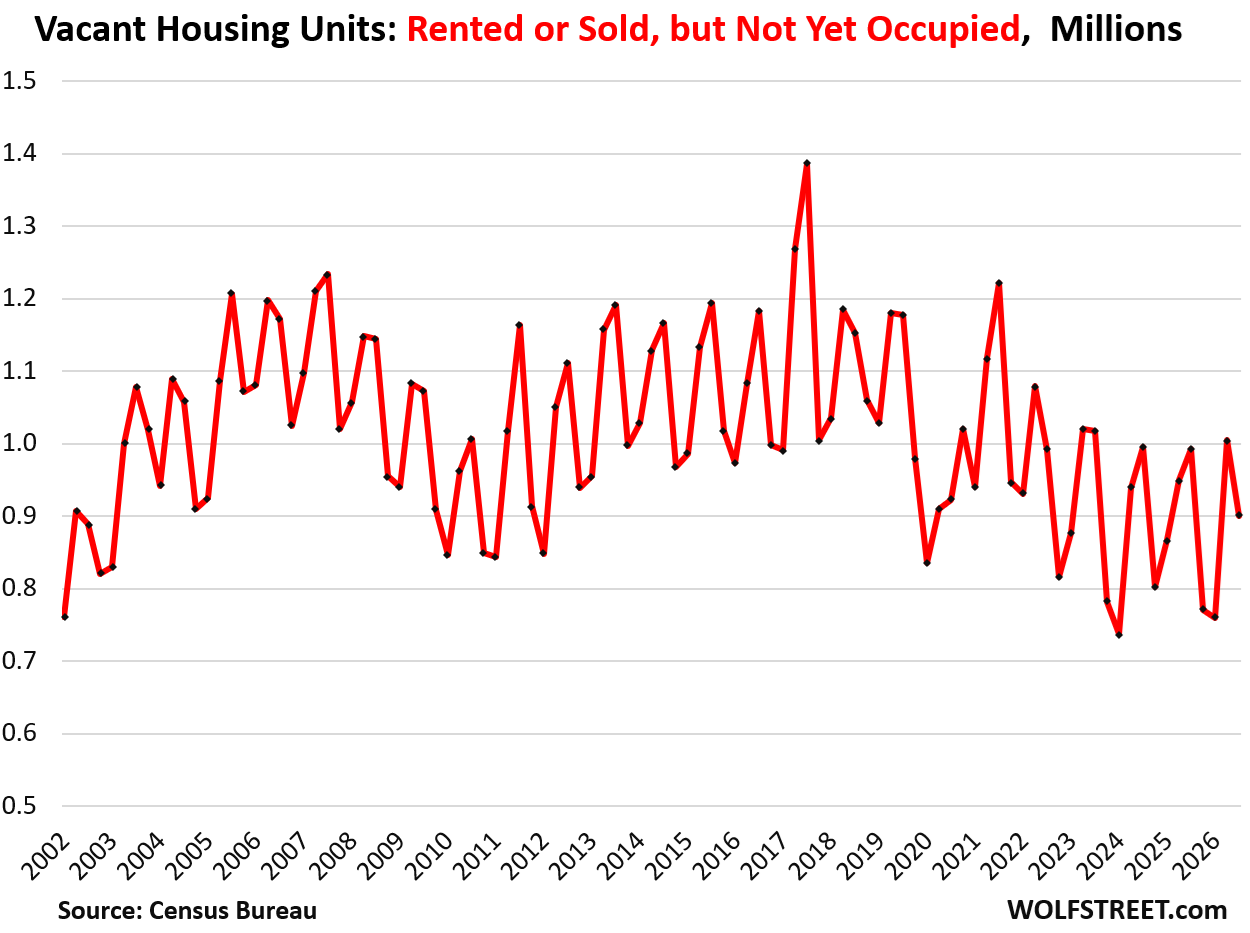
Vacant but rented or sold and not yet occupied units declined in the quarter by 104,000 units and year-over-year by 92,000 units, to 901,000 housing units.
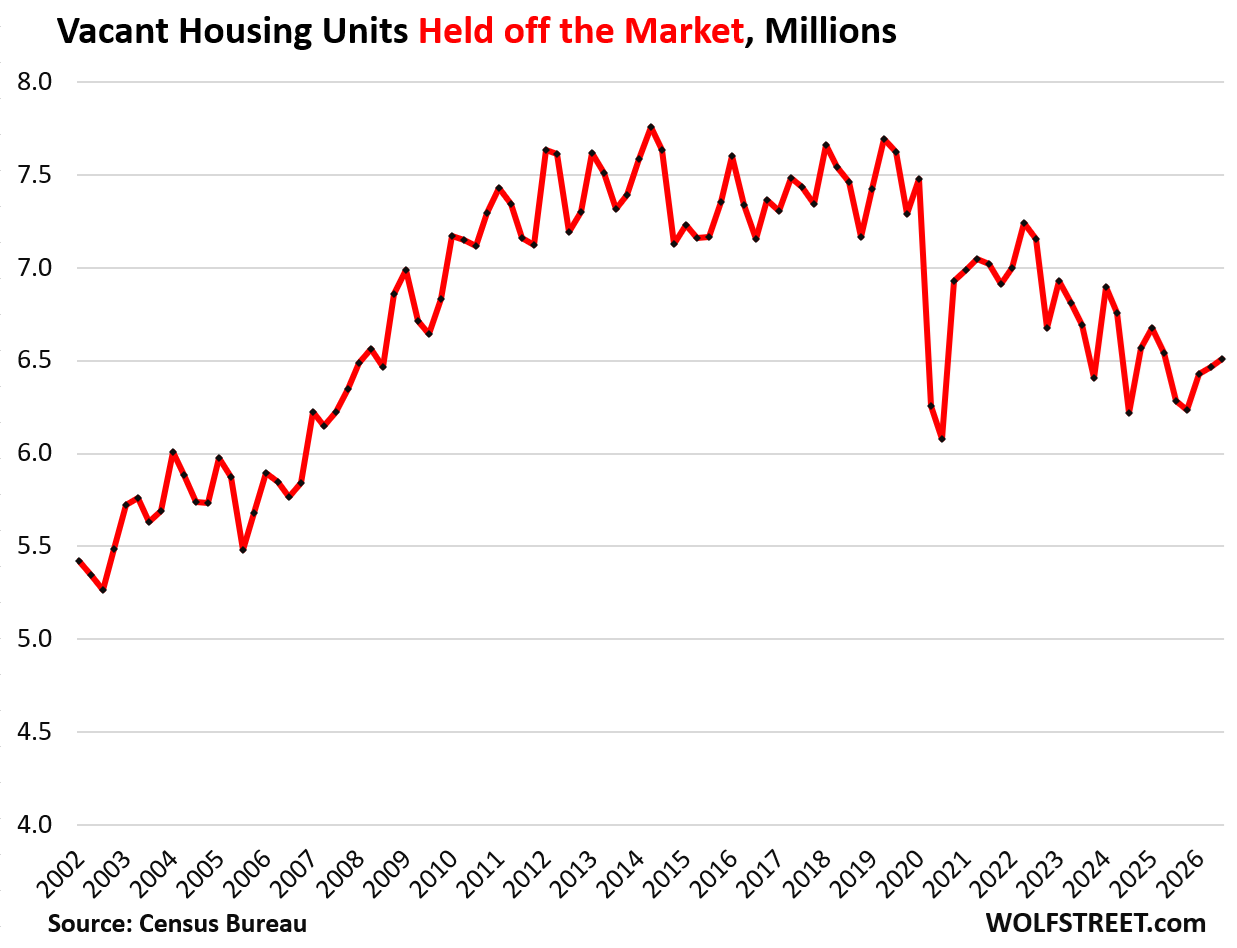
Shadow inventory, vacant and held off the market: Of those 12.84 million year-round vacant housing units, 6.51 million were “held off the market” for a variety of reasons.
A portion of the held-off-the-market units constitutes the vacant shadow-inventory that will show up on the for-sale or for-rent market at some point.
Vacant units are “held off the market” fall into three categories:
- Held for occasional use
- Temporarily occupied by persons with usual residence elsewhere
- “Vacant for other reasons” (such as settlement of an estate, held off the market for personal reasons of the owner).
The count of year-round vacant “held off the market” units has shrunk over the past five years as the number of housing units that were vacant for-sale and vacant for-rent surged over the same period. So those held-off-the-market units came on the market, and the shadow inventory became the actual inventory.
But the number of held-off-the-market units increased by 43,000 in Q3 and by 227,000 year-over-year. So the shadow inventory increased a little:
In related matters:
Enjoy reading WOLF STREET and want to support it? You can donate. I appreciate it immensely. Click on the mug to find out how:


At today’s home price levels, the opportunity cost of holding a vacant investment home is very high. Real costs add up. RE tax, utilities, insurance, maintenance, plus probable loss of home value and rents the next several years at most locations.
Isn’t it easier and less risky to just sell the home and collect 6% on bonds?
Perhaps, easy to markdown and sell, not so easy to buy.
In Houston, as usual, surrounded by cheap apartments and build to lease developments. Gotta borrow and build to live off of construction loans. Same old story.
Selling a home right now is no picnic.
If property owners made objective business decisions, yes selling a vacant house now is a good idea. Which is why Mega holders are doing just that, as Wolf posted a few days ago. Small investors, largely boomers, are too stuck on the prices Zillow told them their homes were worth to make sound business decisions and are just hoping/praying rates get cut and housing shoots back up again. They’d rather rack up big losses than give younger people a slightly reasonable price for their house.
I like to think that I made an objective business decision. I sold my home a little less than a year ago because I have a much larger move planned in a few months. I figured that the likelihood that I’d get a good price would diminish as time went along. Now in my new target market, I see almost every house for sale being discounted at least once before it sells. Happy now to sit on my hands and wait for the market to come to me.
Fingers crossed for young people to get a chance
There is a major new website that has this title today- “3 reasons home prices keep going up, even though fewer people
are buying.” There’s a paywall, so I couldn’t read it, but immediately three reasons rushed through my mind: 1) Manipulation, 2) Manipulation, and 3) Manipulation. No other reasons make any sense.
???
Oh Dear, Prices of Single-Family Homes Fell by 11% to 26% in 16 Bigger Markets Already
For example:
Imagine paying the paywall fee, and getting a bunch of AI regurgitation instead of actual data. Thanks Wolf!
It’s not all manipulation. Some of it is innumeracy. In a late-stage market the “sales mix” skews towards higher-end properties. That pushes up “average” and “median” sale prices even when actual prices for comparable houses are falling.
But like most things, houses don’t “go up even more in price” when the less-wealthy stop buying due to high prices. It’s just that wealthier people keep buying, so more sales are at the high end and less at the low end.
Realtors and others hype the “average” and “median” prices. Some simply don’t understand statistics. Others just need to make a sale as their local inventory is rising, comp prices are dropping, and days-on-market stretching out.
The Case-Shiller index was designed to work around this problem, but it has its own methodology flaws and also lags the market by several months.
Does “held off the market for occasional use” include second homes, or are those accounted for elsewhere? Interesting that the whole “held off the market” peaked around ten years ago and has been trending down.
A vacation home that is being used seasonally, such as in ski resorts etc. doesn’t count at all in the “year-round vacant” tally here. It counts in the “seasonal vacant” tally.
A second home that people with a permanent residence elsewhere go to occasionally whenever, not seasonally, and that is otherwise vacant, falls into the “held off the market for occasional use” category.
Is there any data to see the impact of foreign investment in properties in the seasonal or vacant category and what the international conditions are for a store of value in oppressive states?
No, but we have this:
https://wolfstreet.com/2026/08/05/another-hit-to-demand-in-the-housing-market-purchases-by-foreign-buyers-has-plunged-by-76-from-peak/
Curious how you think this plays out over the long run? It’s pretty obvious housing affordability is the number one political issue in this country right now. Young people have essentially been priced out of homeownership and I don’t think we’re going to see a major correction but if population growth continues at a slow pace and we see these kind of new build numbers over the next 2-3 years do we at least see a slight dip in sales prices and market rents as wages slowly start to catch up?
People have often said that when the Boomers get old and have to leave their houses, a bunch of inventory will come onto the market.
People have also noted that the US now has a very low birthrate, and might stop growing in population very soon if immigration slowed down.
I’m wondering if we’re starting to see the predictable outcome of both of these effects in the numbers above. I.e. I wonder if we are heading to a housing surplus, with prices falling even harder than they already have.
In my area and I suspect, due to political climate, in many parts of the country much of the investment towards new is in medium density housing which vents low end demand but will end up dragging down the entire range of housing values in the Federal loan range due to more aggressive pricing to accomplish occupied rate in these apartment projects.
As an Oakland renter, I’d consider buying if prices fell another 30%. My guess is it’s going to take about 4 more years of steady declines to hit that mark—or until ownership costs drop enough to line up with my current rent, which is already higher than what most people would pay to live in a shit-hole like Oakland, CA.
I’m curious what the mix of single family vs condo vs multi family apartments is.
This gives you an idea about the new supply from construction of single-family and multifamily. In 2025, construction was started on:
+ 943,000 privately owned single-family housing units
+ 416,000 privately owned multifamily housing units (rentals and condos in buildings of 2 or more units).
= total of 1.36 million privately owned housing units.
x 2.5 persons per average household = housing units for an additional 3.4 million people, when the population increased by maybe 800,000.
https://wolfstreet.com/2026/02/18/single-family-multifamily-construction-bring-on-the-supply-just-as-population-growth-slows-to-a-crawl/