
Who is the smart money, after the home-price explosion?
By Wolf Richter for WOLF STREET.
Mega-investors have been retreating from buying existing homes scattered all over the place, and have become net sellers, selling more than they’re buying, thereby locking in massive gains on their scatter-site homes that they’d purchased after the Housing Bust.
The publicly traded single-family landlords have been talking about this turn of events for the past couple of years in their earnings announcements. They’re still adding to their rental inventory, but by either building that inventory themselves through their own homebuilder divisions, such as American Homes 4 Rent, one of the largest single-family landlords in the US – entire developments of build-to-rent single-family homes – or by contracting with homebuilders to build those rental developments for them. Build-to-rent (BTR) adds new sorely needed rental inventory to the US housing stock, funded by corporate money.
But they have pulled back from buying scatter-site homes and have become net sellers of them. Realtor.com Economics has now put some data together for the second half of 2026 and released it today, tracking to what extent the mega investors have pulled back from buying existing homes (single-family, townhouses, and condos), and to what extent small investors have continued to pile in. Mega investors were never a big force in the overall US housing market, though once upon a time, especially after the Housing Bust, they were a substantial force in a few specific housing markets. Here’s the big picture of who is still buying; the nitty-gritty and definitions are below.
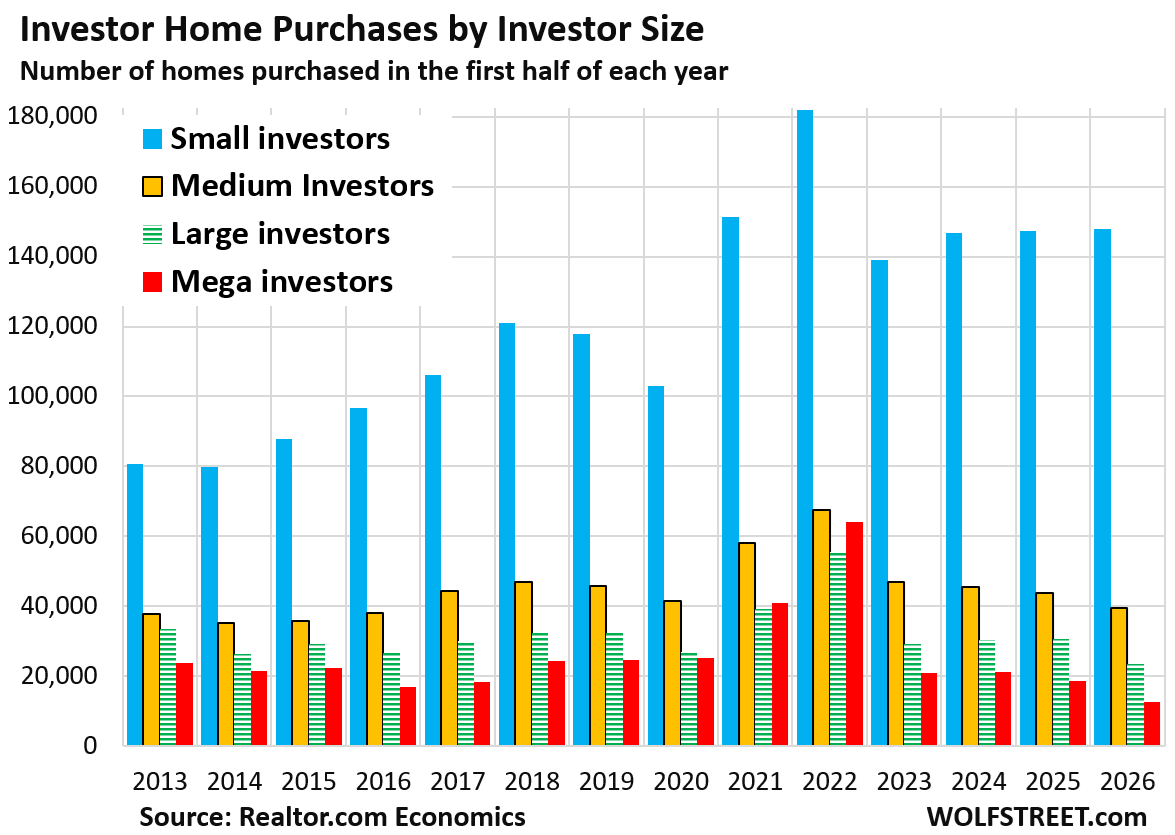
Not all mom-and-pop investors are included. The data tracks investors by corporate entity, and purchases by mom-and-pop investors that do not use a corporate entity are not included. So if the purchases by mom-and-pop investors without corporate entity were included, the blue columns in the chart above would be even taller.
These purchases reflect purchases only, and do not include sales. As purchases by large and mega-investors have collapsed, while their sales have risen, they have become net sellers, selling more than they purchased, thereby adding more inventory to the for-sale market over those years than they took off the for-sale market.
Investors were big sellers. All combined, they sold 196,000 homes (single-family, townhouses, and condos) in the first half of 2026, down by 5.5% year-over-year. Excluded are sales of new construction and foreclosed properties.
The sales accounted for 9.4% of total home sales, a slight decline in share from a year ago (9.5%). The share of investor sales has been running in this range for the past several years.
Mega & large investors pulled back, small investors piled in. All combined, investors purchased 224,000 homes (single-family, townhouses, and condos) in H1 2026, down by 7.0% year-over-year. Included in these investor purchases are new-construction and foreclosed properties.
So all combined, investors purchased 28,000 more homes than they sold. This was driven by an army of small investors (with 1-10 all-time property purchases), even as mega investors and large investors pulled back.
Mega investors (over 350 all-time purchases) and large investors (51-350 all-time purchases) were again net sellers – selling more than they purchased in H1. They have been active sellers for years; and their purchases plunged.
Purchases by mega investors (red columns in the chart above) collapsed by 80% from the peak in H1 2022, to about 12,700 properties.
Purchases by large investor (striped green columns in the chart above) plunged by 58% over the same period to about 23,300 properties.
Purchases by medium investors (11-50 all-time purchases, black-trimmed gold columns in the chart above) plunged by 41% from H1 2022, to 39,500 properties.
But purchases by small investors dropped by “only” 19% from the record in H1 2022, to about 148,000 properties (blue columns in the chart above), thereby dramatically increasing their share of all investor purchases.
Non-investor purchases plunged by 31% since H1 2022. So mega-investors with an 80% plunge, large investors with a 58% plunge, and medium investors with a 41% plunge have dramatically stepped back from the already declining market.
But small investors have gained share as their purchases dropped by only 19%. Small investors have been and remain a force in the overall housing market.

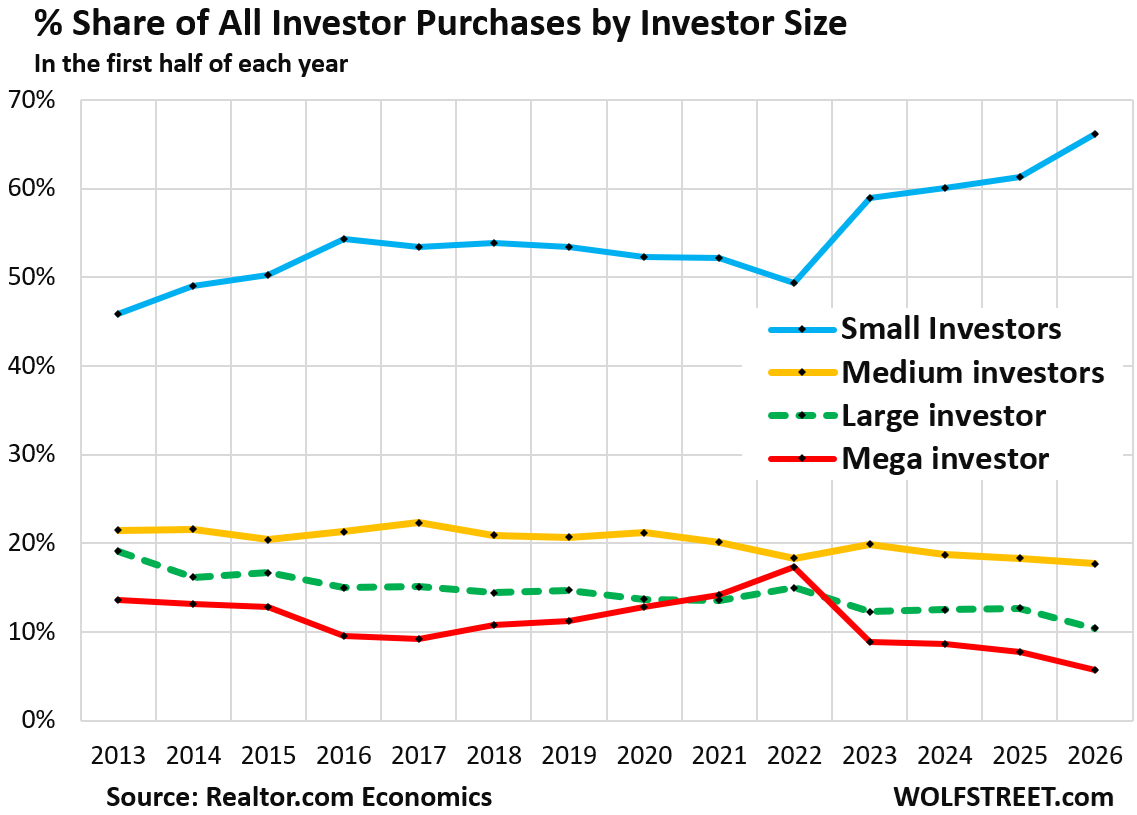
Small investors’ share of all investor purchases rose to 66.2% in the first half of 2026, a record in the data, up from 45.9% in the first half of 2013 (blue line in the chart below).
The share of all other investors declined, with the share of mega-investors dropping to a record low of 5.7% (red line), and the share of large investors dropping to a record low of 10.4% (dotted green line).
Small investors have been, and continued to be, the driving force. There are millions of them, each buying a home every now and then, but together buying up large numbers of homes and putting them on the rental market. But the figures here exclude small investors that do not use a corporate entity for their purchases, such as many mom-and-pop investors.
Clearly, small investors still think that buying rental properties after the home-price explosion from mid-2020 to mid-2022 is the eldorado, while the smart money has stepped back?
Enjoy reading WOLF STREET and want to support it? You can donate. I appreciate it immensely. Click on the mug to find out how:


Does this include buy-to-STR? It will be interesting to see how the new changes to AirBNB rules (which mega-hosts who manage tens of properties are very pissed about) will affect those net purchases.
There is no distinction as to what types of rentals these properties are used for. And the type of rental could change, such as a property gets purchased for long-term rental, but then the investor cannot get the rent needed to cover the monthly nut, and loses too much cash flow, and decides to put it on the short-term rental (STR) market.
Oof – another very very bad sign. So basically, the people with the market intelligence to know are getting out, handing future losses to optimistic up and comers trying yet another way to make it…
Anyone else feel like we’re about to go off the cliff?