
In another 13 bigger cities, prices fell by 9% to 10%. But San Francisco’s market goes haywire as AI mania money spills into housing.
By Wolf Richter for WOLF STREET.
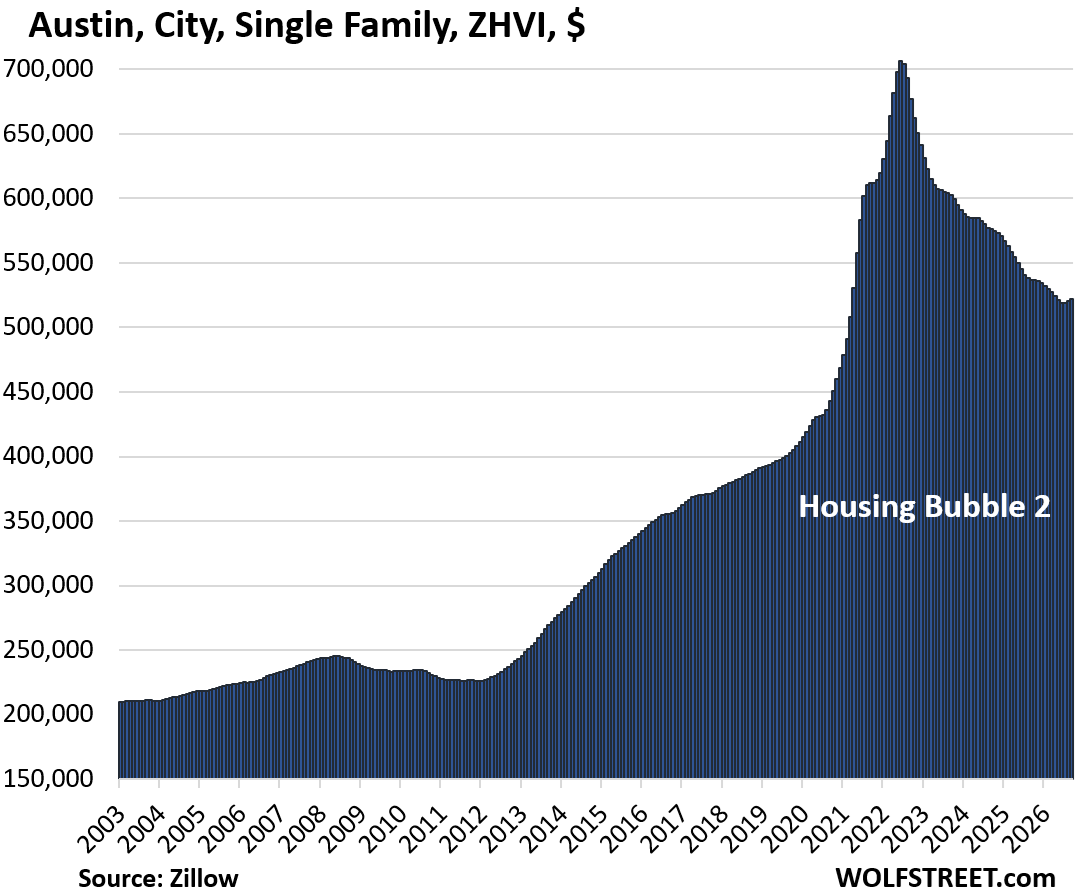
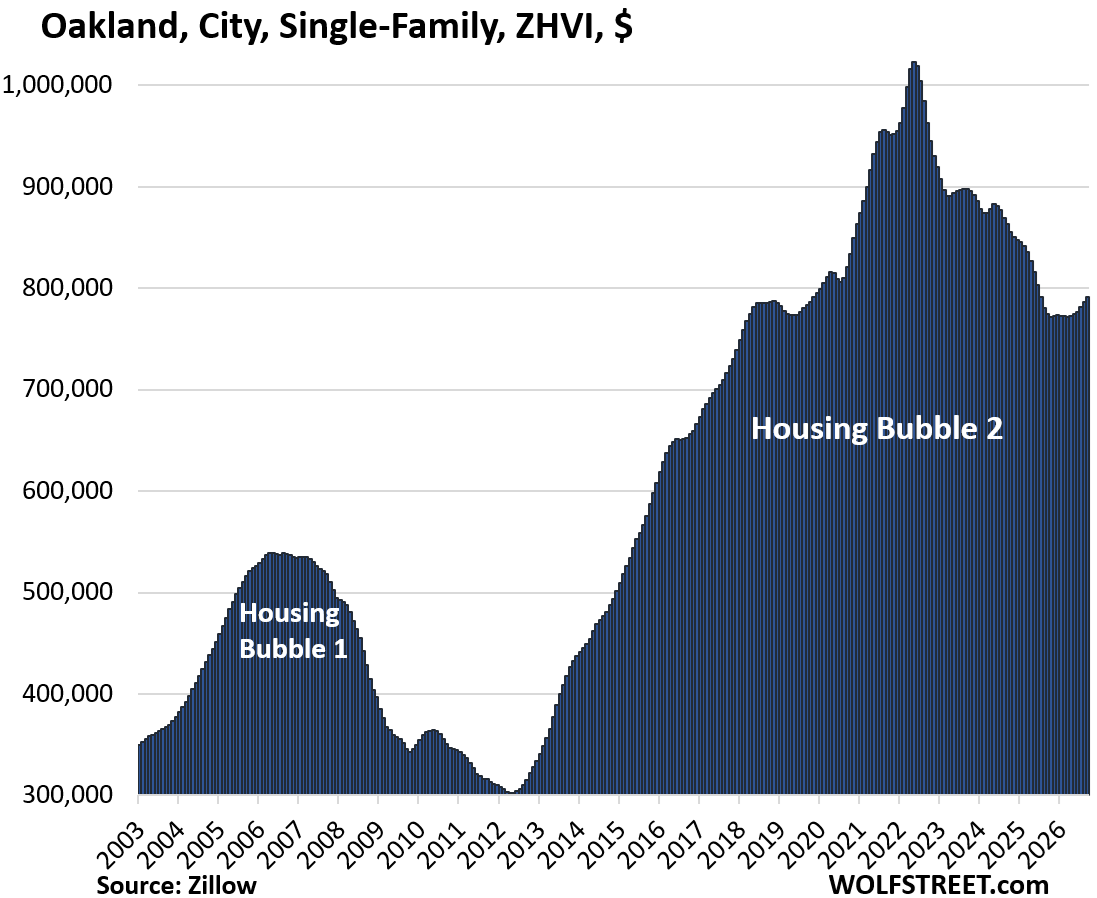
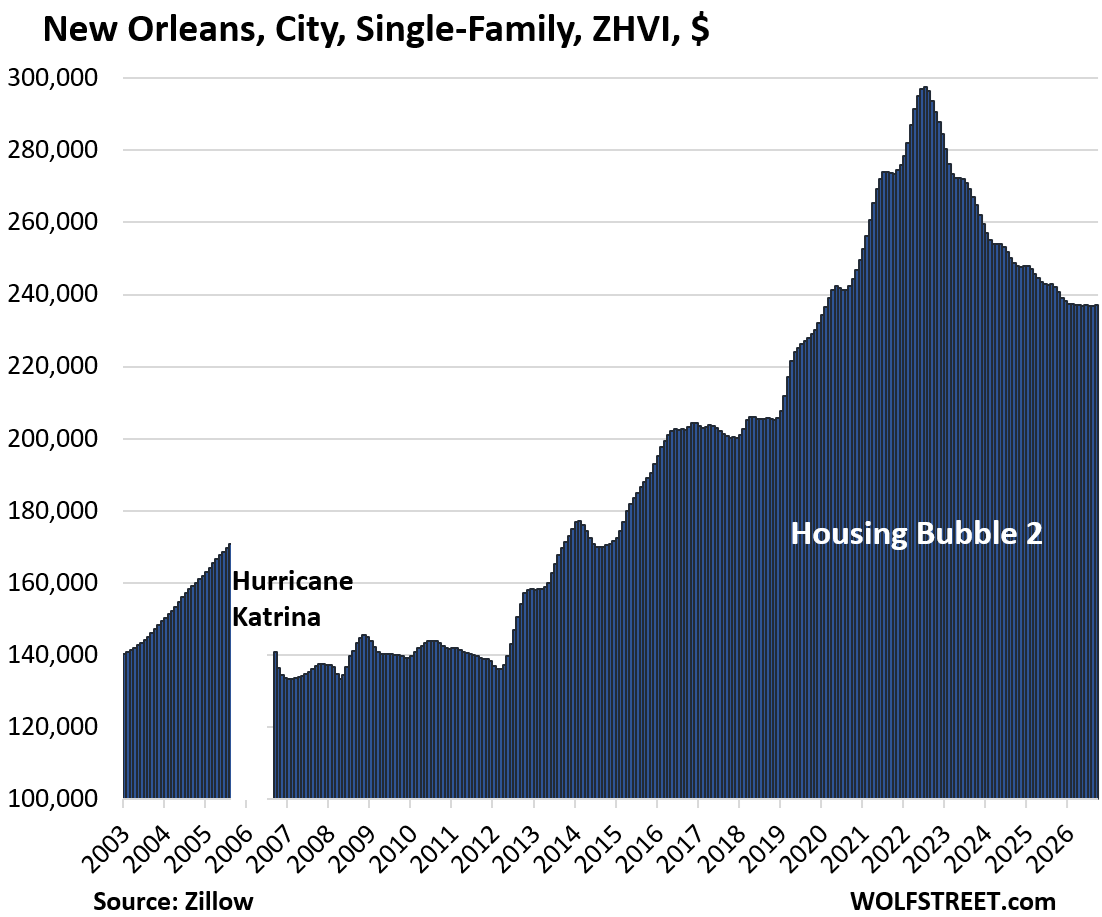
Prices of mid-tier single-family homes have dropped by 11% to 26% seasonally adjusted in these 16 bigger cities and counties through September, from their respective peaks in prior years. For 14 of them, those peaks occurred in mid-2022; for two of them, the peaks occurred in 2024. These are major markets where the affordability crisis has softened a little.
| City or County, through Sept. 2026 | From peak | Year of peak | ||
| 1 | Austin | TX | -26% | 2022 |
| 2 | Oakland | CA | -23% | 2022 |
| 3 | New Orleans | LA | -20% | 2022 |
| 4 | Lee County (Cape Coral, Fort Myers) | FL | -18% | 2022 |
| 5 | Birmingham | AL | -17% | 2022 |
| 6 | Sarasota County | FL | -17% | 2022 |
| 7 | McKinney | TX | -14% | 2022 |
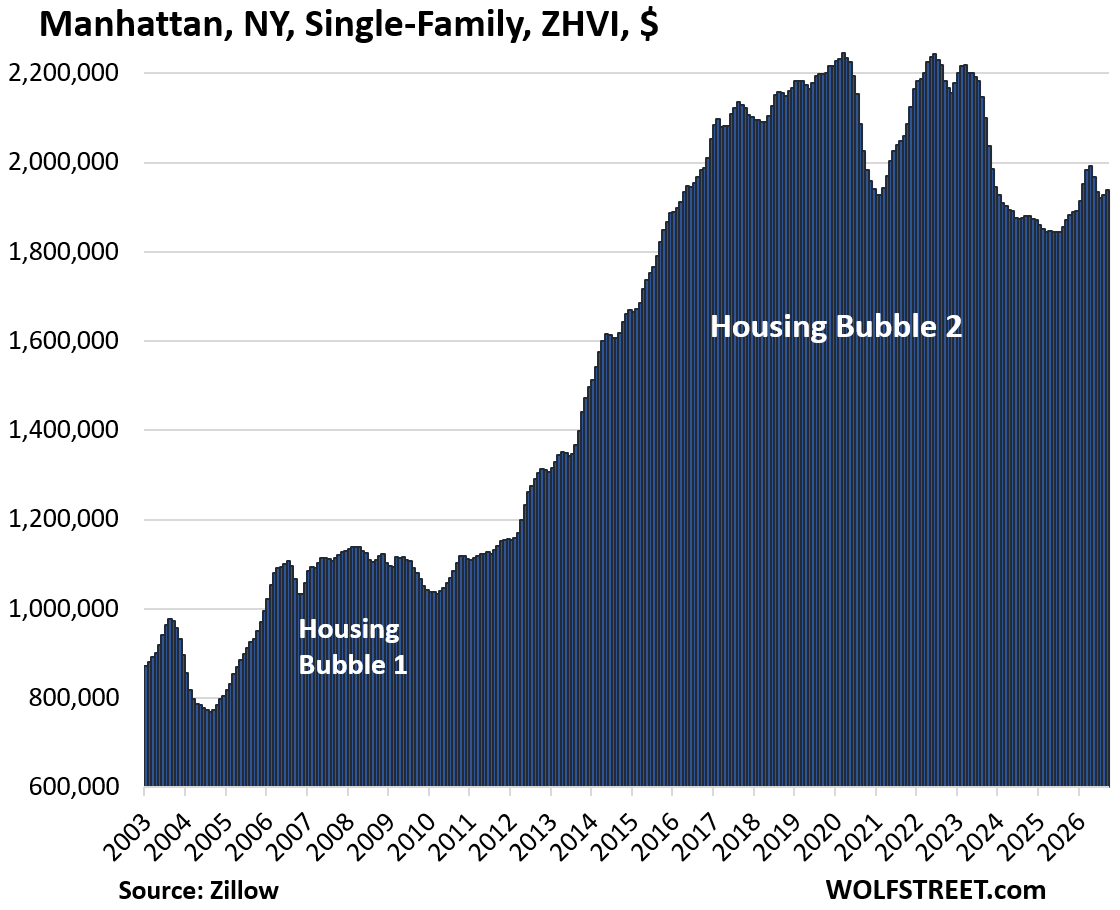
| 8 | Manhattan | NY | -14% | 2022 |
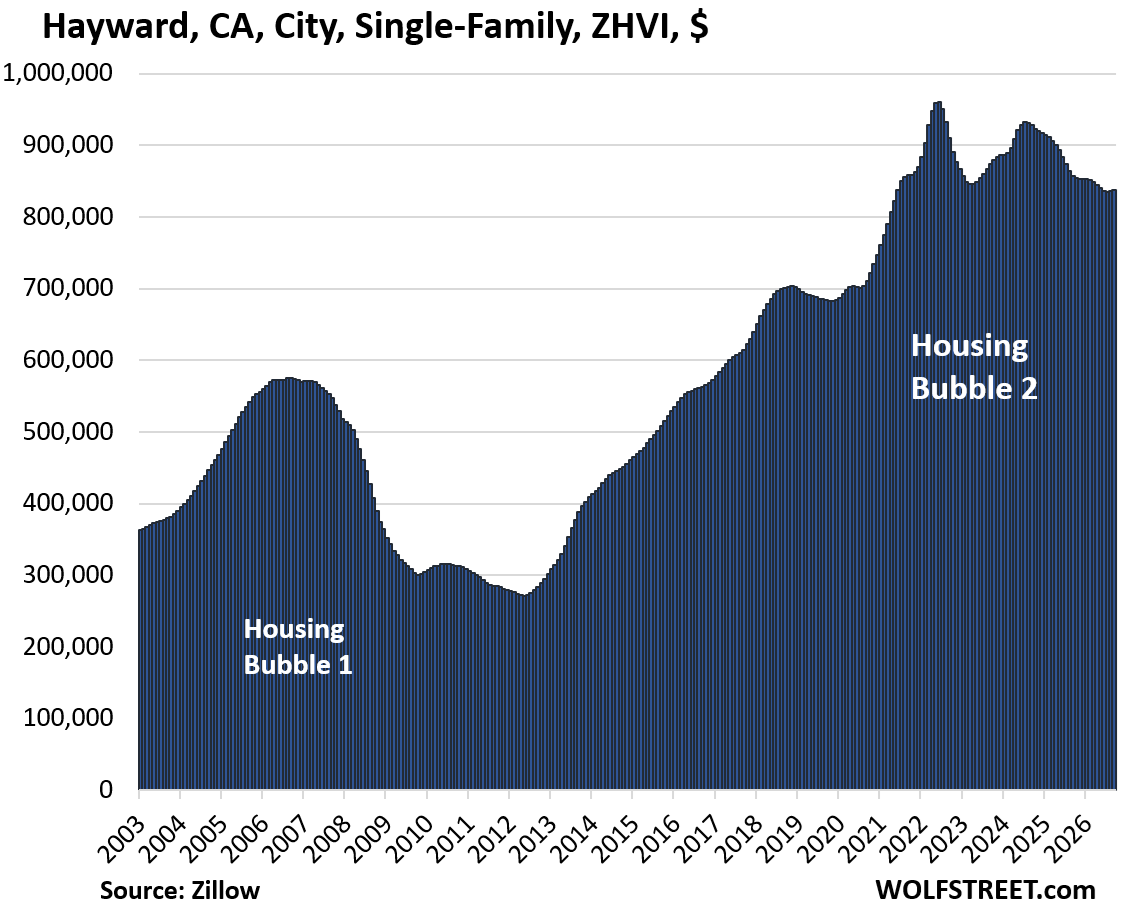
| 9 | Hayward | CA | -13% | 2022 |
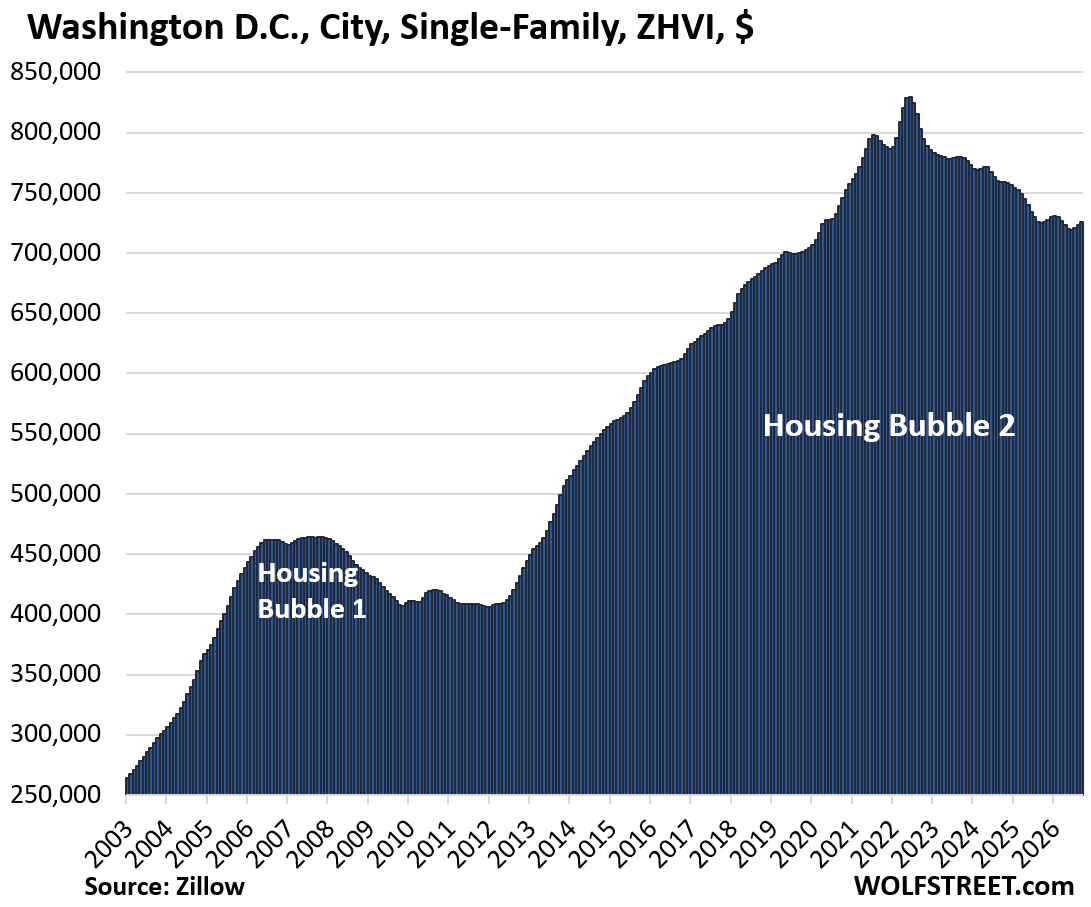
| 10 | Washington | DC | -13% | 2022 |
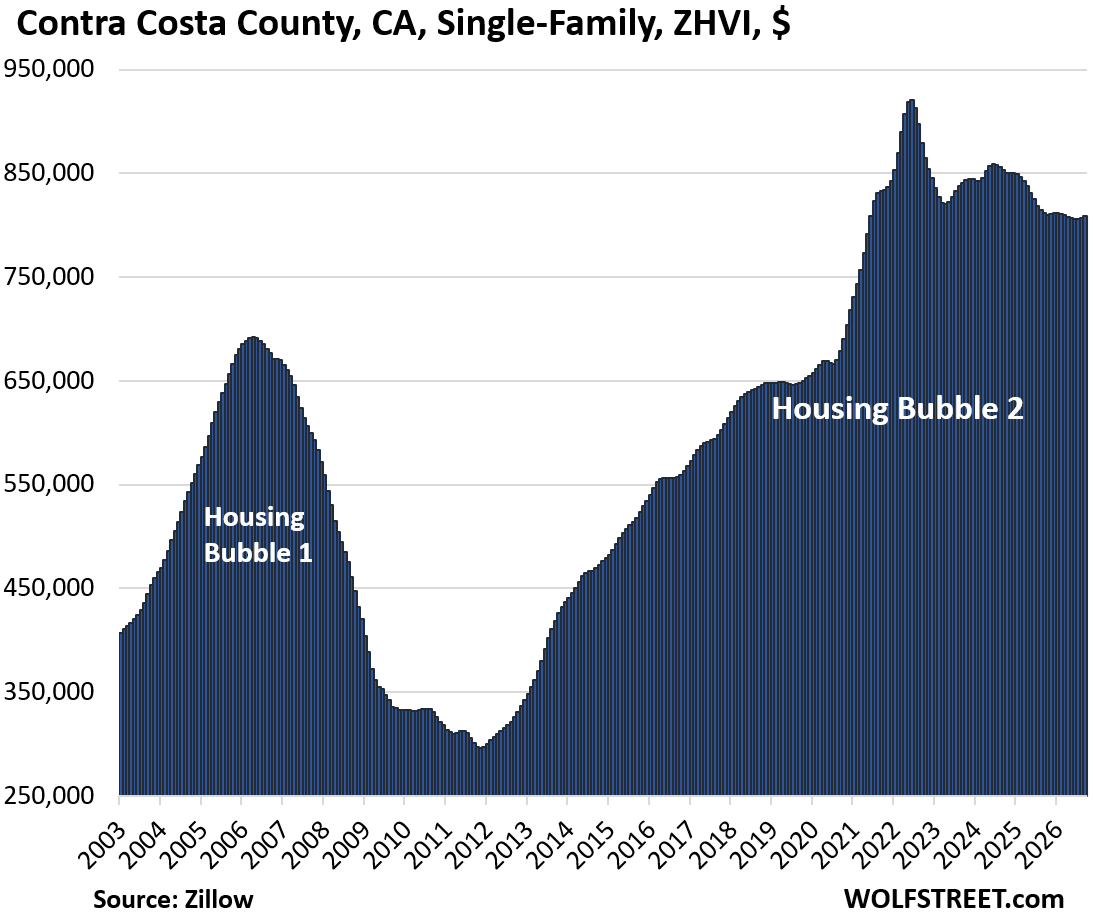
| 11 | Contra Costa County (East Bay) | CA | -12% | 2022 |
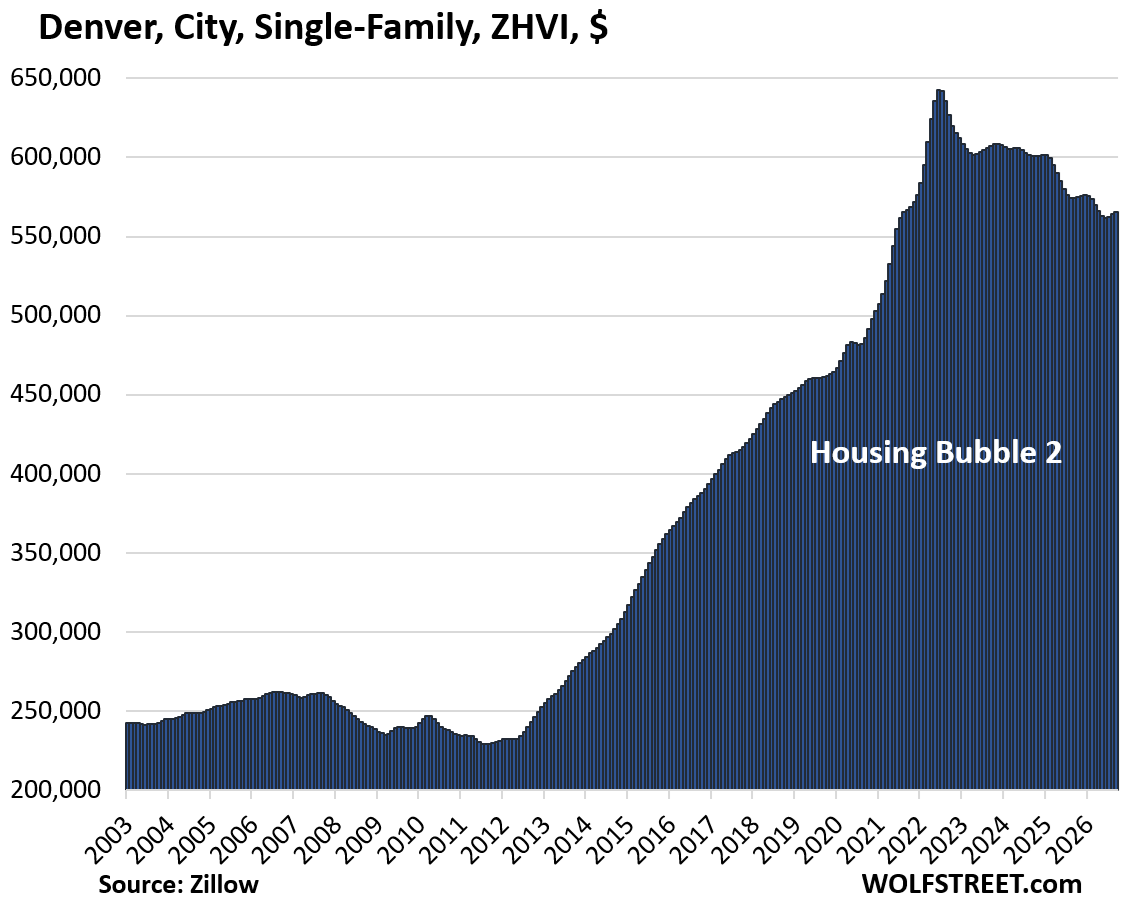
| 12 | Denver | CO | -12% | 2022 |
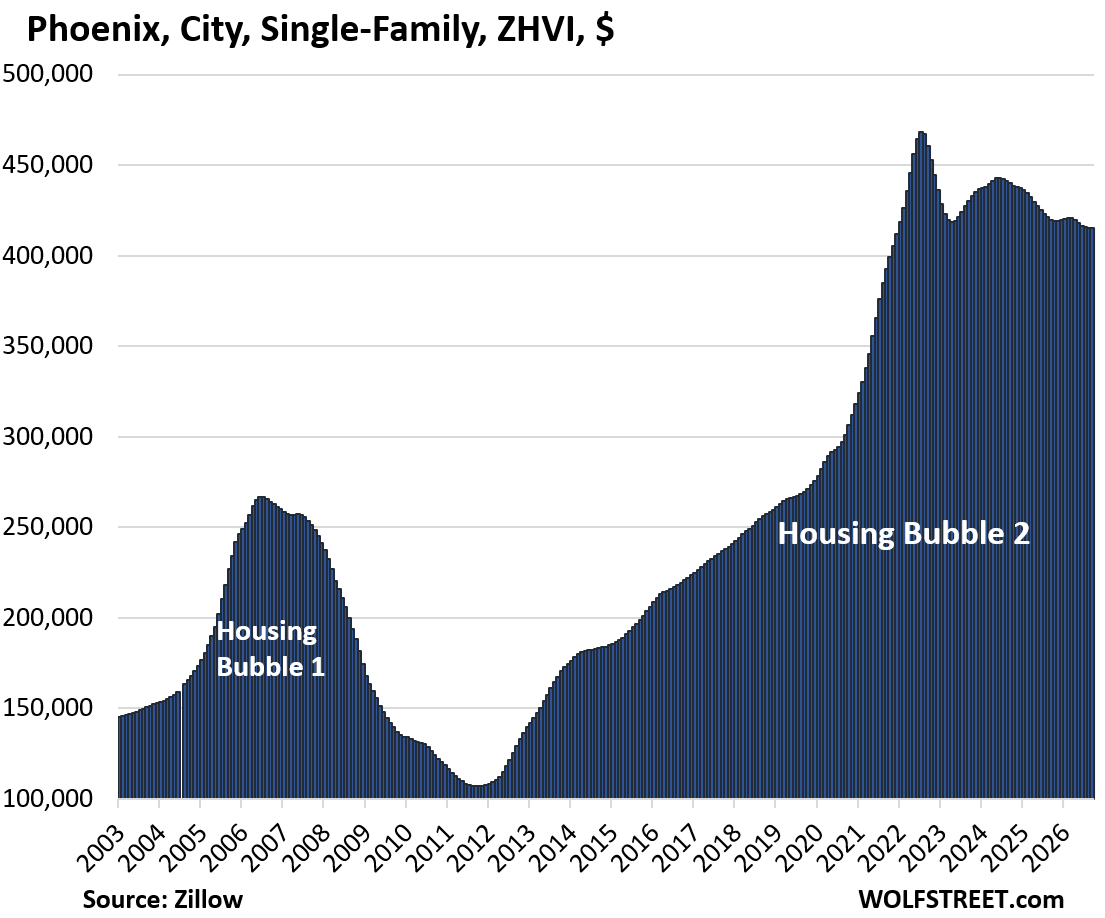
| 13 | Phoenix | AZ | -11% | 2022 |
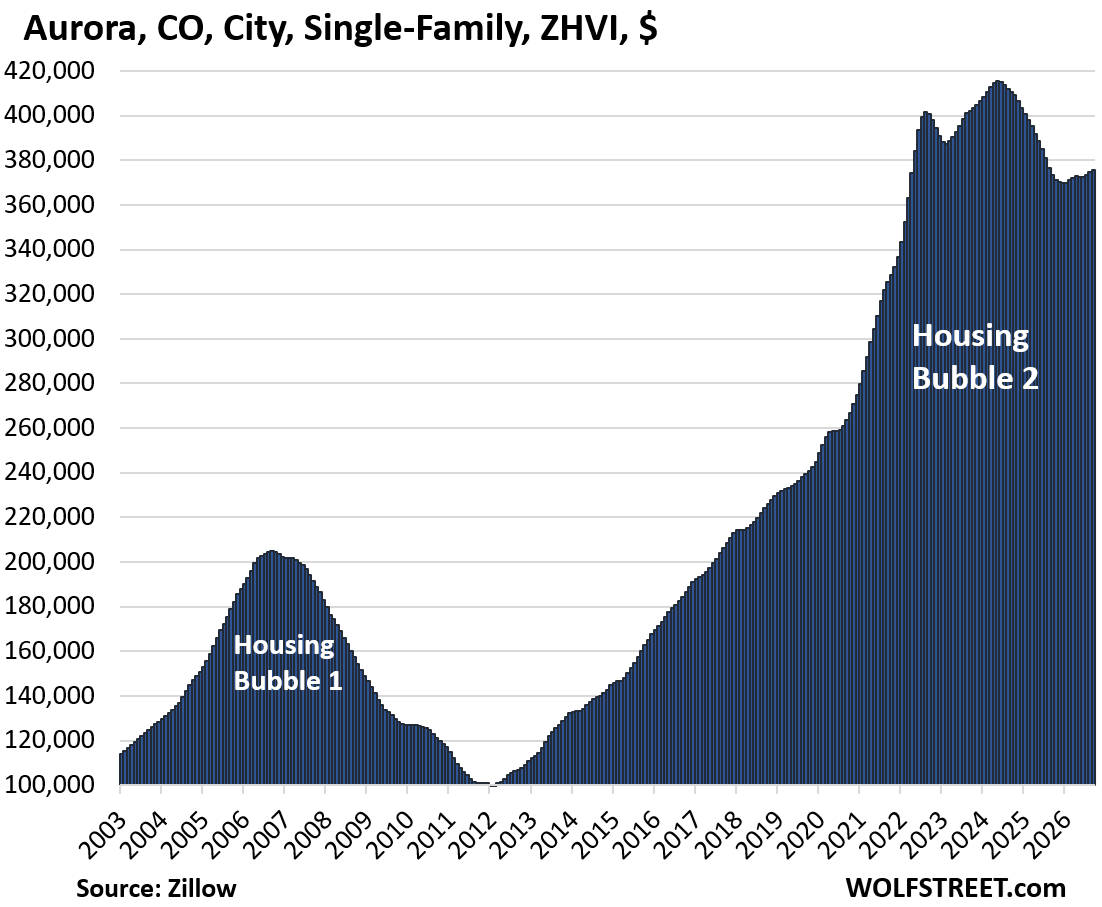
| 14 | Aurora | CO | -11% | 2024 |
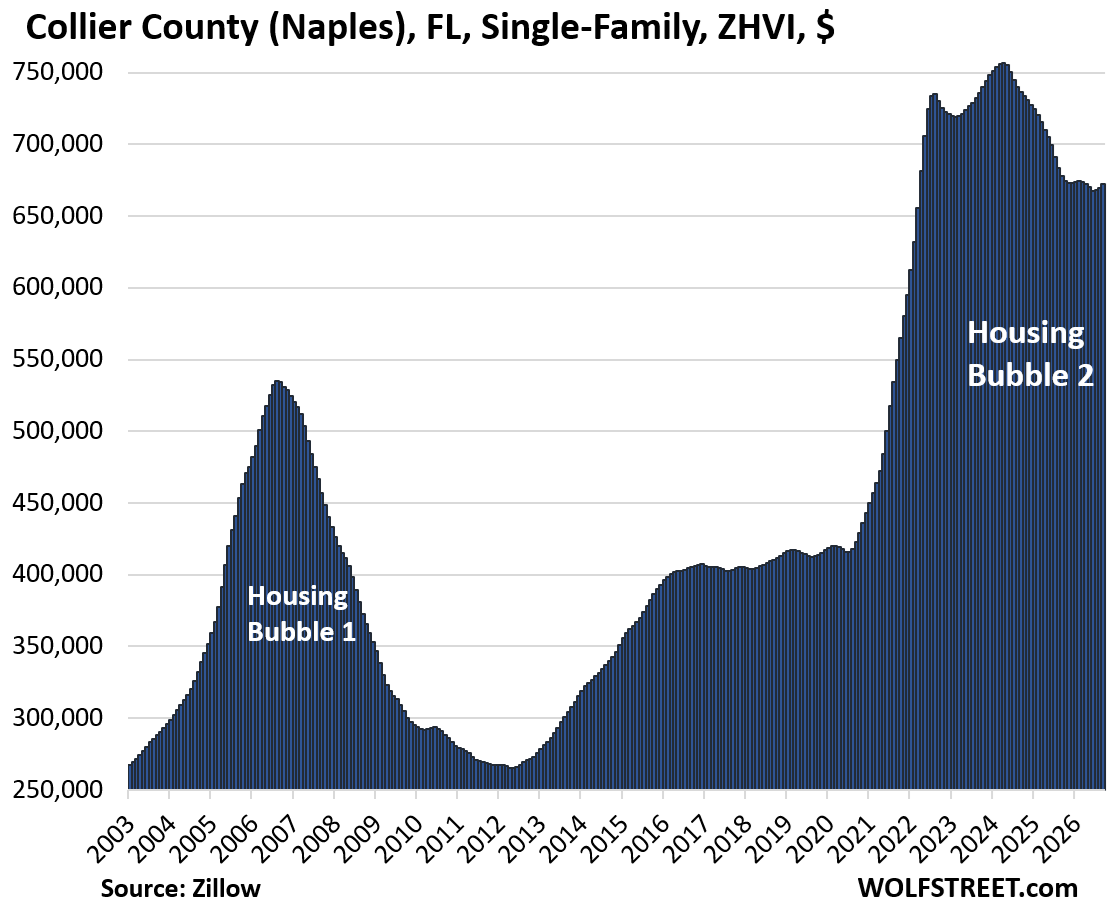
| 15 | Collier County (Naples) | FL | -11% | 2024 |
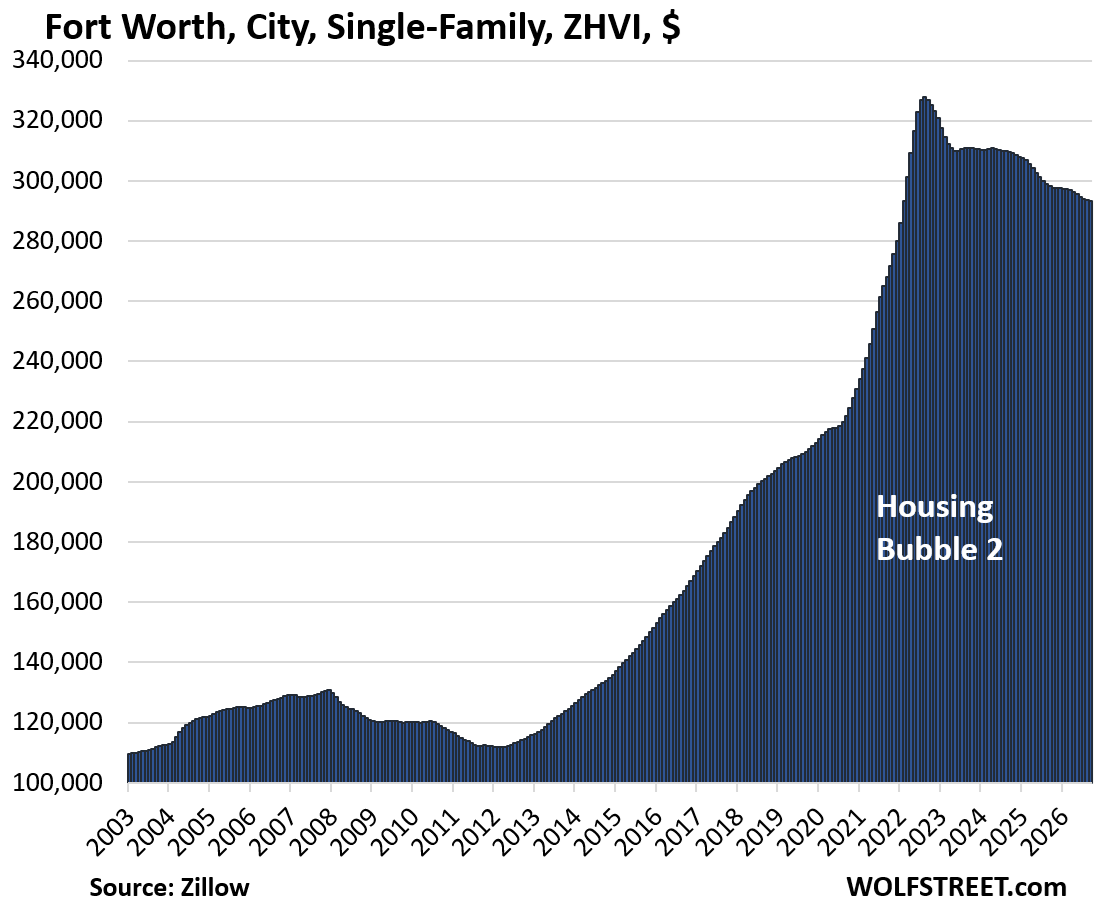
| 16 | Fort Worth | TX | -11% | 2022 |
Texas has three entries on this list, including the #1 Austin. The other two are in the Dallas-Fort Worth area: McKinney (-14%) and Fort Worth (-11%). San Antonio (-10%), Dallas (-7%), Frisco (-10%), Garland (-9%), Plano (-9%), Arlington (-7%), Katy (-7%), and Houston (-6%) are included in the list below of those cities where prices dropped by less than 11%.
Florida has three markets on this list (2 counties and 1 city). The cities in these two counties – some of them well-known cities – are too small to make the list on their own. The single-family market in Florida isn’t nearly as weak as the condo market.
California has three markets on the list: #2 Oakland (-23%); Hayward (-13%) on the eastern shore of the San Francisco Bay; and Contra Costa County (-12%) in the East Bay, comprising Concord, Antioch, Pittsburg, Walnut Creek, Richmond, San Ramon, and many other smaller cities.
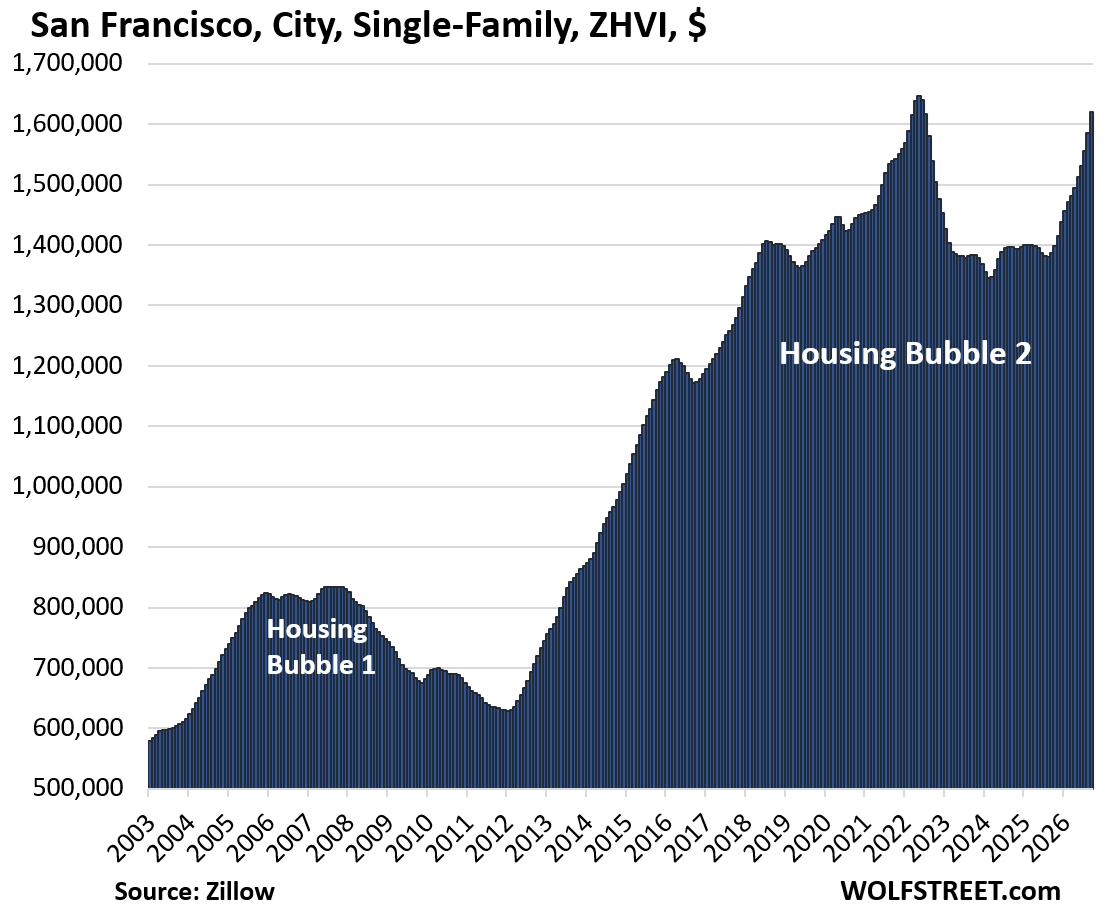
But the City of San Francisco, which had been #4 on this list in July 2025 with a decline of 15%, has come off the list earlier this year as the housing market suddenly got flooded with the enormous amounts of money that the massively money-losing AI companies in the City, topped by OpenAI and Anthropic, are paying their people, who are throwing this money around left and right, willy-nilly, a relatively small number of them, but with suddenly lots of money, and the housing market – both for sale and rental – has gone absolutely haywire. This is where some of the money that investors plowed into these companies has ended up.
At this crazy pace (+2.2% month-to-month, +17% year-over-year), the price of a mid-tier single-family home ($1.62 million in September) will surpass the 2022 high and set a new high in a month or two. Prices are up by nearly 300% since 2000.
The cities that didn’t make the 11% cutoff:
There are many other bigger cities where mid-tier single-family home prices have declined from their respective peaks in prior years, but by less than 11%. Here is a sample:
| City | From peak | Year of peak | ||
| 1 | San Antonio | TX | -10% | 2022 |
| 2 | Glendale | AZ | -10% | 2022 |
| 3 | Chandler | AZ | -10% | 2022 |
| 4 | Frisco | TX | -10% | 2022 |
| 5 | St. Petersburg | FL | -10% | 2024 |
| 6 | Memphis | TN | -9% | 2022 |
| 7 | Mesa | AZ | -9% | 2022 |
| 8 | Garland | TX | -9% | 2024 |
| 9 | Seattle | WA | -9% | 2022 |
| 10 | Sacramento | CA | -9% | 2022 |
| 11 | Portland | OR | -9% | 2022 |
| 12 | Plano | TX | -9% | 2024 |
| 13 | Gilbert | AZ | -9% | 2022 |
| 14 | Colorado Springs | CO | -8% | 2022 |
| 15 | Stockton | CA | -8% | 2022 |
| 16 | Arlington | TX | -7% | 2022 |
| 17 | Katy | TX | -7% | 2022 |
| 18 | Dallas | TX | -7% | 2024 |
| 19 | Atlanta | GA | -6% | 2022 |
| 20 | Fremont | CA | -6% | 2025 |
| 21 | Port Saint Lucie | FL | -6% | 2022 |
| 22 | Boston | MA | -6% | 2025 |
| 23 | Lakeland | FL | -6% | 2024 |
| 24 | Tampa | FL | -6% | 2024 |
| 25 | Houston | TX | -6% | 2024 |
| 26 | Durham | NC | -5% | 2024 |
| 27 | Orlando | FL | -5% | 2024 |
| 28 | Salt Lake City | UT | -5% | 2022 |
| 29 | Tucson | AZ | -5% | 2024 |
| 30 | Spokane | WA | -5% | 2022 |
| 31 | San Jose | CA | -5% | 2025 |
| 32 | Jacksonville | FL | -5% | 2024 |
| 33 | Boise | ID | -5% | 2022 |
| 34 | Las Vegas | NV | -5% | 2025 |
| 35 | Henderson | NV | -5% | 2022 |
| 36 | Raleigh | NC | -4% | 2022 |
| 37 | San Diego | CA | -4% | 2024 |
| 38 | Nashville | TN | -4% | 2023 |
| 39 | Los Angeles | CA | -4% | 2024 |
Methodology and data: These prices are seasonally adjusted three-month averages of single-family mid-tier homes in “cities” or “counties.” All data here are from the Zillow Home Value Index (ZHVI), which is based on millions of data points in Zillow’s “Database of All Homes,” including from public records (tax data), MLS, brokerages, local Realtor Associations, real-estate agents, and households across the US. It includes pricing data for off-market deals and for-sale-by-owner deals. These are not median prices.
The 16 bigger cities with price declines of 11% to 26%:
The metrics in each table from left to right: price decline from the peak, month-over-month change (MoM), year-over-year change (YoY), and the remaining increase since January 2000.
| Austin, City, Single-Family Home Prices | |||
| From Jun 2022 peak | MoM | YoY | Since 2000 |
| -26% | 0.3% | -2.8% | 159% |
| Oakland, City, Single-Family Home Prices | |||
| From May 2022 peak | MoM | YoY | Since 2000 |
| -23% | 0.6% | 2.2% | 286% |
| New Orleans, City, Single-Family Home Prices | |||
| From Jun 2022 peak | MoM | YoY | Since 2007 |
| -20% | 0.1% | -2.1% | 103% |

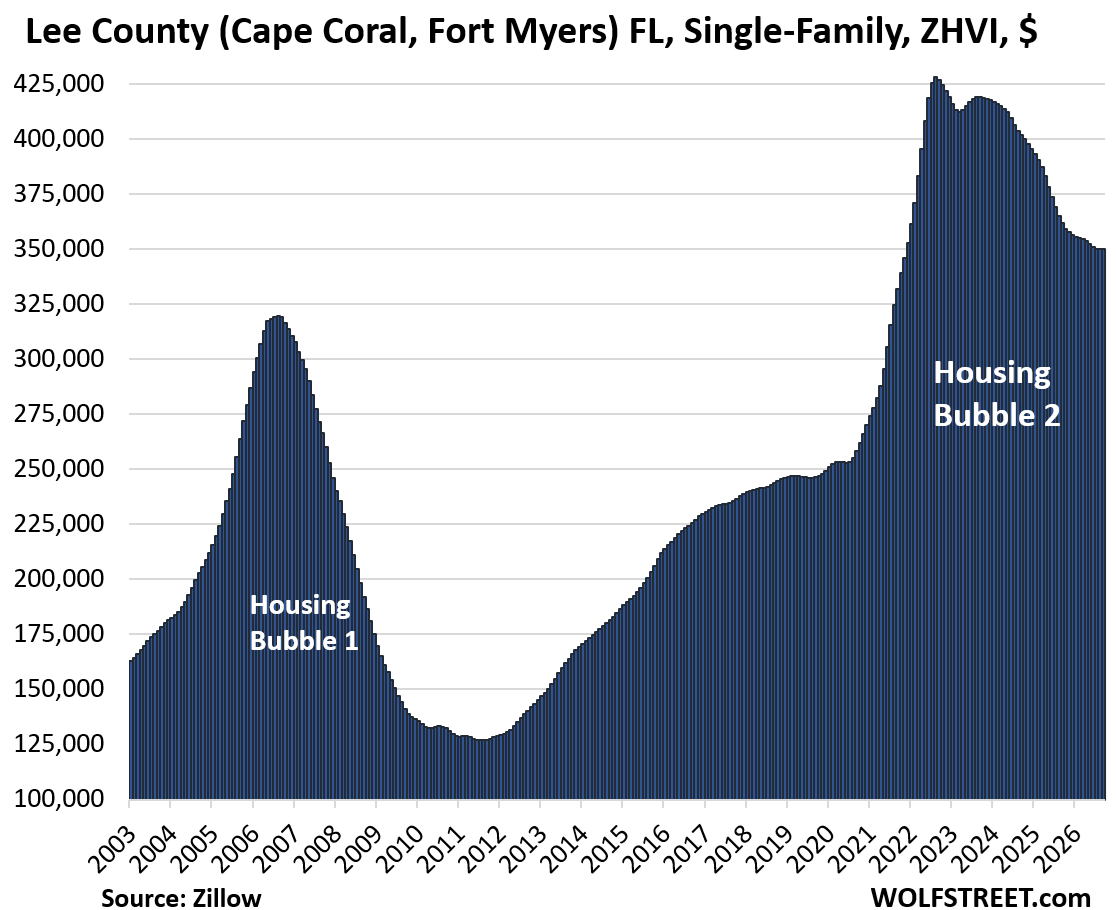
| Lee County, FL, Single-Family Home Prices | |||
| From Aug 2022 peak | MoM | YoY | Since 2000 |
| -18% | 0.0% | -3.2% | 181% |
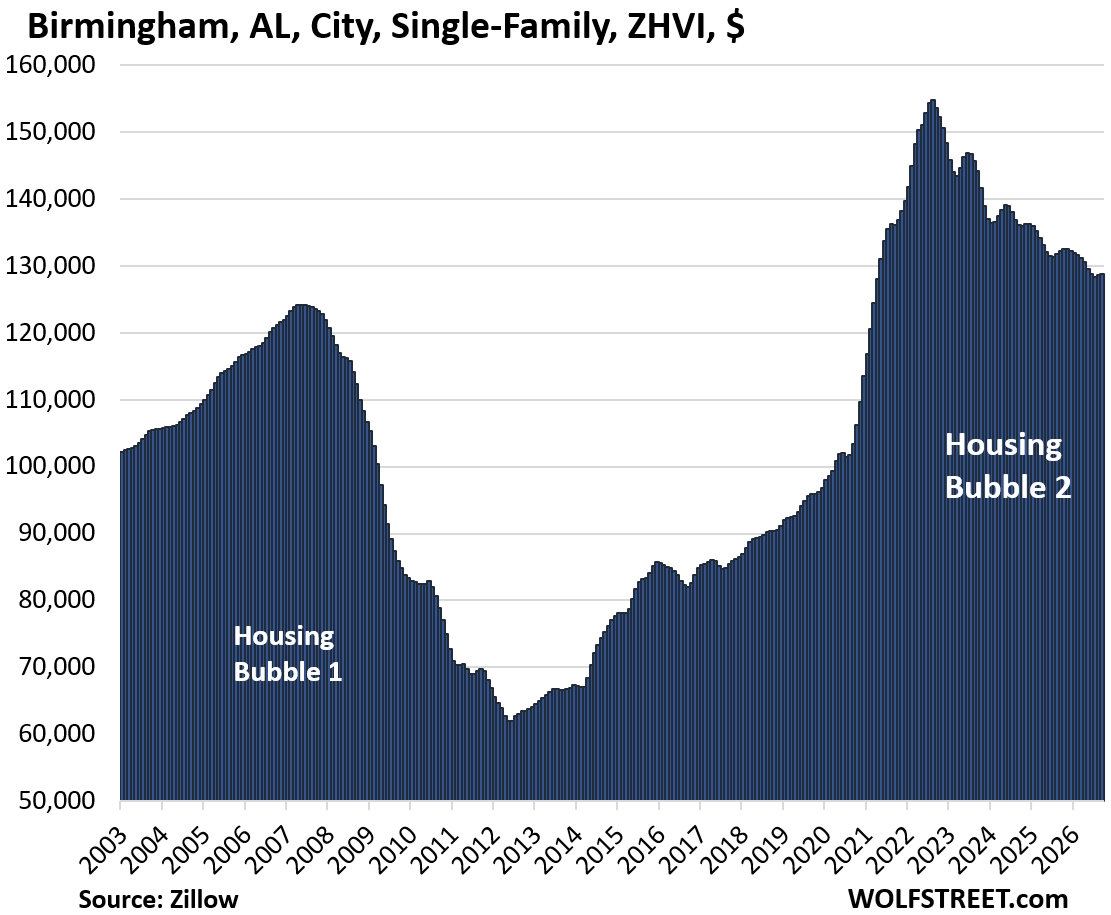
| Birmingham, AL, City, Single-Family Home Prices | |||
| From Jul 2022 peak | MoM | YoY | Since 2002 |
| -17% | 0.2% | -2.5% | 32% |
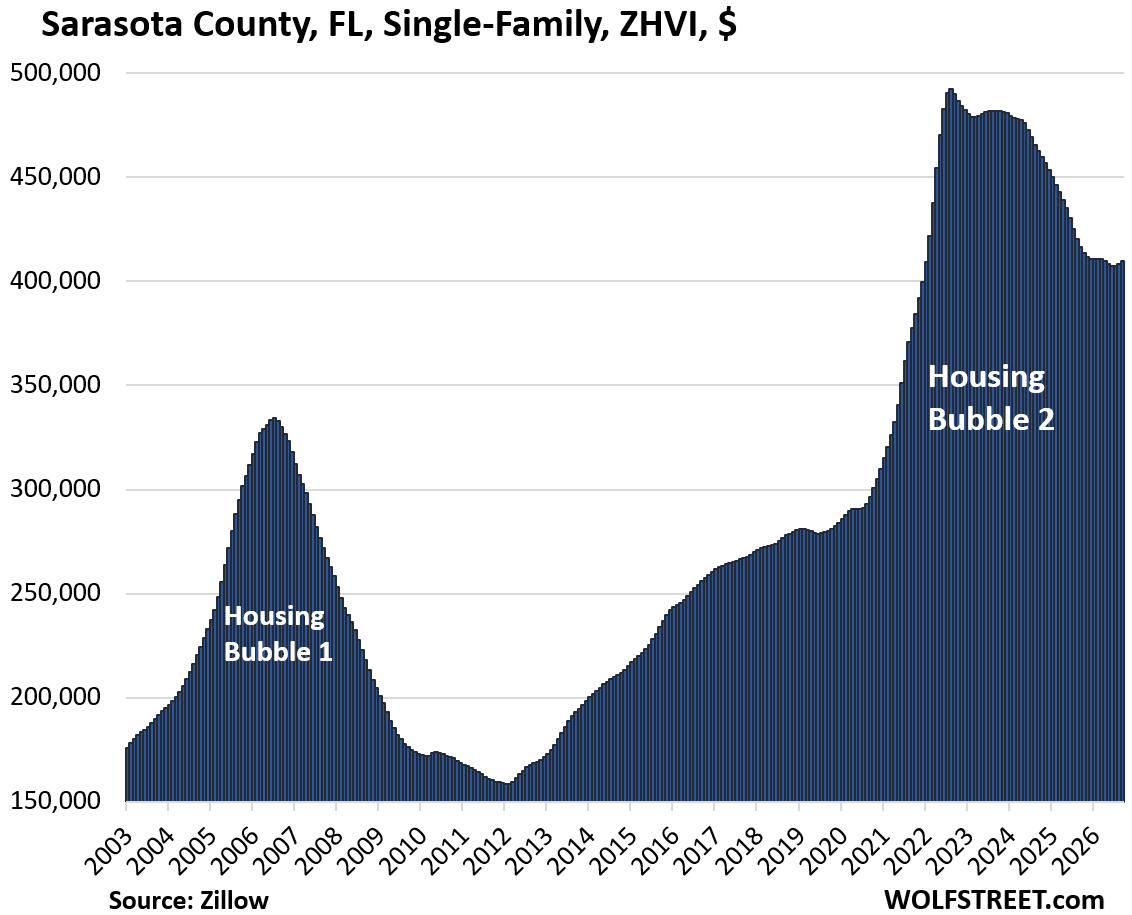
| Sarasota County, FL, Single-Family Home Prices | |||
| From Aug 2022 peak | MoM | YoY | Since 2000 |
| -17% | 0.4% | -1.6% | 211% |
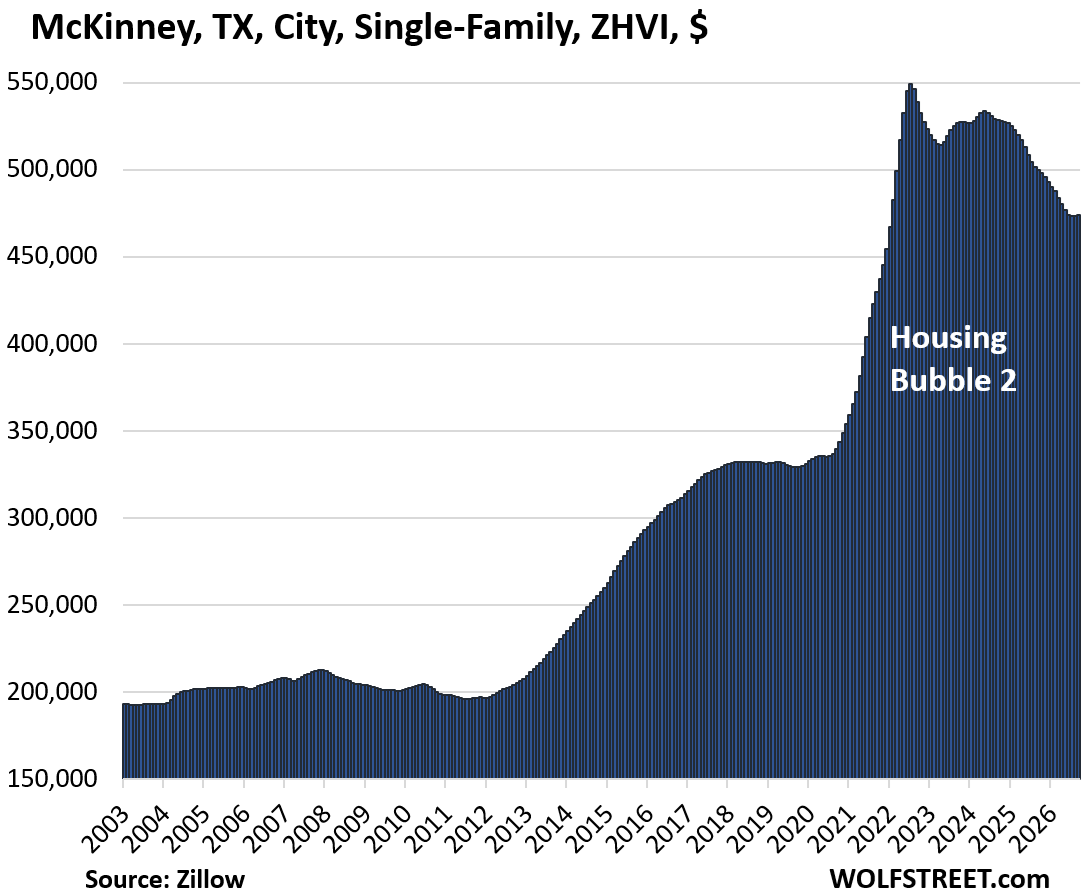
| McKinney, TX, City, Single-Family Home Prices | |||
| From Aug 2022 peak | MoM | YoY | Since 2000 |
| -14% | 0.2% | -5.1% | 150% |
| Manhattan (New York County), NY, Single-Family Home Prices | |||
| From Jun 2022 peak | MoM | YoY | Since 2000 |
| -14% | 0.5% | 3.5% | 304% |
| Hayward, CA, City, Single-Family Home Prices | |||
| From Aug 2022 peak | MoM | YoY | Since 2000 |
| -13% | 0.1% | -2% | 265% |
| Washington D.C., Single-Family Home Prices | |||
| From Jun 2022 peak | MoM | YoY | Since 2000 |
| -13% | 0.3% | 0.1% | 272% |
| Contra Costa County, CA, Single-Family Home Prices | |||
| From Jun 2022 peak | MoM | YoY | Since 2000 |
| -12% | 0.2% | -0.3% | 192% |
| Denver, City, Single-Family Home Prices | |||
| From Jun 2022 peak | MoM | YoY | Since 2000 |
| -12% | 0.2% | -1.5% | 207% |
| Phoenix, City, Single-Family Home Prices | |||
| From Jul 2022 peak | MoM | YoY | Since 2000 |
| -11% | 0.0% | -1.1% | 244% |
| Aurora, CO, City, Single-Family Home Prices | |||
| From May 2024 peak | MoM | YoY | Since 2000 |
| -11% | 0.0% | -2.4% | 189% |
| Collier County, FL, Single-Family Home Prices | |||
| From Mar 2024 peak | MoM | YoY | Since 2000 |
| -11% | 0.4% | -0.8% | 241% |
| Fort Worth, City, Single-Family Home Prices | |||
| From Aug 2022 peak | MoM | YoY | Since 2000 |
| -11% | 0.0% | -1.6% | 186% |
Enjoy reading WOLF STREET and want to support it? You can donate. I appreciate it immensely. Click on the mug to find out how:


Thanks WR,
Good to see San Diego aka SD in the list. Slowly but surely prices are going down from insane levels.